ON DECK FOR THURSDAY, JUNE 12
KEY POINTS:
- Trump drives stocks lower…
- …on a pledge to bring forward July 9th tariff deadline
- US PPI: yawn, it’s all made-up data anyhow
- UK economy soured in April
- India’s inflation rate ebb, but core increased
Stocks are broadly in the red after Trump's latest tariff threat. Sovereign yields are broadly lower and so is the USD. Soft UK data isn't helping that market. There remains some focus on US inflation with PPI on tap. Boeing is down after an Air India crash.
TRUMP ESCALATES TARIFF THREATS AGAIN
Trump brought forward the July 9th tariff deadline for reciprocal tariffs to instead roughly two weeks from now when he claims he will set unilateral tariffs and send letters to various countries. Take everything he says with extreme caution given his unstable ways. The aim is likely to try to force others to negotiate where progress has been poor. I doubt it works versus inviting renewed measures by China, Europe etc.
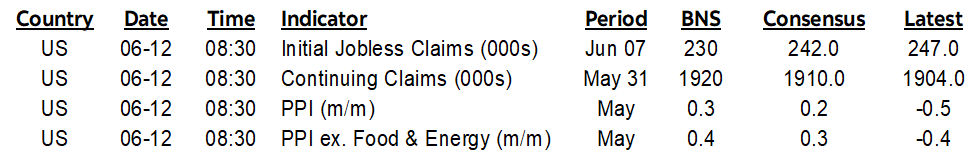
US PPI TO FURTHER INFORM PCE ESTIMATE
It's less about the consensus expectations for total producer prices (0.2% m/m SA) and core (0.3%) and more about the components that feed into PCE calculations. That might have a marginal effect on PCE estimates in the wake of the soft CPI figures.
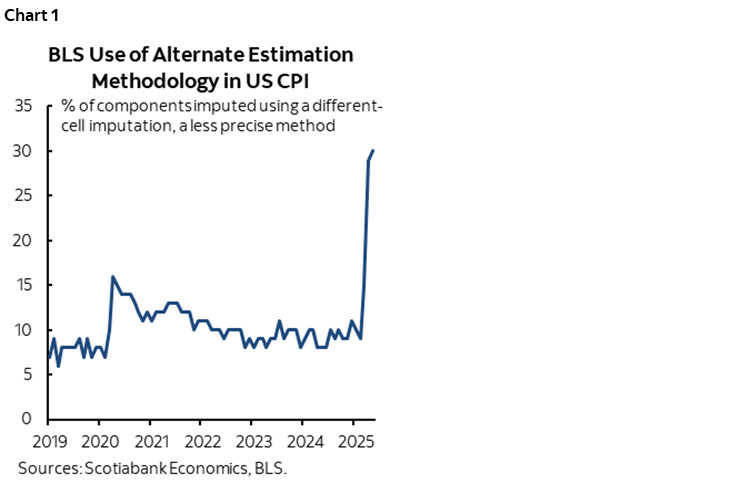
Nevertheless, US inflation data quality is low at the worst possible time. For a second month, the share of the CPI basket that was imputed by alternative means over harder data was 30%, triple the normal share before Trump's budget cuts hit the BLS (here and here). That’s double the share at the start of the pandemic when the BLS couldn’t send out its army of data gatherers (chart 1). The BLS never materially revised the inflation figures at that time which simply says you can’t re-send the data gatherers back into the field to gather prior prices months later! Therefore, we’re probably stuck with unreliable or highly questionable data. The effect is to compound uncertainty and this means the Fed may be even more patient. The US also updates weekly initial jobless claims (8:30amET).
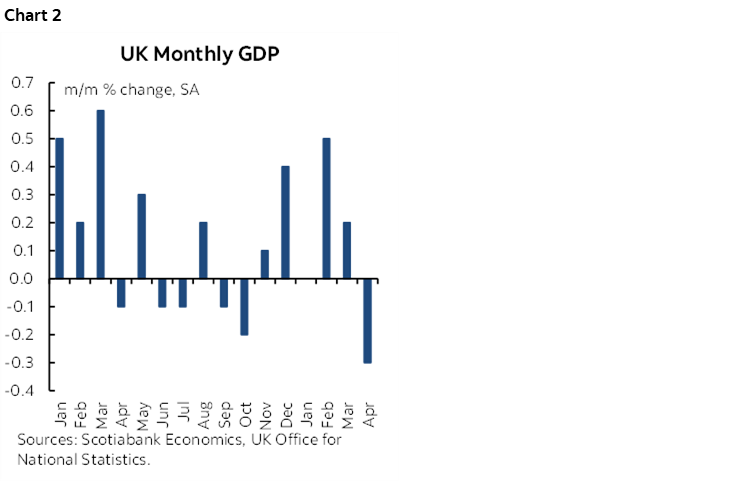
UK ECONOMY STUMBLES
The UK economy stumbled with worse than expected figures for April. GDP shrank by 0.3% m/m, tripling what consensus feared (chart 2). Industrial output was down by six-tenths (-0.7% consensus) and led by a nearly 1% drop in manufacturing. Services shrank four times faster than consensus with a -0.4% drop. Construction was solid again with a 0.9% jump. Exports fell by 3.4% m/m with imports up 1%.
INDIA’S INFLATION RATE EBBS, BUT CORE INCREASED
India’s inflation rate pulled back by more than expected in May. CPI was up 2.8% y/y (3.2% prior, 3% consensus) which is the weakest reading in about six years. Still, core inflation picked up to 4.3% y/y which is the highest since October 2023. Markets have little chance of a rate move at the RBI’s next decision on August 6th.
DISCLAIMER
This report has been prepared by Scotiabank Economics as a resource for the clients of Scotiabank. Opinions, estimates and projections contained herein are our own as of the date hereof and are subject to change without notice. The information and opinions contained herein have been compiled or arrived at from sources believed reliable but no representation or warranty, express or implied, is made as to their accuracy or completeness. Neither Scotiabank nor any of its officers, directors, partners, employees or affiliates accepts any liability whatsoever for any direct or consequential loss arising from any use of this report or its contents.
These reports are provided to you for informational purposes only. This report is not, and is not constructed as, an offer to sell or solicitation of any offer to buy any financial instrument, nor shall this report be construed as an opinion as to whether you should enter into any swap or trading strategy involving a swap or any other transaction. The information contained in this report is not intended to be, and does not constitute, a recommendation of a swap or trading strategy involving a swap within the meaning of U.S. Commodity Futures Trading Commission Regulation 23.434 and Appendix A thereto. This material is not intended to be individually tailored to your needs or characteristics and should not be viewed as a “call to action” or suggestion that you enter into a swap or trading strategy involving a swap or any other transaction. Scotiabank may engage in transactions in a manner inconsistent with the views discussed this report and may have positions, or be in the process of acquiring or disposing of positions, referred to in this report.
Scotiabank, its affiliates and any of their respective officers, directors and employees may from time to time take positions in currencies, act as managers, co-managers or underwriters of a public offering or act as principals or agents, deal in, own or act as market makers or advisors, brokers or commercial and/or investment bankers in relation to securities or related derivatives. As a result of these actions, Scotiabank may receive remuneration. All Scotiabank products and services are subject to the terms of applicable agreements and local regulations. Officers, directors and employees of Scotiabank and its affiliates may serve as directors of corporations.
Any securities discussed in this report may not be suitable for all investors. Scotiabank recommends that investors independently evaluate any issuer and security discussed in this report, and consult with any advisors they deem necessary prior to making any investment.
This report and all information, opinions and conclusions contained in it are protected by copyright. This information may not be reproduced without the prior express written consent of Scotiabank.
™ Trademark of The Bank of Nova Scotia. Used under license, where applicable.
Scotiabank, together with “Global Banking and Markets”, is a marketing name for the global corporate and investment banking and capital markets businesses of The Bank of Nova Scotia and certain of its affiliates in the countries where they operate, including; Scotiabank Europe plc; Scotiabank (Ireland) Designated Activity Company; Scotiabank Inverlat S.A., Institución de Banca Múltiple, Grupo Financiero Scotiabank Inverlat, Scotia Inverlat Casa de Bolsa, S.A. de C.V., Grupo Financiero Scotiabank Inverlat, Scotia Inverlat Derivados S.A. de C.V. – all members of the Scotiabank group and authorized users of the Scotiabank mark. The Bank of Nova Scotia is incorporated in Canada with limited liability and is authorised and regulated by the Office of the Superintendent of Financial Institutions Canada. The Bank of Nova Scotia is authorized by the UK Prudential Regulation Authority and is subject to regulation by the UK Financial Conduct Authority and limited regulation by the UK Prudential Regulation Authority. Details about the extent of The Bank of Nova Scotia's regulation by the UK Prudential Regulation Authority are available from us on request. Scotiabank Europe plc is authorized by the UK Prudential Regulation Authority and regulated by the UK Financial Conduct Authority and the UK Prudential Regulation Authority.
Scotiabank Inverlat, S.A., Scotia Inverlat Casa de Bolsa, S.A. de C.V, Grupo Financiero Scotiabank Inverlat, and Scotia Inverlat Derivados, S.A. de C.V., are each authorized and regulated by the Mexican financial authorities.
Not all products and services are offered in all jurisdictions. Services described are available in jurisdictions where permitted by law.