ON DECK FOR THURSDAY, JULY 17

KEY POINTS:
- The dollar is unwinding a stupidity discount
- Fed’s Williams reinforces patient stance, more Fed-speak today
- UK yields rise, sterling outperforms on somewhat mixed job market readings
- Aussie bonds outperform, A$ weakens on another soft jobs report
- US retail sales may modestly rebound
- US import prices, claims, Philly, homebuilder confidence also due out
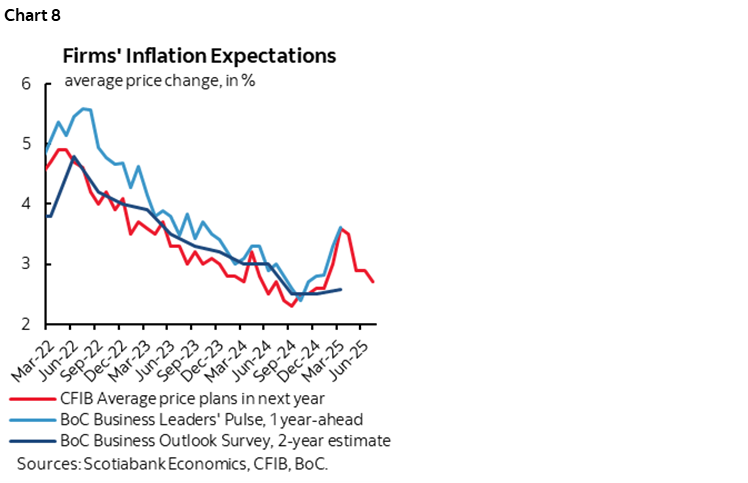
- Canadian small businesses signalling less pressure on future prices
The dollar is rebounding from yesterday’s performative stunts by the Trump administration that dangerously toyed with headline risk concerning the possibility of firing Fed Chair Powell that Trump then denied. It’s up against all major crosses this morning, while sovereign bond yields are little changed outside of the UK (jobs, see below) and Australia (jobs, see below). US and Canadian equity futures are flat, while Europe is rallying. Other than unwinding stupidity, there is no unifying theme across global markets as opposed to regional developments.
On that note, it’s back to the fundamentals time. Barring more attention-seeking—or attention-diverting—nonsense, the focus is upon several global macro indicators and Fed-speak.
NY FED’S WILLIAMS REINFORCES PATIENT STANCE
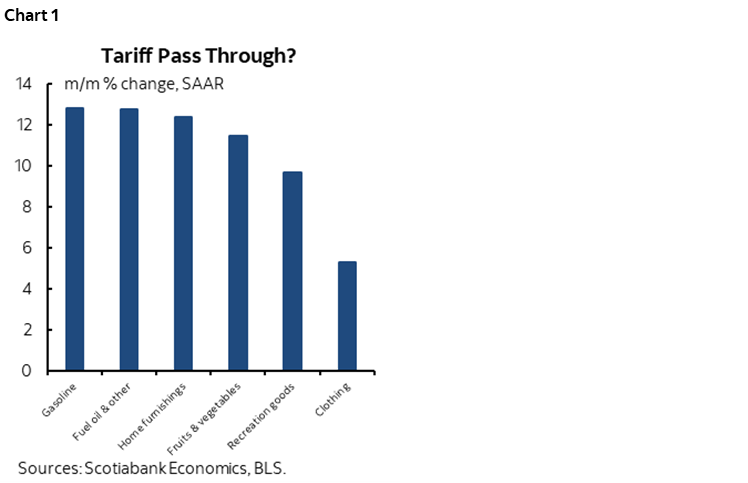
NY Fed President Williams said last evening that he expects tariff inflation to increase over coming months with a weaker dollar adding to inflation risk. He remarked that a restrictive, patient stance remained appropriate and didn’t indicate any desire to cut any time soon. He flagged early indications that tariffs are passing through, and he’s right. Recall chart 1 showing categories in CPI that jumped sharply higher in June in ways that could only be significantly explained by tariffs. The categories shown in the chart have a combined weight of about 12% in US CPI but there were offsets in other components like service prices and the lowest core CPI seasonal adjustment factor on record for like months of June that restrained the impact of tariffs on core CPI.
UK YIELDS RISE ON JOB MARKET READINGS
Gilts generally didn’t welcome somewhat mixed UK job market readings while sterling is mildly outperforming most other major crosses not named the greenback.
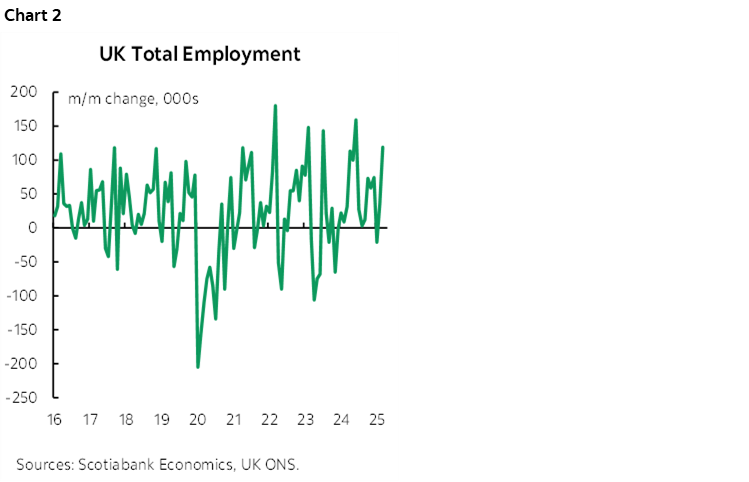
- total employment increased in May by 119k for the strongest gain since last August (chart 2). That occurred in the same month when payrolls were revised to a decline of just over 25k. The implication is that off-payroll firms—mainly small businesses—must be doing the hiring, assuming the data is credible.
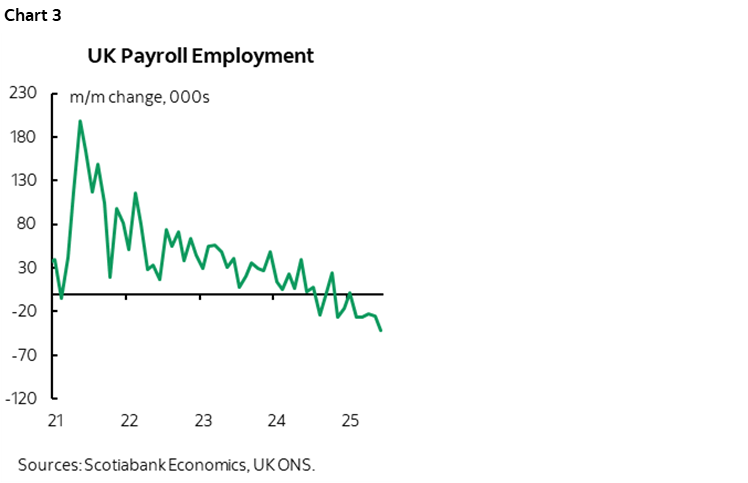
- UK payrolls fell by just over 41k in June and declined for the fifth straight month and seventh time in the past eight months (chart 3). They are down by 186k since last year’s peak. There were revisions to multiple months including the prior month that is now only a decline of 25k instead of 109k. So much for hard payrolls data.
- UK job vacancies fell again to 727k which remains a little above the long-run average but far below the pandemic peak of about 1¼ million (chart 4).

- wage growth remained strong at 4.8% m/m SAAR in May (chart 5). The three-month moving average now sits at 4.1%.

AUSSIE YIELDS AND A$ DROP AS AUSTRALIA’S JOB MARKET IS LOSING MOMENTUM
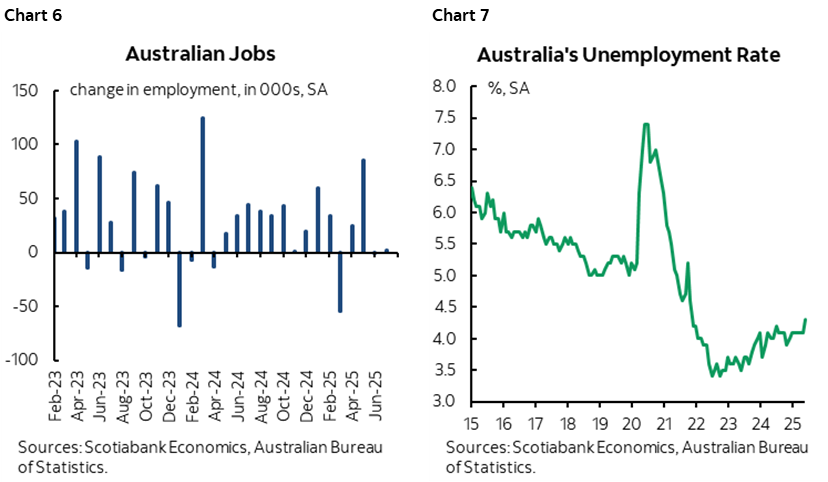
Australia’s job market sputtered again last month and that drove strong out-performance across the Aussie rates curve in bull steepener fashion and strong underperformance by the A$. Jobs were basically flat (+2k) after another flat month in May (-1.1k). Chart 6. In June, full-time jobs fell 38k and hence reversed May’s surge, while part-time jobs increased by 40k and reversed the prior month’s drop. The unemployment rate edged up two-tenths to 4.3% and is well off the bottom (chart 7) as job growth failed to live up to labour force expansion marked by the participation rate that ticked higher to 67.1%.
JAPAN SHIPPED MORE TO THE US, BOUGHT LESS
Japan’s exports slipped -0.5% m/m in June with imports little changed (+0.2%). Exports to the US increased by 12.7% m/m while imports from the US declined by 2.3% m/m. Still, exports to the US have been trending lower for months.
US RETAIL SALES ON TAP
Several US readings are due out with most of the focus upon retail sales in June (8:30amET). Headline sales are coming off a weak base effect when they fell -0.9% m/m in May and so a modest pick-up could occur in June’s figures. Vehicle sales were down by over 2% m/m and may weigh on the headline reading while gasoline prices were a minor influence. Key will be core sales ex-autos and gas that are expected to modestly rebound from the prior month’s drop. More important, however, will be the control group measure that feeds more directly into total consumption in GDP accounts and excludes vehicles, gas, food and building materials.
Also keep an eye on June’s readings for import and export prices (8:30amET). They exclude direct effects of tariffs but could reflect indirect effects. US weekly jobless claims (8:30amET), the Philly Fed’s volatile gauge (8:30amET), and homebuilder confidence including model home foot traffic (10amET) are also due out.
And there will be more Fed-speak on tap today as well including a range of voices such as Governor Waller this evening who is among the most dovish on the FOMC and viewed as a lower probability candidate for Fed Chair.
CANADIAN SMALL BUSINESSES INDICATING LESS INFLATION RISK?
The Bank of Canada releases its quarterly pre-MPR surveys of businesses and consumers next week. One of the key sets of measures concern expected price pressures. An advance indicator of the BoC’s surveys is provided by a gauge of price expectations at small businesses that was updated this morning. As chart 8 shows, their waning price plans serve as a leading indicator of what is likely to be lowered price expectations in the BoC’s broader surveys that are more focused upon larger businesses. Of course, a risk is that these are merely sentiment-driven gauges that could be stale now since Trump has been escalating tariff risks all over again.
DISCLAIMER
This report has been prepared by Scotiabank Economics as a resource for the clients of Scotiabank. Opinions, estimates and projections contained herein are our own as of the date hereof and are subject to change without notice. The information and opinions contained herein have been compiled or arrived at from sources believed reliable but no representation or warranty, express or implied, is made as to their accuracy or completeness. Neither Scotiabank nor any of its officers, directors, partners, employees or affiliates accepts any liability whatsoever for any direct or consequential loss arising from any use of this report or its contents.
These reports are provided to you for informational purposes only. This report is not, and is not constructed as, an offer to sell or solicitation of any offer to buy any financial instrument, nor shall this report be construed as an opinion as to whether you should enter into any swap or trading strategy involving a swap or any other transaction. The information contained in this report is not intended to be, and does not constitute, a recommendation of a swap or trading strategy involving a swap within the meaning of U.S. Commodity Futures Trading Commission Regulation 23.434 and Appendix A thereto. This material is not intended to be individually tailored to your needs or characteristics and should not be viewed as a “call to action” or suggestion that you enter into a swap or trading strategy involving a swap or any other transaction. Scotiabank may engage in transactions in a manner inconsistent with the views discussed this report and may have positions, or be in the process of acquiring or disposing of positions, referred to in this report.
Scotiabank, its affiliates and any of their respective officers, directors and employees may from time to time take positions in currencies, act as managers, co-managers or underwriters of a public offering or act as principals or agents, deal in, own or act as market makers or advisors, brokers or commercial and/or investment bankers in relation to securities or related derivatives. As a result of these actions, Scotiabank may receive remuneration. All Scotiabank products and services are subject to the terms of applicable agreements and local regulations. Officers, directors and employees of Scotiabank and its affiliates may serve as directors of corporations.
Any securities discussed in this report may not be suitable for all investors. Scotiabank recommends that investors independently evaluate any issuer and security discussed in this report, and consult with any advisors they deem necessary prior to making any investment.
This report and all information, opinions and conclusions contained in it are protected by copyright. This information may not be reproduced without the prior express written consent of Scotiabank.
™ Trademark of The Bank of Nova Scotia. Used under license, where applicable.
Scotiabank, together with “Global Banking and Markets”, is a marketing name for the global corporate and investment banking and capital markets businesses of The Bank of Nova Scotia and certain of its affiliates in the countries where they operate, including; Scotiabank Europe plc; Scotiabank (Ireland) Designated Activity Company; Scotiabank Inverlat S.A., Institución de Banca Múltiple, Grupo Financiero Scotiabank Inverlat, Scotia Inverlat Casa de Bolsa, S.A. de C.V., Grupo Financiero Scotiabank Inverlat, Scotia Inverlat Derivados S.A. de C.V. – all members of the Scotiabank group and authorized users of the Scotiabank mark. The Bank of Nova Scotia is incorporated in Canada with limited liability and is authorised and regulated by the Office of the Superintendent of Financial Institutions Canada. The Bank of Nova Scotia is authorized by the UK Prudential Regulation Authority and is subject to regulation by the UK Financial Conduct Authority and limited regulation by the UK Prudential Regulation Authority. Details about the extent of The Bank of Nova Scotia's regulation by the UK Prudential Regulation Authority are available from us on request. Scotiabank Europe plc is authorized by the UK Prudential Regulation Authority and regulated by the UK Financial Conduct Authority and the UK Prudential Regulation Authority.
Scotiabank Inverlat, S.A., Scotia Inverlat Casa de Bolsa, S.A. de C.V, Grupo Financiero Scotiabank Inverlat, and Scotia Inverlat Derivados, S.A. de C.V., are each authorized and regulated by the Mexican financial authorities.
Not all products and services are offered in all jurisdictions. Services described are available in jurisdictions where permitted by law.