ON DECK FOR TUESDAY, JULY 15
KEY POINTS:
- Markets face a deluge of new information today
- China’s economy put in a mixed performance
- US CPI won’t settle anything for the Fed
- Ditto for Canadian CPI and the BoC
- Several Fed officials to react to CPI
- US bank earnings are beating so far
- The Attack of the Killer Tomatoes
- US copper tariffs aren’t good for anyone including the US industry
- Trump is wrong on the US relative global standing on tariffs, NTBs, subsidies
Markets face a lot of information to digest into the N.A. session and so current market positioning means little. For what little it’s worth, there is a mildly constructive tone across risk assets with equities more in the green than red across global benchmarks, the dollar broadly softer against major crosses, and sovereign bond yields under mild downward pressure. Overnight developments took down mixed data on China’s economy. We’ll get US CPI, Canadian CPI, US bank earnings and Fed-speak today.
MIXED READINGS ON CHINA’S ECONOMY
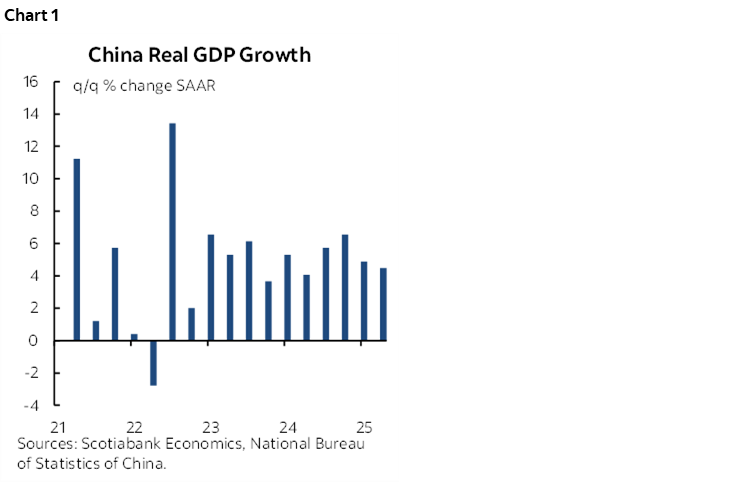
China’s economy put in somewhat of a mixed performance. Q2 GDP beat (1.1% q/q SA, 0.9% consensus) with consumer spending and net exports driving much of it (chart 1). Most economists expect growth to slow as export contributions wane once front-loading gives way to more of a bite from tariffs.
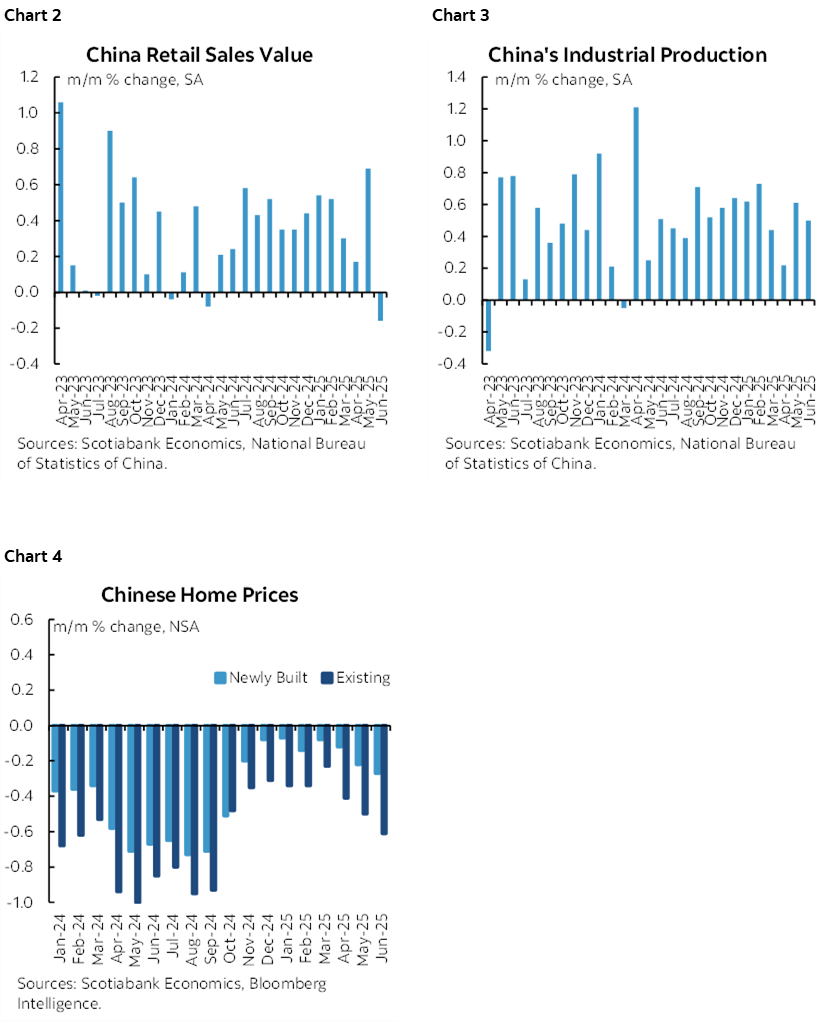
Other readings conflicted with one another (charts 2, 3, 4). Retail sales missed (4.8% y/y, 5.3% consensus) as sales fell -0.16% m/m SA. Industrial output beat (6.8% y/y, 5.6% consensus) and grew by 0.5% m/m SA, the jobless rate was on the screws at 5%, and fixed investment grew slower than expected. New and used home prices continue to fall.
FOUR MAIN DEVELOPMENTS INTO THE N.A. SESSION
A jam-packed session lies ahead that will primarily focus on the following four things:
1. US bank earnings reports are arriving in the pre-market. BlackRock smashed expectations with EPS of US$12.05 (consensus ($10.87) and bigger AUM than estimated but slightly missed on revenues. JP Morgan Chase beat expectations with adjusted EPS of US$4.96 (consensus $4.97) and stronger than expected revenues. BoNYM also beat on EPS and revenues. Citigroup (8amET), State Street (7:30amET) and Wells Fargo (7amET) are also due out.
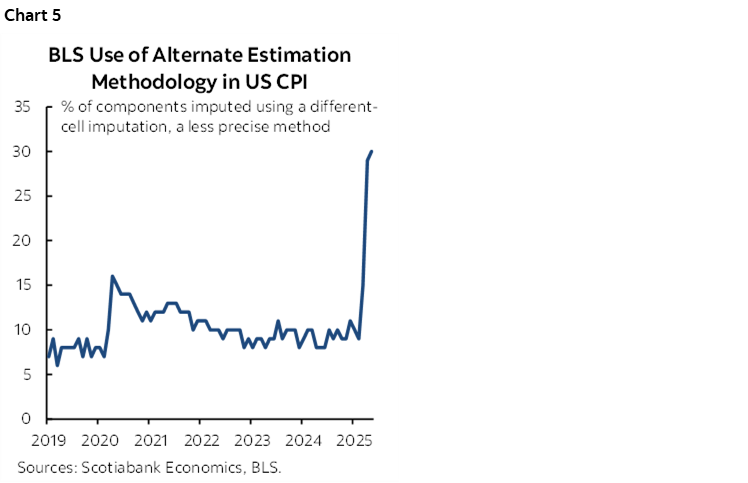
2. US CPI follows (8:30amET), though one report is unlikely to settle much of anything for the Fed. Scotia’s estimates are 0.2% m/m for headline and 0.3% for core. The BLS has warned that the estimated share of the CPI basket may rise again this time due to budget cuts (chart 5). Tariff effects will take months, quarters, if not years to fully show up and so whatever happens, nothing will be settled by this set of readings. See my Global Week Ahead here for a fuller preview.
3. Canadian CPI arrives at the same time as the US figures (8:30amET). Scotia’s estimate is 0.2% m/m NSA for headline and I wouldn’t be surprised to see a softer m/m SAAR set of core readings. After 83k jobs created in June plus no clarity on fiscal and trade policy, these CPI figures on their own will settle nothing for the BoC. Again, see my Global Week Ahead for a fuller preview (here).
4. Fed reactions to CPI may follow with several officials set to speak in varying capacities. Governor Bowman (9:15amET), Governor Barr (12:45pmET), Richmond President Barkin (1pmET), Boston President Collins (2:45pmET) and Dallas President Logan (7:45pmET) are scheduled to speak and there may be other impromptu remarks from others.
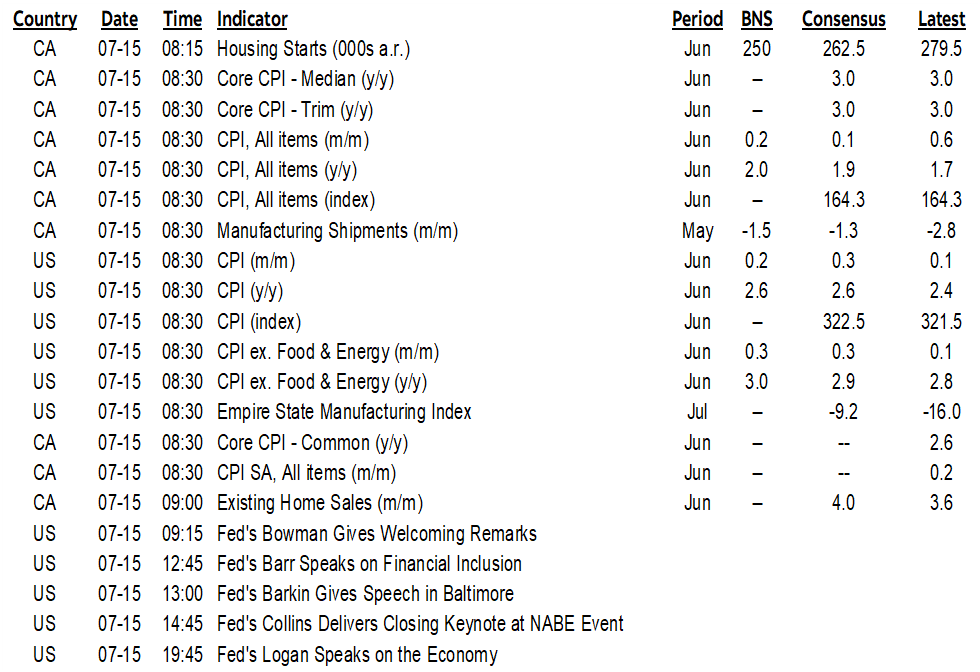
Other minor gauges will include the US Empire manufacturing report (8:30amET) that will get lost behind CPI, plus Canadian existing home sales for June (9amET) and manufacturing sales that probably fell based on advance Statcan guidance (8:30amET). Peru will release its unemployment rate for June (11amET) and May’s monthly economic activity GDP proxy (11amET). Colombia will refresh retail sales (11amET).
TWISTED LOGIC ON COPPER TARIFFS
Get this for twisted self-serving logic. The author says copper tariffs are necessary mainly because of the widening COMEX-LME spread that has appeared since February (chart 6) which has encouraged taking cheap copper abroad and selling it in the US at the higher domestic price.
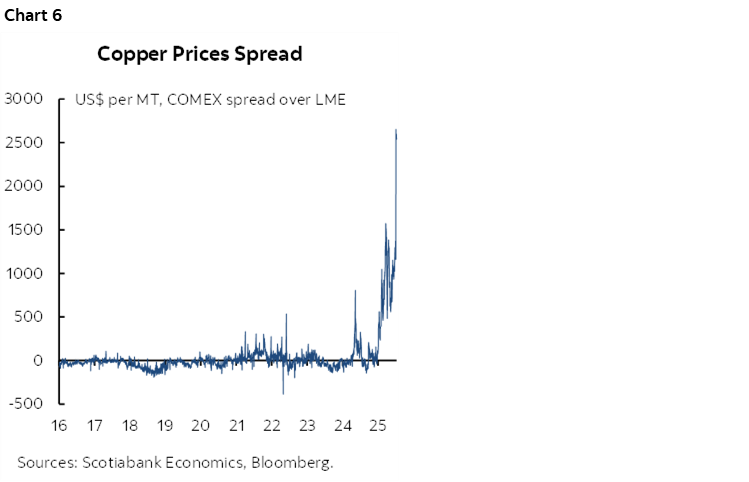
Lost on the author is that a major reason for the fact this spread has soared since then was the expected lead-up to the launch of a protectionist inquiry by Trump in February and the tariffs he has announced since then. The spread soared again this month following Trump's 50% copper tariff announcement.
And what's wrong with cheaper copper anyway, after many prior years in which Chinese demand drove it through the roof, adding to costs in various industries from construction to electronics.
The last thing America needs is a tariff wall behind which producers can jack up prices and become less efficient. I can't see that as good for the industry in the long run, or the broader economy.
THE INVASION OF THE KILLER TOMATOES & AMERICA’S STANDING ON PROTECTIONIST POLICIES
Remember the bad 1970s movie? They’re back. Tomatoes, from Mexico, are apparently a severe national security threat to the United States. Hence 17% tariffs announced by the Trump administration last evening.
On a somewhat more serious note, the US is messing with general price signals and relative price signals. Whether metals, or individual vegetables, or autos, or other sector-specific tariffs, Uncle Sam is massively distorting relative incentives to spend and invest.
And it’s all based on the false MAGA narrative that the rest of the world is ripping off the US behind protectionist walls. I’ve made these points many times and repeat charts 7–9. US tariff rates are lower than many developing economies, but not materially different from Canada’s, Mexico’s, most of Europe and Australia etc and this is lagging data that doesn’t incorporate US tariff measures this year which would probably vault the US to the top of the list with the world’s highest tariff rates. US non-tariff measures are also not materially different from most other developed economies and if anything are more prevalent in the US and becoming more prevalent in light of this year’s measures. US subsidies are rivalled only by Europe’s and include a very lengthy list of massive subsidy programs like the Farm Bill, auto subsidies by southern and Midwest states, chips subsidies, other subsidies to tech firms, subsidies to aerospace firms, subsidies and preferential procurement programs for defence cos, bail-outs aplenty including the biggest in the GFC, arguably distorting Fed QE policies, etc etc etc. Some Americans subscribe to a false narrative that says their economy is free and open and lacking protectionist distortions that are prevalent elsewhere.

DISCLAIMER
This report has been prepared by Scotiabank Economics as a resource for the clients of Scotiabank. Opinions, estimates and projections contained herein are our own as of the date hereof and are subject to change without notice. The information and opinions contained herein have been compiled or arrived at from sources believed reliable but no representation or warranty, express or implied, is made as to their accuracy or completeness. Neither Scotiabank nor any of its officers, directors, partners, employees or affiliates accepts any liability whatsoever for any direct or consequential loss arising from any use of this report or its contents.
These reports are provided to you for informational purposes only. This report is not, and is not constructed as, an offer to sell or solicitation of any offer to buy any financial instrument, nor shall this report be construed as an opinion as to whether you should enter into any swap or trading strategy involving a swap or any other transaction. The information contained in this report is not intended to be, and does not constitute, a recommendation of a swap or trading strategy involving a swap within the meaning of U.S. Commodity Futures Trading Commission Regulation 23.434 and Appendix A thereto. This material is not intended to be individually tailored to your needs or characteristics and should not be viewed as a “call to action” or suggestion that you enter into a swap or trading strategy involving a swap or any other transaction. Scotiabank may engage in transactions in a manner inconsistent with the views discussed this report and may have positions, or be in the process of acquiring or disposing of positions, referred to in this report.
Scotiabank, its affiliates and any of their respective officers, directors and employees may from time to time take positions in currencies, act as managers, co-managers or underwriters of a public offering or act as principals or agents, deal in, own or act as market makers or advisors, brokers or commercial and/or investment bankers in relation to securities or related derivatives. As a result of these actions, Scotiabank may receive remuneration. All Scotiabank products and services are subject to the terms of applicable agreements and local regulations. Officers, directors and employees of Scotiabank and its affiliates may serve as directors of corporations.
Any securities discussed in this report may not be suitable for all investors. Scotiabank recommends that investors independently evaluate any issuer and security discussed in this report, and consult with any advisors they deem necessary prior to making any investment.
This report and all information, opinions and conclusions contained in it are protected by copyright. This information may not be reproduced without the prior express written consent of Scotiabank.
™ Trademark of The Bank of Nova Scotia. Used under license, where applicable.
Scotiabank, together with “Global Banking and Markets”, is a marketing name for the global corporate and investment banking and capital markets businesses of The Bank of Nova Scotia and certain of its affiliates in the countries where they operate, including; Scotiabank Europe plc; Scotiabank (Ireland) Designated Activity Company; Scotiabank Inverlat S.A., Institución de Banca Múltiple, Grupo Financiero Scotiabank Inverlat, Scotia Inverlat Casa de Bolsa, S.A. de C.V., Grupo Financiero Scotiabank Inverlat, Scotia Inverlat Derivados S.A. de C.V. – all members of the Scotiabank group and authorized users of the Scotiabank mark. The Bank of Nova Scotia is incorporated in Canada with limited liability and is authorised and regulated by the Office of the Superintendent of Financial Institutions Canada. The Bank of Nova Scotia is authorized by the UK Prudential Regulation Authority and is subject to regulation by the UK Financial Conduct Authority and limited regulation by the UK Prudential Regulation Authority. Details about the extent of The Bank of Nova Scotia's regulation by the UK Prudential Regulation Authority are available from us on request. Scotiabank Europe plc is authorized by the UK Prudential Regulation Authority and regulated by the UK Financial Conduct Authority and the UK Prudential Regulation Authority.
Scotiabank Inverlat, S.A., Scotia Inverlat Casa de Bolsa, S.A. de C.V, Grupo Financiero Scotiabank Inverlat, and Scotia Inverlat Derivados, S.A. de C.V., are each authorized and regulated by the Mexican financial authorities.
Not all products and services are offered in all jurisdictions. Services described are available in jurisdictions where permitted by law.