ON DECK FOR FRIDAY, JANUARY 10
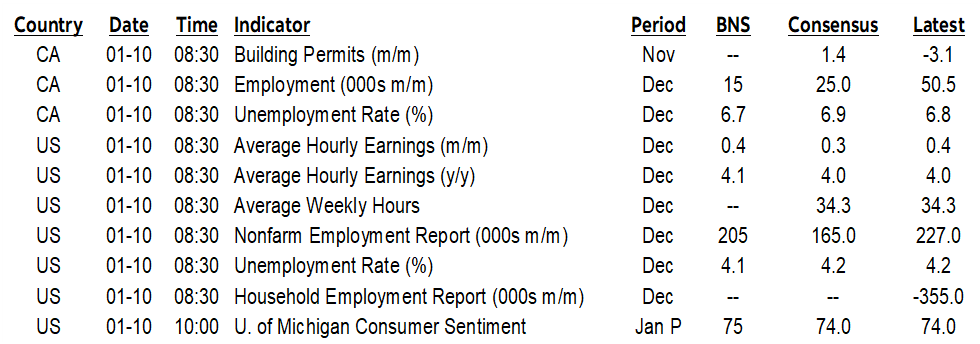
KEY POINTS:
- Markets await US, Canadian jobs
- Canada signals everything is on the table for retaliation against US
- N.A. jobs reports will take a back seat to bigger pending developments
- Nonfarm payrolls preview
- Canadian jobs preview
- BCRP cut 25bps
- UofM sentiment to be updated after nonfarm
Nonfarm and Canadian jobs will be the main focal points to end the week with otherwise only modest additional stuff to consider. UofM sentiment lands after payrolls. BCRP cut 25bps last evening. And Canada is escalating its trade rhetoric.
CANADA SIGNALS BROAD RETALIATORY MEASURES BEING CONSIDERED
Anonymous ‘people familiar with the matter’ told Bloomberg that Canada is preparing a broader array of retaliatory options than the one that anonymous officials signalled to other media outlets like the CBC and Globe and Mail the other day. On the list of additional options are:
- Dollar for dollar matching of tariffs on ‘nearly every product the US exports to Canada.’
- Export taxes on strategic commodities such as oil, uranium and potash.
Naturally, the officials emphasized that everything is in flux and depends on what the US does and the first option is obviously to avert all of this nonsense if the US backs down. Also note that these are federal measures; possible provincial measures are an additional uncertainty.
I think keeping all options open for serious matters is the way to go, but treat the headlines with caution. Plants to various outlets by ‘anonymous officials’ can be useful ways of signalling intent without dragging senior representatives of government out into the open, but their verifiability is always unclear and so is the degree to which they speak for top officials.
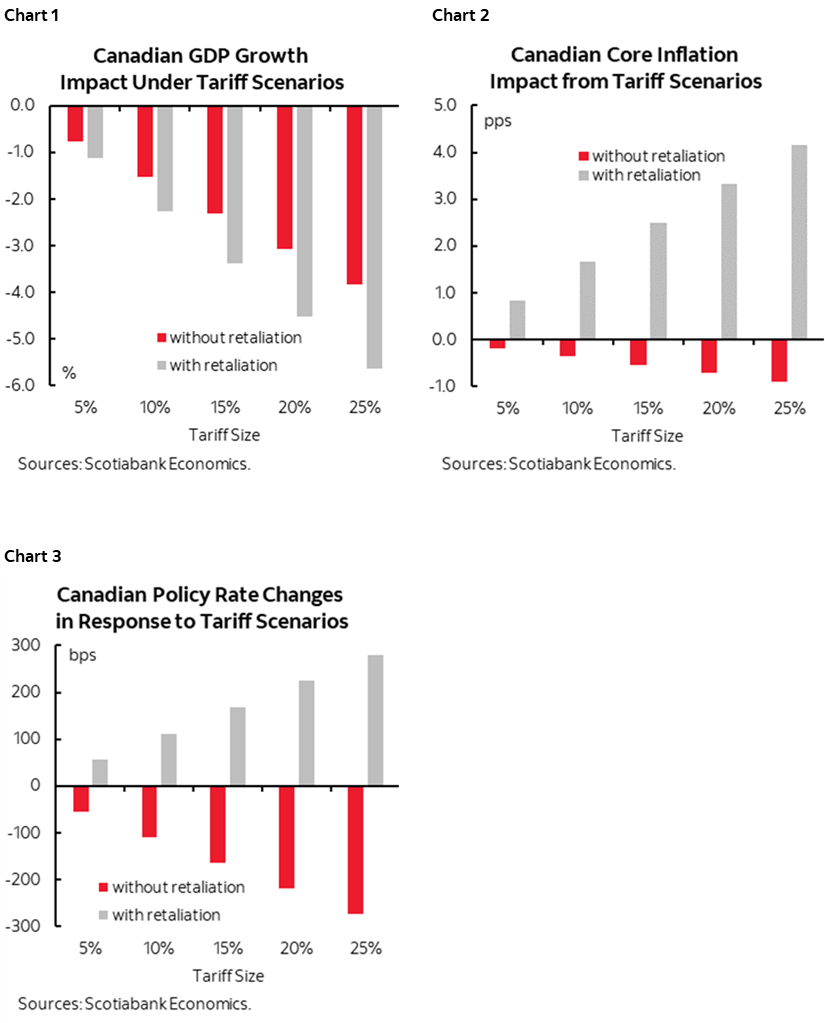
As a reminder, chart 1 shows the GDP hit to Canada by 2026Q4of US tariffs with and without retaliation. Chart 2 shows the same for inflation over the same time period and the BoC outlook depends critically upon retaliation (chart 3). Because of this last point, I continue to find it difficult to have conviction toward the attractiveness of Canada’s yield curve. 2s and 5s are priced around rough estimates of a long-run neutral policy rate at the moment, but US tariffs and what Canada does could materially swing yields in either direction.
NONFARM PAYROLLS PREVIEW
A slew of US job market readings arrives at 8:30amET this morning covering conditions during December.
In summation, I’ve gone above consensus for job growth, below for the UR, above for wages and I think hours worked may dip. Numbers are laid out below along with the rationale.
Does it matter? Yes for intraday market noise. But bigger and potentially more highly disruptive factors than payrolls loom ahead before the January FOMC as the Committee doesn't sound like it's in any rush at all.
For the labour market, key to the Fed is how the breakeven rate of monthly job growth evolves relative to the monthly pace of job growth. The b/e rate is already moving lower now as Biden’s immigration changes take hold. It may move much lower yet as Trump enters. Our forecasts assume around 1 million population reduction per year during Trump’s term which may be conservative but it's enough to remove the influences of population growth over recent years. Estimates of how many undoc migrants exist are all over the place, but there’s no way Trump can boot 15–20 million any time soon (his number, like others, changes from time to time). Pew Research Center recently figured there are around 11 million in the US as at 2022 and attempts to update since then with spottier figures add more but are well shy of 15–20 million. You’d have to boot documented workers too in order to hit his numbers. The US doesn’t have the prison or warehousing and processing capability to move that fast.
- Consensus median: 165
- Consensus mean: 165 (no skewness)
- Scotia: 205 (I’m 5th out of 70 on b’berg)
- Range: 100–268, most within about 150–200
- Whisper #: 185
- Std dev: 26.6
- 90% confidence band: +/-130k
- UR: 4.2% / Scotia 4.1%)
- Wages: 0.3% / Scotia 0.4 (I’m 5th out of 55 on b’berg)
Rationale:
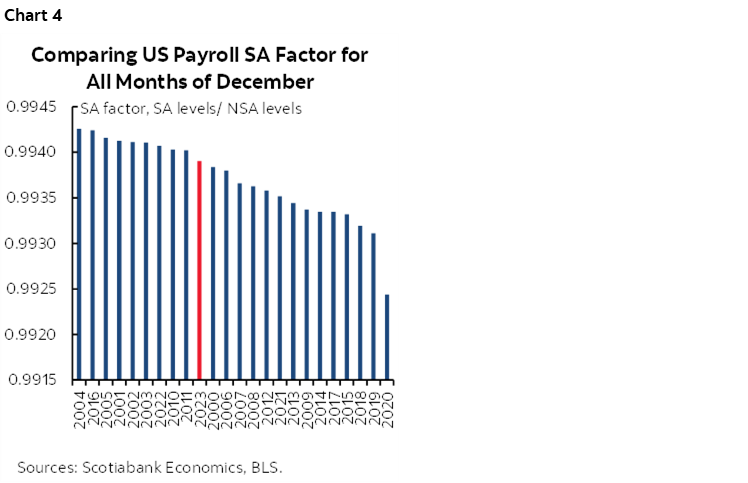
- There isn’t likely to be much of a recency bias in SA factors this time (chart 4). The pattern of overstating job growth at the start of the year, understating in summer, then overstating gives way to a relatively neutral influence in December.
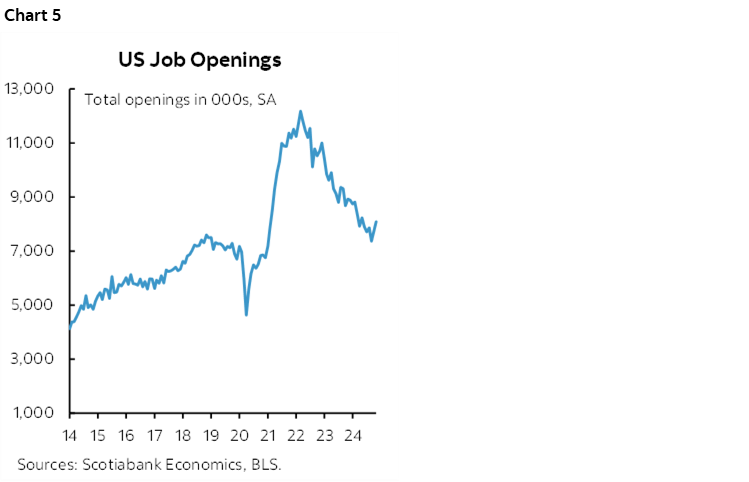
- JOLTS job vacancies increased to about 8.1 million in November from an upwardly revised 7.84. They’ve been increasing for two months and remain above the long-run average (chart 5). Then there is the usual debate about whether this signals more hiring or multiple postings and dead postings etc.
- NFIB small business hiring plans have been moving up since the low in March and are at their highest since November 2023 (chart 6). This suggests that JOLTS at least partially reflects more hiring appetite.

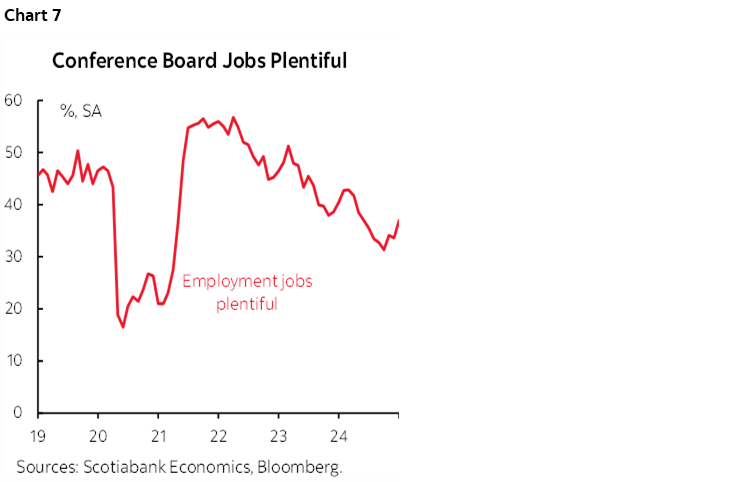
- Consumers are validating this. The consumer confidence reading for jobs plentiful has been rising since September and is at the highest since May (chart 7). So, here too we have validation of small business hiring plans and JOLTS.
- Mass layoffs were seasonally normal at about 39k in December (chart 8). Neutral influence.

- initial jobless claims were stable between nonfarm reference periods
- ADP was 122k, signalling modest downside risk to the private payrolls component
- ISM employment readings were stable for the key services sector, but fell for the small manufacturing sector’s role
- State & local governments have been on a hiring spree driving government to add about 30–40k jobs per month. Nothing from federal. May be reasonable to extend this.
- On the UR that comes from the more volatile household survey, I’m at outlier expecting a downtick to 4.1%. I’m expecting a bigger rebound in household employment after two months of 350–360k declines in each of October and November than a rebound in the labour force that has been falling by about 200k or so in each of those months. NFIB hiring plans suggest we’re overdue for a rebound in household employment that is more skewed toward smaller businesses.
- Biden’s tightened immigration policies likely explain the last two months of weaker LF numbers and I don’t see reason to expect anything other than another decline while hiring intentions trend higher.
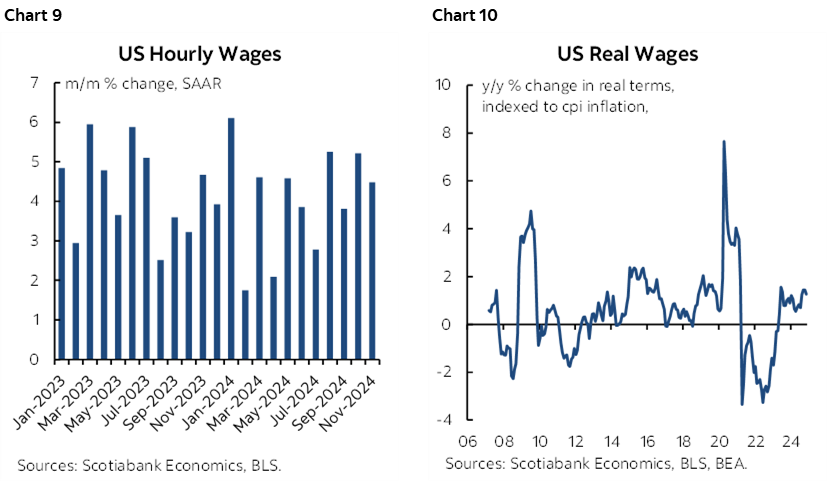
- on wages, I went with 0.4% m/m and an uptick to 4.1% y/y. Trend nominal wage growth has been solid (chart 9) and real wage gains have accelerated (chart 10).
- Hours worked might dip. November posted the strongest gain since March as October strikes got settled and hours rebounded. That’s unlikely to be a durable effect.
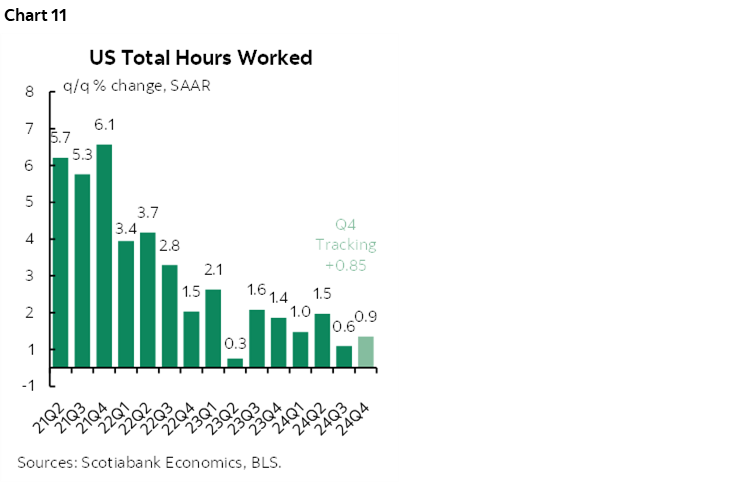
- Unless hours really pick up, then we’re tracking 0.85% q/q SAAR growth in total hours (chart 11). Since GDP is hours times labour productivity, the US needs a large jump in productivity during Q4 to his the Atlanta Fed’s 2.7% Q4 GDP nowcast.
CANADIAN JOBS PREVIEW
Ok, round two for the lucky rabbit’s foot, this time it’s a preview of Canada’s Labour Force Survey figures due out at the same time as nonfarm tomorrow.
I’ve gone below consensus this time and with an expected decline in the UR, a possible pick-up in hours worked, and a strong wage gain. Numbers first, rationale below.
But does it matter? The BoC’s next decision is on the same day as the next FOMC (January 29th). They’re working on forecasts and analysis now with a mindful eye toward inauguration day and what may rapidly unfold thereafter. Obviously tariffs are the big question, and how Canada responds, and so in that context tomorrow’s LFS takes a back seat. Tariffs minus meaningful retaliation and the BoC cuts. Tariffs and meaningful retaliation and the BoC picture is much murkier since it’s no longer clearly disinflationary and perhaps shifts toward adding to upside risk to inflation. Also consider we have DepGov Gravelle’s balance sheet speech to consider next week before they slip into pre-meeting blackout.
- Consensus median: 25
- Consensus mean: 24.5 (no skewness)
- Scotia: 15 (I’m 1st out of 12 on b’berg)
- Range: 10–40, scattered with 20–25 the most popular
- Whisper #: n/a in Canada
- Std dev: 8.3
- 95% confidence band: +/-57k
- UR: 6.9% from 6.8% prior / Scotia 6.7%
- Wages: no estimates, but sharp increase expected
Rationale:
- First, I think the role played by distorted SA factors in November should be neutralized in December. SA factors understated the 50.5k job gain in November by going with the second lowest SA factor on record for like months of November. November SA factors have been on the low side for each of 2021, 2022 and 2024 but not 2023 (my suspicion being because they didn’t need to tamp down a modest gain that November). I wrote at the time that I didn’t have confidence in the numbers but mostly because I thought the SA factors understated job growth.
- But there isn’t the same evidence from recent years for December SA factors that have been all over the map comparing like months over time (chart 12). Ergo, SA factors shouldn’t be an issue this time.

- SA factors might be distorting for the f-t versus p-t mixture though. Statcan applied the lowest f-t jobs SA factor on record for like months of November to tamp down what was a strong 54k gain in f-t jobs and the third highest part-time jobs SA factor to tamp down a modest 4k drop in p-t jobs. They netted out.
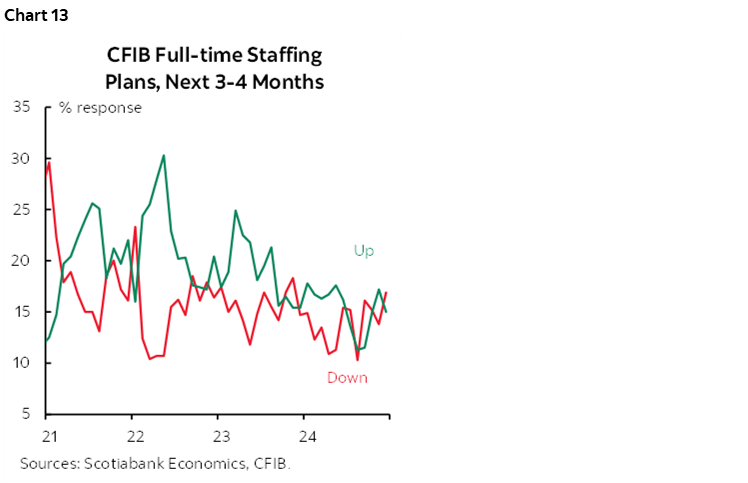
- We don’t have many advance indicators in Canada. One thing to point to is that CFIB small business hiring plans have moderated away from a strong upward bias until mid-2024 to those planning to hire and those playing to reduce workforces roughly netting out now (chart 13). That might support a relatively soft number tomorrow.
- The reason I expect the unemployment rate to tick down—and I’m an outlier on that—is that I think there will be more labour force weakness than employment weakness. The month of November registered a whopping 138k gain in the labour pool for the biggest gain since September 2021. That’s very unlikely to repeat and pretty unlikely to drop and maybe by quite a bit.
- That LF (and population) surge was fed by nonpermanent residents (temps) comprised of international students, temporary foreign workers and asylum seekers (mostly the first two). Temps have driven most of the rise in the UR rate since Jan 2022.
- at some point, the efforts that have been rolled out to tighten the flow of temps should drive weaker LF growth. I’m confident that will happen on a trend basis and population growth should grind to a halt over 2025–26 if not contract, but timing that on a monthly basis is difficult and with survey noise complicating things further.
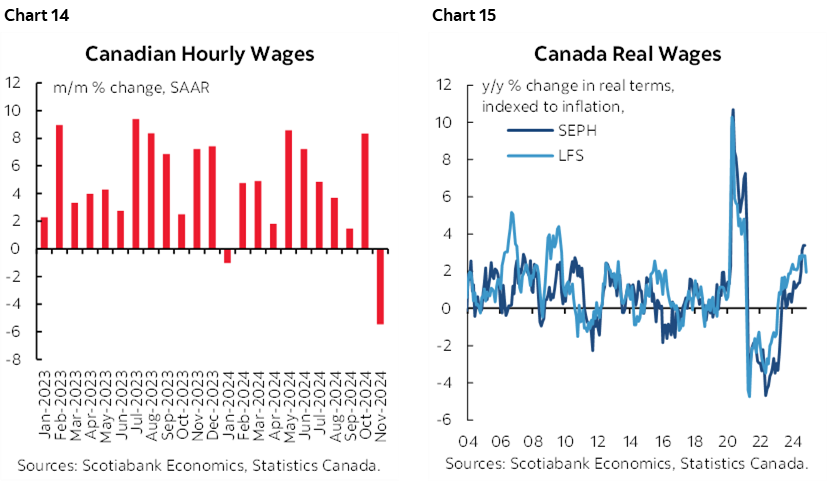
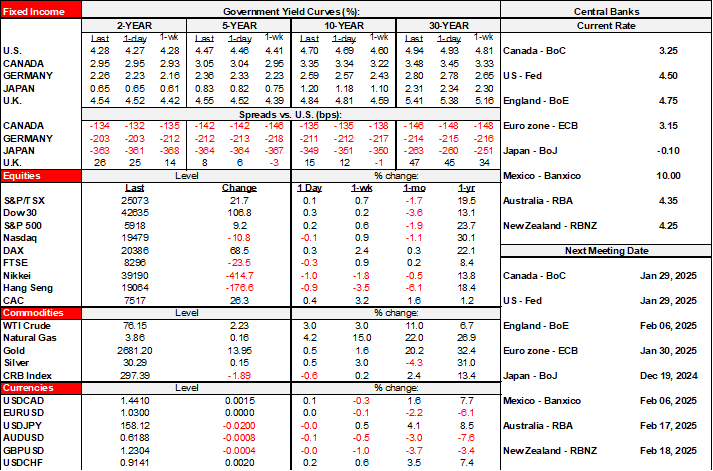
- wage growth is expected to jump higher, barring revisions. Average hourly earnings of permanent employees plunged by 5.5% m/m SAAR in November for the biggest plunge since June 2020 (chart 14). Blame a see-saw effect. The prior month was up 8.3% m/m SAAR. We’ll probably see a strong gain in the volatile series. The y/y gain in real wages, however, continues to rise (chart 15).
- I don’t have conviction on hours worked but they may slip. The strike by 55,000 posties ended with a back to work order on December 17th and they returned to work days later. That’s after the LFS reference week that this time is for the Dec 8th–14th week.
DISCLAIMER
This report has been prepared by Scotiabank Economics as a resource for the clients of Scotiabank. Opinions, estimates and projections contained herein are our own as of the date hereof and are subject to change without notice. The information and opinions contained herein have been compiled or arrived at from sources believed reliable but no representation or warranty, express or implied, is made as to their accuracy or completeness. Neither Scotiabank nor any of its officers, directors, partners, employees or affiliates accepts any liability whatsoever for any direct or consequential loss arising from any use of this report or its contents.
These reports are provided to you for informational purposes only. This report is not, and is not constructed as, an offer to sell or solicitation of any offer to buy any financial instrument, nor shall this report be construed as an opinion as to whether you should enter into any swap or trading strategy involving a swap or any other transaction. The information contained in this report is not intended to be, and does not constitute, a recommendation of a swap or trading strategy involving a swap within the meaning of U.S. Commodity Futures Trading Commission Regulation 23.434 and Appendix A thereto. This material is not intended to be individually tailored to your needs or characteristics and should not be viewed as a “call to action” or suggestion that you enter into a swap or trading strategy involving a swap or any other transaction. Scotiabank may engage in transactions in a manner inconsistent with the views discussed this report and may have positions, or be in the process of acquiring or disposing of positions, referred to in this report.
Scotiabank, its affiliates and any of their respective officers, directors and employees may from time to time take positions in currencies, act as managers, co-managers or underwriters of a public offering or act as principals or agents, deal in, own or act as market makers or advisors, brokers or commercial and/or investment bankers in relation to securities or related derivatives. As a result of these actions, Scotiabank may receive remuneration. All Scotiabank products and services are subject to the terms of applicable agreements and local regulations. Officers, directors and employees of Scotiabank and its affiliates may serve as directors of corporations.
Any securities discussed in this report may not be suitable for all investors. Scotiabank recommends that investors independently evaluate any issuer and security discussed in this report, and consult with any advisors they deem necessary prior to making any investment.
This report and all information, opinions and conclusions contained in it are protected by copyright. This information may not be reproduced without the prior express written consent of Scotiabank.
™ Trademark of The Bank of Nova Scotia. Used under license, where applicable.
Scotiabank, together with “Global Banking and Markets”, is a marketing name for the global corporate and investment banking and capital markets businesses of The Bank of Nova Scotia and certain of its affiliates in the countries where they operate, including; Scotiabank Europe plc; Scotiabank (Ireland) Designated Activity Company; Scotiabank Inverlat S.A., Institución de Banca Múltiple, Grupo Financiero Scotiabank Inverlat, Scotia Inverlat Casa de Bolsa, S.A. de C.V., Grupo Financiero Scotiabank Inverlat, Scotia Inverlat Derivados S.A. de C.V. – all members of the Scotiabank group and authorized users of the Scotiabank mark. The Bank of Nova Scotia is incorporated in Canada with limited liability and is authorised and regulated by the Office of the Superintendent of Financial Institutions Canada. The Bank of Nova Scotia is authorized by the UK Prudential Regulation Authority and is subject to regulation by the UK Financial Conduct Authority and limited regulation by the UK Prudential Regulation Authority. Details about the extent of The Bank of Nova Scotia's regulation by the UK Prudential Regulation Authority are available from us on request. Scotiabank Europe plc is authorized by the UK Prudential Regulation Authority and regulated by the UK Financial Conduct Authority and the UK Prudential Regulation Authority.
Scotiabank Inverlat, S.A., Scotia Inverlat Casa de Bolsa, S.A. de C.V, Grupo Financiero Scotiabank Inverlat, and Scotia Inverlat Derivados, S.A. de C.V., are each authorized and regulated by the Mexican financial authorities.
Not all products and services are offered in all jurisdictions. Services described are available in jurisdictions where permitted by law.