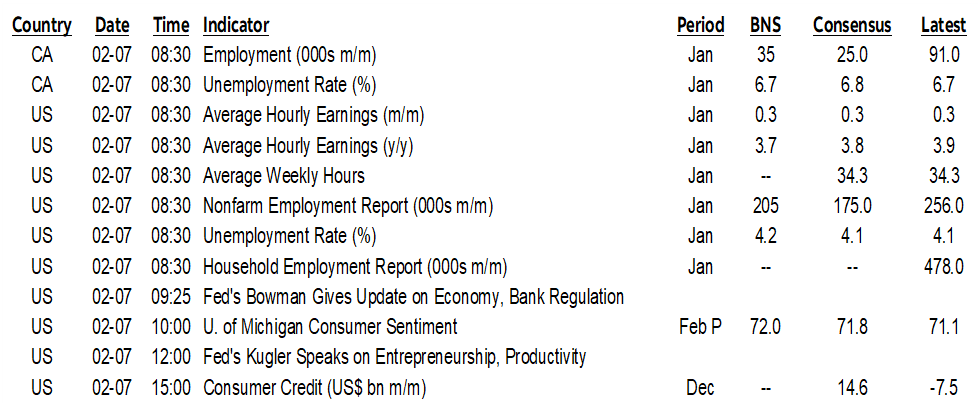
ON DECK FOR FRIDAY, FEBRUARY 7
KEY POINTS:
- Markets await US payrolls, Canadian jobs
- Canadian jobs preview
- US jobs preview
- Summit Day in Canada—hoping for more than just cheap talk
- BoC Governor Macklem’s speech suggests pricing and many forecasts are too dovish
The key focal points this morning are the dual releases of US and Canadian jobs reports. Other overnight developments were light including an expected 25bps cut by the RBI, and mixed German data as industrial production fell sharply but exports surged in December. After payrolls will be updated UMIch consumer sentiment (10amET). So far, global markets are behaving with typical pre-nonfarm apprehension.
CANADIAN JOBS PREVIEW
Canada updates the LFS this morning for January. It’s one of two jobs reports and a CPI report before the next BoC decision on March 12th. Here’s an outline of expectations and the rationale. Always remember the high noise factor; the 95% confidence interval around monthly estimated changes in employment is +/-57k. Canada’s main jobs report is a noisy household survey.
Consensus median change 000s: 25
Consensus mean: 32.3 (slight upside skewness)
Scotia: 35 (I’m ranked #2)
Range: 15 – 76, most are in the 15–35k range. No negatives
Std dev: 17.5k
95% CI: +/-57k
UR: 6.8% from 6.7% / Scotia 6.7%
Rationale:
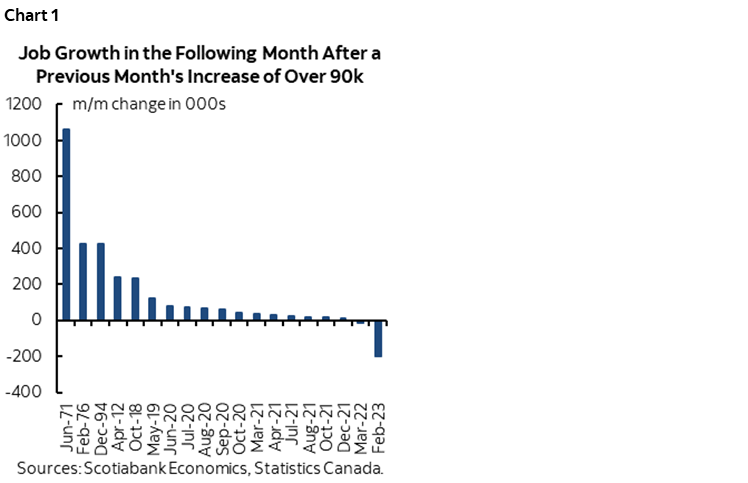
- After +91k in December, the historical odds strongly favour another up month (chart 1). There has only been one single month out of nineteen in history when there has been a gain of that magnitude or higher and the next month fell materially.
- Why? Two possible reasons. One is hiring momentum, that if businesses had confidence to hire that many one month then presumably they won’t turn around and fire them all and more the next.
- The second reason may be sample stickiness. Statcan uses a sample rotation approach to sampling jobs in ‘primary sampling units’ by sampling the same local areas for six months at a time and rotating in new ones one month at a time while dropping the first month’s sample out. That means most of the sample is repeatedly drawn from pretty much the same areas, with the same regional concentrations of employers and industries. The sample turns slowly over time and is not a random sample.
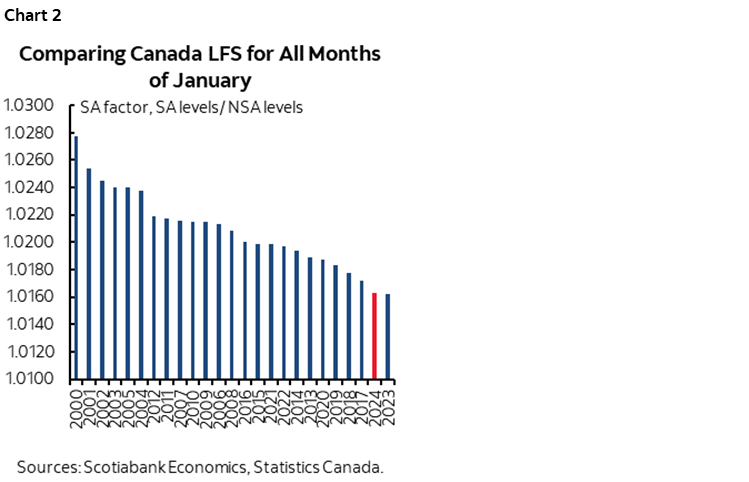
- A downside risk may be the SA factor, but if so, then I’ll seek to control for that with alternative scenarios. The January SA factor for the level of employment in January has been at record lows in the past two years (chart 2). Data agencies are having trouble with SA factors across multiple reports in Canada and the US.
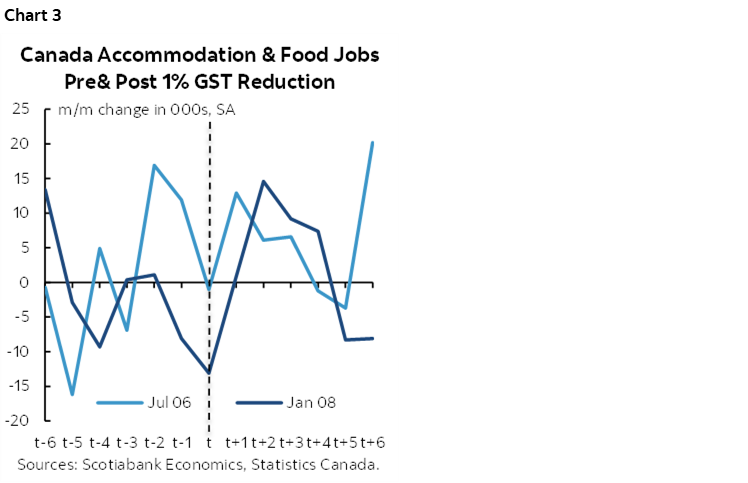
- Next, consider that when we’ve seen GST/HST cuts in the past—like July 2006 and January 2008—the second month following the cost has generally seen positive job growth especially in sectors most affected like accommodation and food (chart 3).
- There is a limited variety of advance indicators available in Canada, but they’re generally constructive. Indeed job postings have been trending up over recent months (chart 4).

- The CFIB’s small business hiring gauge slipped a touch in January but is on a smoothed uptrend.
- The volatile ‘real-time local business conditions index’ that is very fresh and done on a high frequency basis roughly correlates with job growth over time and suggests further expansion, though it doesn’t always work each month. This measure distills things like business openings and closings and GPS data into an activity index. Presumably, if it’s up—as it was in January—then it indicates folks are out and about and probably not sightseeing in January. In Canada. So they’re probably spending or going to and from work.
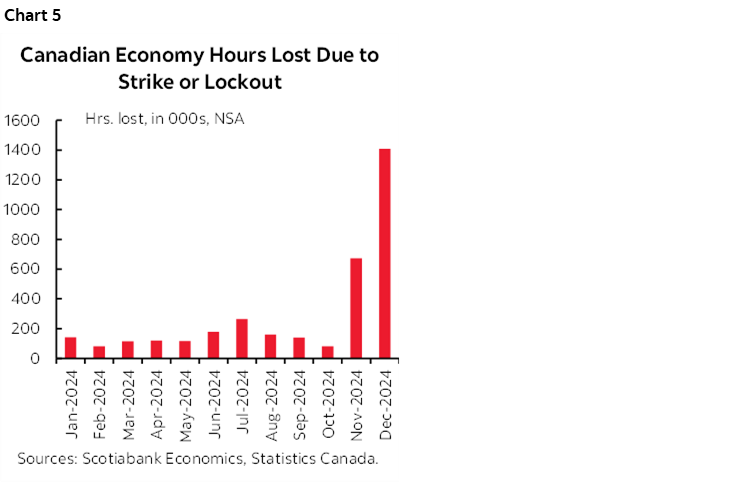
- I’m unsure of what to expect for hours worked. They were up strongly in December (+0.5% m/m SA) despite a surge in hours lost due to strikes and labour disruptions that occurred at Canada Post, as well as in the rail and port sectors (chart 5).
- To get a higher UR like others have would require another explosive month for growth in the labour force since they don’t have jobs being shed. Maybe. But after about 200k more entrants in the past two months which is the strongest rolling two-month expansion since July 2021 when folks were re-entering the workforce I figure the odds are skewed toward softer growth in the pool of labour.
NONFARM PAYROLLS PREVIEW
This is the jobs report that doesn’t matter to the Fed. Not one bit. Not yet anyway since they’re clearly saying they are on hold on March 19th and this is one of four (4!) payrolls reports before the next FOMC decision on May 7th. Market noise, no policy relevance.
Remember the 90% confidence interval around estimated changes in employment each month is about +/-130k. Tail calls worth arguing over would be <100 or >300.
Consensus median change 000s: 175
Consensus mean: 174.5 (no skewness)
Scotia: 205 (I’m ranked #5 out of 77)
Range: 105 – 240
Whisper number: 199
Std dev: 29.7
90% CI: +/- 130
UR: 4.1 unchanged / Scotia 4.2%
Hours worked: 0% m/m SA
Wages: 0.3% consensus and Scotia
Rationale:
- I went with a higher UR because it is derived from the household survey that registered a massive 478k employment gain and a more modest 243k gain in the labour force that I expect to mean revert more on the employment side.
- There are three sources of revisions that make this report more complicated than others and which should mitigate confidence in the estimates.
- One is the usual two-month rolling revision effect as new information comes in.
- Two is the quarterly birth-death model revision that many expect to be a source of downward revision to December.
- Three is the final annual benchmarking exercise of payrolls to data drawn from state level tax filings which affects the March 2024 level for payrolls. This latter effect shaved over 800k off of last March’s level of payrolls when the preliminary revisions were announced last August. Be careful with what could change through this annual effect this time since state level data and nonfarm have different samples with different methodologies. Some think it will take the March level lower yet, but strident opinions on that have been unreliable.
- And so both the level prior to Q4 and the level at December may be revised in complicated and possibly competing ways. This confluence of revision effects could affect the hand-off effect to January.
- A downside risk to the m/m jobs estimate is the SA factor that has tended to be low in January for recent years compared to prior ones (chart 6). The same holds through Q1 before SA factors begin overstating job growth in Q2, then understating in Q3, then overstating in Q4 again. I’ll offer alternative scenarios for SA factors.

- California wildfires may have an effect, but they are expected to be a minor influence and have been in past fires like 2021 and 2021 albeit LA was obviously hit harder this time. They are more likely to affect the household survey than payrolls since not showing up for work that would hit the household survey is more likely than dropping off payrolls entirely. If this is an effect, then control for it if we get useful guidance.
- Most advance indicators suggest a robust labour market in January, but they don’t necessarily mean a whole lot given historical correlations and nonfarm’s unique methodology:
- ISM-services-employment climbed a full point to 52.3, indicating quicker hiring in services.
- ISM-manufacturing-employment jumped about 5 full points to 50.3 suggesting no further shedding.
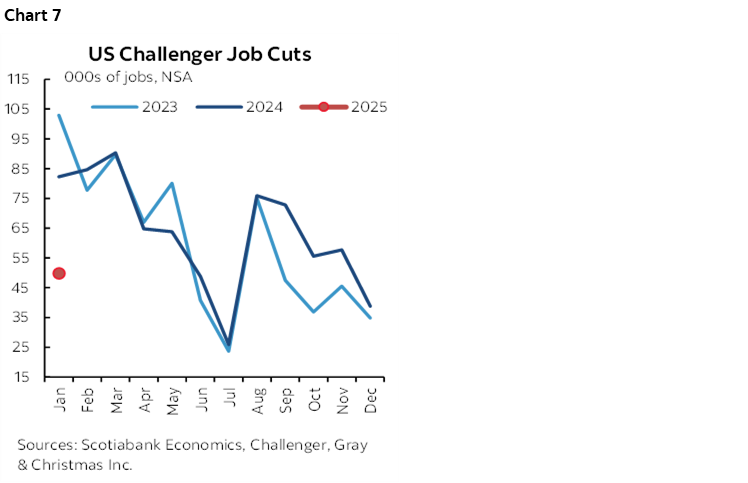
- Challenger mass layoffs were unusually very low at about 50k versus 82k last January and 103k the prior January. This year bucked the recent trend of coming in high to start the year with corporate downsizing (chart 7).
- Jobs plentiful in consumer confidence slipped
- JOLTS job openings slipped by about half a million to 7.6 million in December. It’s lagging, and also note that quits picked up somewhat which may indicate greater comfort toward switching jobs.
- ADP was up 183k. Weak tracking.
- Initial jobless claims were little changed between December and January nonfarm reference periods or household survey reference weeks.
CANADIAN SUMMIT, BANK OF CANADA RECAP
There will also be some headlines out of this hastily arranged Summit announced by PM Trudeau a couple of days ago. The positive is that folks are talking about what to do to pivot in the face of US trade aggression, but go in with rather modest expectations that Canada will suddenly wave a magic wand that rids it of interprovincial growth barriers and fundamentally resets a heavily distributive agenda over the past ten years into a growth agenda.
And Bank of Canada Governor Macklem’s speech drop (here) didn’t offer anything that was materially different from what he said at his January press conference. His emphasis upon how “threats of new tariffs are already affecting business and household confidence” and that monetary policy can “help with the short-run adjustment” is language that may be open to near-term easing. But that is to be traded off against all the warnings about supply chain disruptions and uncertainty around trading off “the downward pressure on inflation from weaker economic activity….against the upward pressures from higher input prices and supply chain disruptions”
My takeaway from it all is that markets leaning toward 50–75bps of further easing sounds somewhat rich while he isn’t talking in a way that sounds at all supportive of some of the much more aggressive forecasts on the street. As for March, it’s a data dependent call with two jobs reports and one CPI report arriving before that meeting.
DISCLAIMER
This report has been prepared by Scotiabank Economics as a resource for the clients of Scotiabank. Opinions, estimates and projections contained herein are our own as of the date hereof and are subject to change without notice. The information and opinions contained herein have been compiled or arrived at from sources believed reliable but no representation or warranty, express or implied, is made as to their accuracy or completeness. Neither Scotiabank nor any of its officers, directors, partners, employees or affiliates accepts any liability whatsoever for any direct or consequential loss arising from any use of this report or its contents.
These reports are provided to you for informational purposes only. This report is not, and is not constructed as, an offer to sell or solicitation of any offer to buy any financial instrument, nor shall this report be construed as an opinion as to whether you should enter into any swap or trading strategy involving a swap or any other transaction. The information contained in this report is not intended to be, and does not constitute, a recommendation of a swap or trading strategy involving a swap within the meaning of U.S. Commodity Futures Trading Commission Regulation 23.434 and Appendix A thereto. This material is not intended to be individually tailored to your needs or characteristics and should not be viewed as a “call to action” or suggestion that you enter into a swap or trading strategy involving a swap or any other transaction. Scotiabank may engage in transactions in a manner inconsistent with the views discussed this report and may have positions, or be in the process of acquiring or disposing of positions, referred to in this report.
Scotiabank, its affiliates and any of their respective officers, directors and employees may from time to time take positions in currencies, act as managers, co-managers or underwriters of a public offering or act as principals or agents, deal in, own or act as market makers or advisors, brokers or commercial and/or investment bankers in relation to securities or related derivatives. As a result of these actions, Scotiabank may receive remuneration. All Scotiabank products and services are subject to the terms of applicable agreements and local regulations. Officers, directors and employees of Scotiabank and its affiliates may serve as directors of corporations.
Any securities discussed in this report may not be suitable for all investors. Scotiabank recommends that investors independently evaluate any issuer and security discussed in this report, and consult with any advisors they deem necessary prior to making any investment.
This report and all information, opinions and conclusions contained in it are protected by copyright. This information may not be reproduced without the prior express written consent of Scotiabank.
™ Trademark of The Bank of Nova Scotia. Used under license, where applicable.
Scotiabank, together with “Global Banking and Markets”, is a marketing name for the global corporate and investment banking and capital markets businesses of The Bank of Nova Scotia and certain of its affiliates in the countries where they operate, including; Scotiabank Europe plc; Scotiabank (Ireland) Designated Activity Company; Scotiabank Inverlat S.A., Institución de Banca Múltiple, Grupo Financiero Scotiabank Inverlat, Scotia Inverlat Casa de Bolsa, S.A. de C.V., Grupo Financiero Scotiabank Inverlat, Scotia Inverlat Derivados S.A. de C.V. – all members of the Scotiabank group and authorized users of the Scotiabank mark. The Bank of Nova Scotia is incorporated in Canada with limited liability and is authorised and regulated by the Office of the Superintendent of Financial Institutions Canada. The Bank of Nova Scotia is authorized by the UK Prudential Regulation Authority and is subject to regulation by the UK Financial Conduct Authority and limited regulation by the UK Prudential Regulation Authority. Details about the extent of The Bank of Nova Scotia's regulation by the UK Prudential Regulation Authority are available from us on request. Scotiabank Europe plc is authorized by the UK Prudential Regulation Authority and regulated by the UK Financial Conduct Authority and the UK Prudential Regulation Authority.
Scotiabank Inverlat, S.A., Scotia Inverlat Casa de Bolsa, S.A. de C.V, Grupo Financiero Scotiabank Inverlat, and Scotia Inverlat Derivados, S.A. de C.V., are each authorized and regulated by the Mexican financial authorities.
Not all products and services are offered in all jurisdictions. Services described are available in jurisdictions where permitted by law.