ON DECK FOR WEDNESDAY, FEBRUARY 5
KEY POINTS:
- Markets focused upon US, Eurozone labour markets
- Eurozone wage tracker points to coolest pressures since 2021Q3…
- …but with substantial caveats
- US ADP, ISM-services on tap and may further inform nonfarm expectations…
- ...but be very wary of attaching much significance to what they show
- Canada to update trade figures
- Trump’s latest stunningly ignorant remarks roil the Middle East
Light overnight developments were primarily focused upon further evidence of wage disinflation in the Eurozone, albeit with strong caveats. EGBs were already richer perhaps in anticipation of soft wage figures that reaffirmed the move down in yields. The dollar is broadly softer. Equities are on their backfoot with broad but mild declines across US futures and most of Europe and flat TSX futures.
THE ECB’S ‘WAGE TRACKER’ SLOWS, WITH STRONG CAVEATS
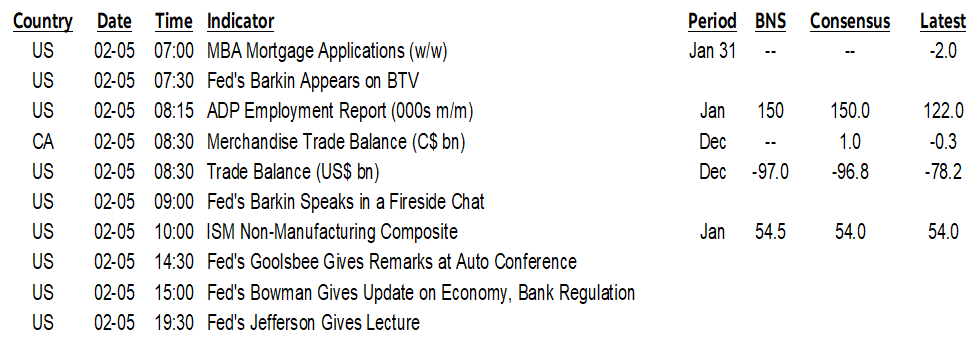
The ECB’s experimental ‘wage tracker’ recorded an estimated growth rate for 2025Q4 of 1.456% y/y (chart 1). That’s the lowest reading since 2021Q3 and hence it continues to crash from the pandemic-era peaks. This measure merely takes known information on collective bargaining agreements to date and maps out the path for y/y wage growth one year ahead.
One obvious caution is the role of year-over-year base effects. The 2025Q4 prediction is based off of the record peak that was set in 2024Q4 at 5.3% y/y.
Also note that the employee coverage ratio for the latest readings reached a low of 34.8% and may not be indicative of broader wage pressures.
New collective bargaining agreements could change the picture.
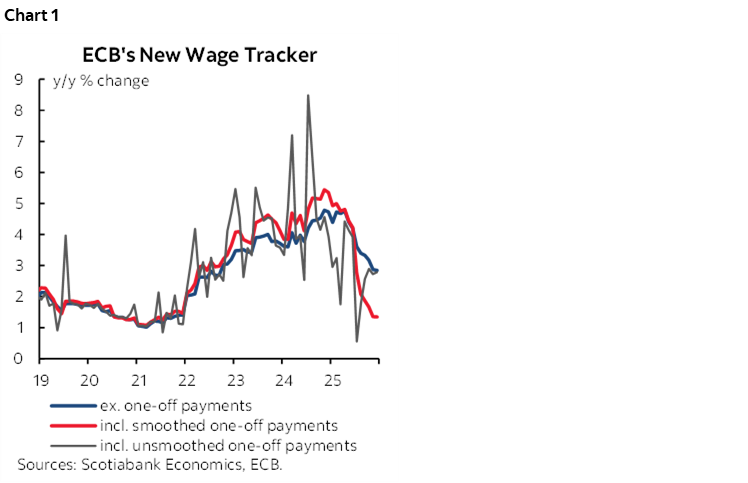
There are also other wage measures to consider. Contrast the ECB’s wage tracker against, say, Indeed’s wage growth tracker that measures wage gains across new job postings (chart 2). It peaked in late 2022 and those base effects have shaken out by now while continuing gains of 3¼% y/y.
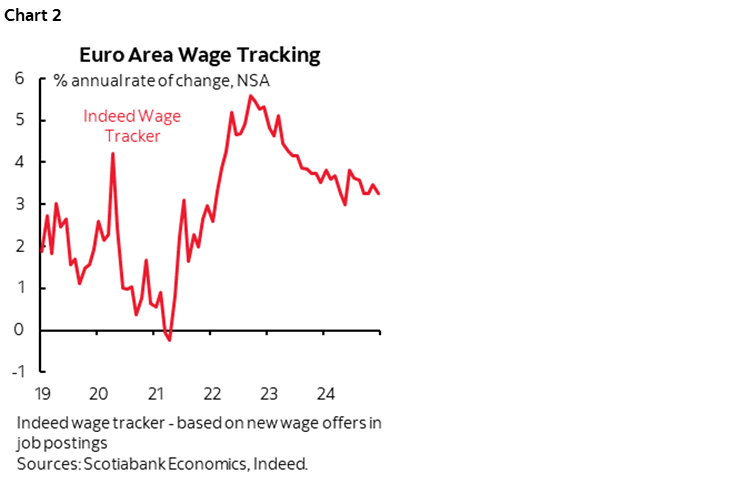
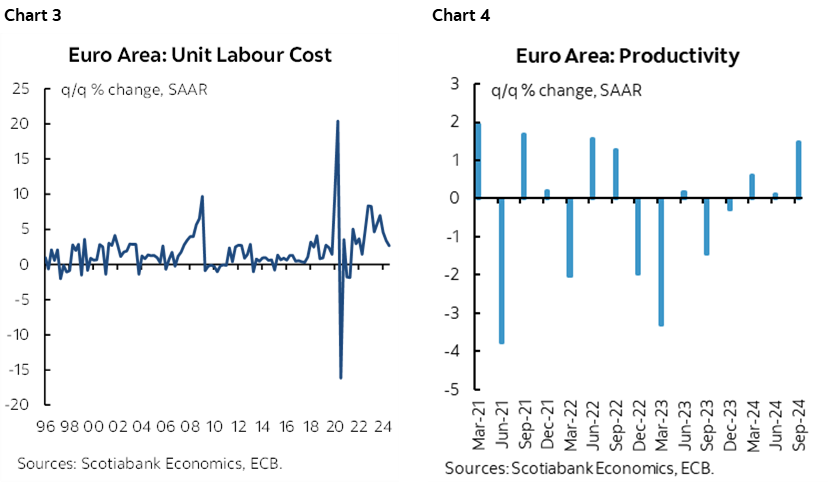
Contrast the ECB’s measure against growth in unit labour costs (chart 3) that distill what’s happening to labour costs and productivity (chart 4) in one all-in measure. Trend growth in that measure has skyrocketed and labour productivity is tumbling with one solitary exception possibly being Q3 of last year which requires much more evidence in order to believe that the Eurozone is suddenly some great productivity miracle.
US DEVELOPMENTS
Data risk will dominate over Trump’s latest totally ignorant remarks, this time about plans for ‘the Gaza thing’ as he put it and that are sparking widespread condemnation across the Middle East.
The main calendar-based focal points today will be US ISM-services for January including the employment subindex (10amET), US ADP private payrolls in January (8:15amET), and Canada’s trade figures (8:30amET). The US releases will be warm-ups for Friday’s nonfarm payrolls. See my Global Week Ahead for a preview of it.
ADP matters only if there are large deviations from expectations for private nonfarm payrolls and even then it’s a stretch. I’ll update the probability of surprise estimates based on past initial ADP and private nonfarm readings after we see what the random number generator spits out.
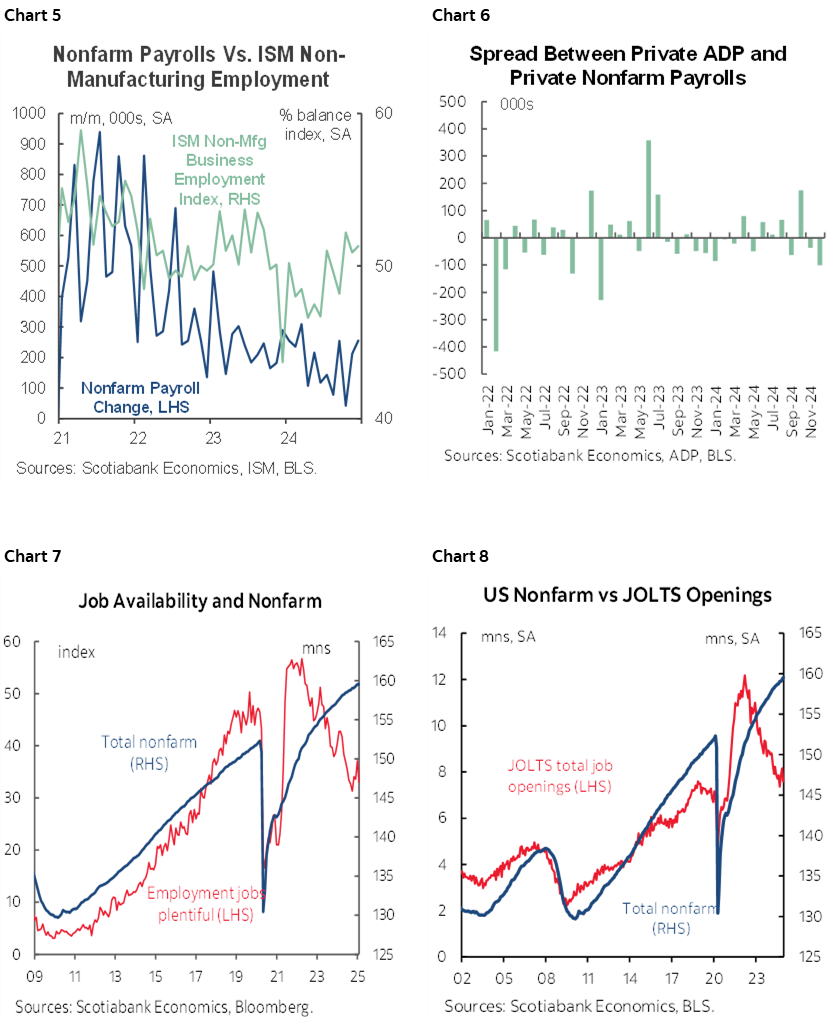
Little change is expected for ISM-services. The employment component of ISM-services matters more than the one from the manufacturing survey given the weight on services in the US economy, but in all cases, the advance indicators don’t perform very well individually as predictors nonfarm payrolls. They are very, very rough guides at best.
That’s true of ISM-services-employment (chart 5), ADP and the large deviations that routinely arise (chart 6), consumer confidence jobs plentiful (chart 7), JOLTS (chart 8), NFIB-hiring that doesn’t arrive until next week, claims and mass layoffs that we get tomorrow. Taken together, if they paint a similar picture then they can be helpful, along with SA factors that will begin to add renewed upside in subsequent months after January, knowledge of nonfarm’s methodological quirks, and special factors.
And of course. a high degree of humility around the estimates is always required given the massive degree of statistical noise in nonfarm payrolls. I rank 5th out of about 70 nonfarm payroll forecasters and yet always make a habit of pointing out the +/-130k 90% confidence interval around estimated m/m changes in payrolls.
The coming payrolls report is also complicated by two sources of revisions to the levels. One is the final annual benchmarking revision to what state tax records indicate which affects the level last March which may affect the level but not the change for months after March. Attempts at mapping what the state records show onto nonfarm payrolls are fraught with many perils, not least of which being different methodologies. Second is the quarterly re-estimation of the birth-death model that seeks to capture changes in openings and closings not well captured by payrolls which could affect the level and the December hand-off to January.
In short, the coinciding two sources of revision risk on top of the regular monthly revisions make for more uncertainty into this one for the level and change. I went with +205k subject to a high bar set for new information to matter (consensus 170k).
We will also hear from FOMC officials including Barkin (7:30am & 9amET), Goolsbee (2:30pmET), Bowman (3pmET), and Jefferson (7:30pmET). The ECB’s Lane speaks at 9amET.
DISCLAIMER
This report has been prepared by Scotiabank Economics as a resource for the clients of Scotiabank. Opinions, estimates and projections contained herein are our own as of the date hereof and are subject to change without notice. The information and opinions contained herein have been compiled or arrived at from sources believed reliable but no representation or warranty, express or implied, is made as to their accuracy or completeness. Neither Scotiabank nor any of its officers, directors, partners, employees or affiliates accepts any liability whatsoever for any direct or consequential loss arising from any use of this report or its contents.
These reports are provided to you for informational purposes only. This report is not, and is not constructed as, an offer to sell or solicitation of any offer to buy any financial instrument, nor shall this report be construed as an opinion as to whether you should enter into any swap or trading strategy involving a swap or any other transaction. The information contained in this report is not intended to be, and does not constitute, a recommendation of a swap or trading strategy involving a swap within the meaning of U.S. Commodity Futures Trading Commission Regulation 23.434 and Appendix A thereto. This material is not intended to be individually tailored to your needs or characteristics and should not be viewed as a “call to action” or suggestion that you enter into a swap or trading strategy involving a swap or any other transaction. Scotiabank may engage in transactions in a manner inconsistent with the views discussed this report and may have positions, or be in the process of acquiring or disposing of positions, referred to in this report.
Scotiabank, its affiliates and any of their respective officers, directors and employees may from time to time take positions in currencies, act as managers, co-managers or underwriters of a public offering or act as principals or agents, deal in, own or act as market makers or advisors, brokers or commercial and/or investment bankers in relation to securities or related derivatives. As a result of these actions, Scotiabank may receive remuneration. All Scotiabank products and services are subject to the terms of applicable agreements and local regulations. Officers, directors and employees of Scotiabank and its affiliates may serve as directors of corporations.
Any securities discussed in this report may not be suitable for all investors. Scotiabank recommends that investors independently evaluate any issuer and security discussed in this report, and consult with any advisors they deem necessary prior to making any investment.
This report and all information, opinions and conclusions contained in it are protected by copyright. This information may not be reproduced without the prior express written consent of Scotiabank.
™ Trademark of The Bank of Nova Scotia. Used under license, where applicable.
Scotiabank, together with “Global Banking and Markets”, is a marketing name for the global corporate and investment banking and capital markets businesses of The Bank of Nova Scotia and certain of its affiliates in the countries where they operate, including; Scotiabank Europe plc; Scotiabank (Ireland) Designated Activity Company; Scotiabank Inverlat S.A., Institución de Banca Múltiple, Grupo Financiero Scotiabank Inverlat, Scotia Inverlat Casa de Bolsa, S.A. de C.V., Grupo Financiero Scotiabank Inverlat, Scotia Inverlat Derivados S.A. de C.V. – all members of the Scotiabank group and authorized users of the Scotiabank mark. The Bank of Nova Scotia is incorporated in Canada with limited liability and is authorised and regulated by the Office of the Superintendent of Financial Institutions Canada. The Bank of Nova Scotia is authorized by the UK Prudential Regulation Authority and is subject to regulation by the UK Financial Conduct Authority and limited regulation by the UK Prudential Regulation Authority. Details about the extent of The Bank of Nova Scotia's regulation by the UK Prudential Regulation Authority are available from us on request. Scotiabank Europe plc is authorized by the UK Prudential Regulation Authority and regulated by the UK Financial Conduct Authority and the UK Prudential Regulation Authority.
Scotiabank Inverlat, S.A., Scotia Inverlat Casa de Bolsa, S.A. de C.V, Grupo Financiero Scotiabank Inverlat, and Scotia Inverlat Derivados, S.A. de C.V., are each authorized and regulated by the Mexican financial authorities.
Not all products and services are offered in all jurisdictions. Services described are available in jurisdictions where permitted by law.