ON DECK FOR MONDAY, FEBRUARY 10

KEY POINTS:
- Markets largely shake off Trump’s latest trade tantrums
- Trump to deliver executive order on steel and aluminum tariffs today
- Canada is the biggest exporter of steel and aluminum to the US
- Expect high pass through of tariffs into steel and aluminum prices
- Multiple studies showed that the US hurt itself with the 2018 steel & aluminum tariffs
- Canada would not be better off as part of the US
- Global Week Ahead — The Super Bowl of Budgets (here)
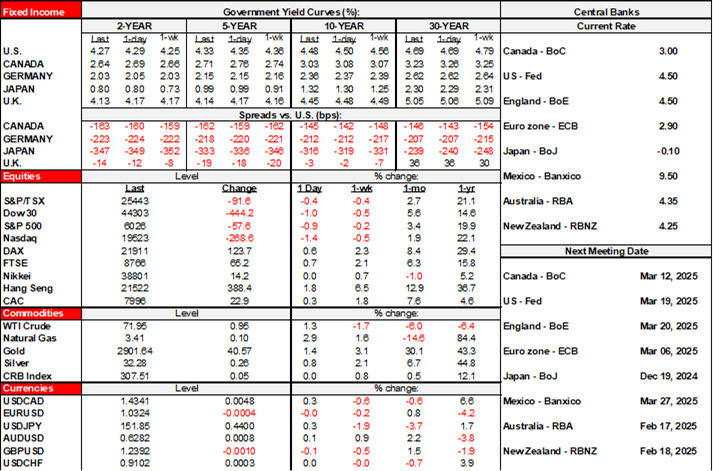
So far, markets are taking another belligerent move by Trump relatively well. Sovereign yields are little changed but with a roughly 5bps decline in Canadian yields from 2s through 10s outperforming other global benchmarks. Equities are broadly higher by roughly ¼% to ½% across exchanges. The dollar is mixed but both CAD and MXN are slightly depreciating with CAD the weakest performer among major crosses largely because it is the biggest exporter of the targeted metals to the US. There is nothing else material by way of developments across global markets to start the week.
Steel and Aluminum Tariffs Coming Today
Trump said yesterday that he would announce 25% tariffs on all imports of steel and aluminum today. Watch for an executive order to be issued at around 1pmET. Then watch for the retaliation announcements as in 2018.
Canada is the number 1 source of US steel imports but only barely above the EU taken as a whole (chart 1). Canada is by far the number 1 source of US aluminum imports (chart 2).
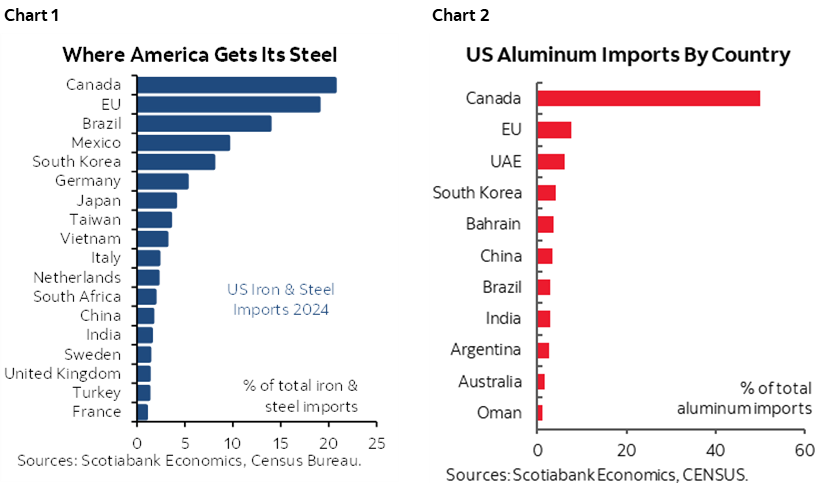
Canadian exports of steel and aluminum to the USD equalled 5.8% of all Canadian exports to the US including 1.8% in iron and steel, 1.4% in articles of iron and steel, and 2.7% of alumina and aluminum products.
Canadian imports of US iron and steel and aluminum equal about 4.6% of all imports from the US broken down as 1.56% iron and steel, 1.95% articles of iron and steel, and 1.09% alumina and aluminum processing.
Chart 3 shows the trend in Canadian exports to the US of steel and aluminum as a share of total Canadian exports. Chart 4 shows the same thing for the US to Canada. Chart 5 shows Canadian imports of these products from the US and chart 6 does likewise for the US.
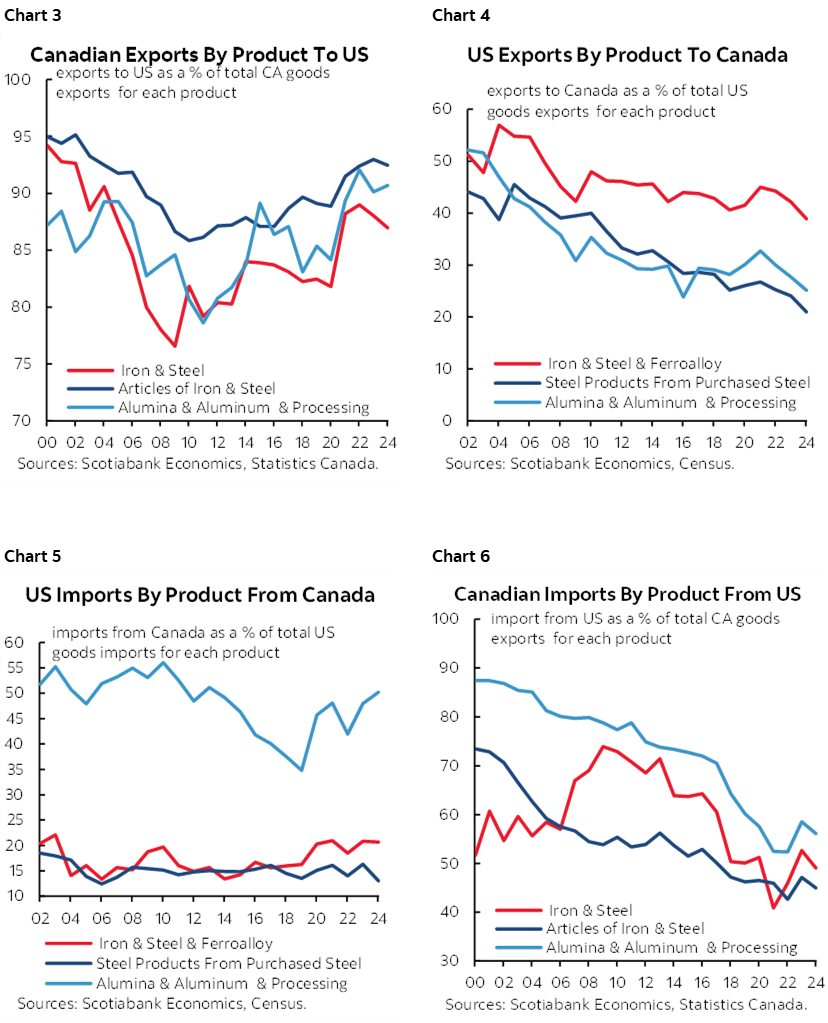
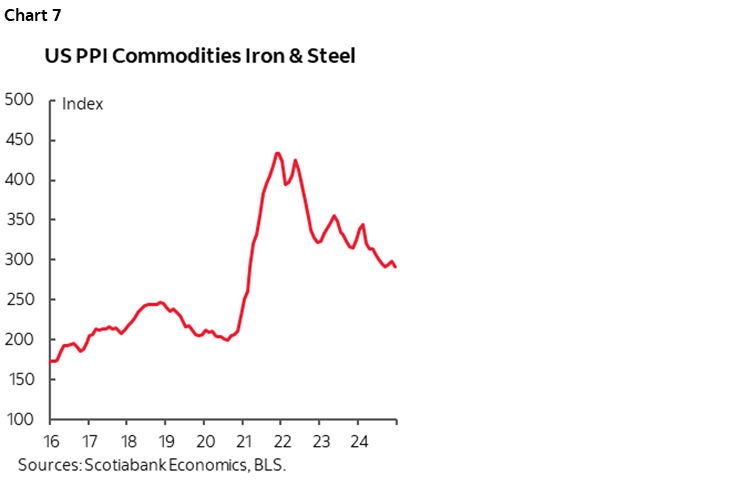
Naturally, these figures understate the extent to which steel and aluminum are used in many products. The pass through incidence effects of tariffs are likely to work through every product from autos to appliances as just two examples. For example, the US producer price index for iron and steel surged by about 17% after the 2018 25% tariffs, though that was child’s play compared to the supply chain disruptions in the pandemic (chart 7).
Trump also pledged to announce reciprocal tariffs on any country that imposes tariffs on the US and to do so in separate orders over the next couple of days or so. The US already has an average tariff rate of 3.5% on all imports including 4.8% on agricultural imports and 3.2% on non-agricultural imports so once again we have a case of do-as-I-say-not-as-I-do when it comes to American trade policy (here). Canada’s is higher (here). America, however, also uses other tactics beyond tariffs, like constant trade harassment and refusal to abide by agreements and rulings on commodities like Canadian lumber exports where it steadily loses arbitration panel decisions. The US employs heavy use of subsidies across multiple industries such that its protections extend far beyond tariffs. And the US frequently does not honour its own agreements as we’ve seen in the steel and aluminum tariffs of 2018, NAFTA tensions, the latest round of metals tariffs and Trump’s constant threats to impose draconian tariffs that far swap any average tariff rates imposed by others.
This is a decent summary of the economic impact of the US Section 232 steel and aluminum tariffs in 2018. It reviews several studies that looked at the impact on GDP, jobs, exports etc.
How Canada Compares to the US
So Canada would fare better as the 51st state? Trump says so and he never bends the truth, right? Hmph. Let’s remind him of some facts on how America compares to Canada. There is much, much more to comparisons that average incomes.
1. There is little question that US incomes on average are higher than Canada’s and that Canada’s GDP per capita has been falling at least temporarily, although reducing the population of temporary residents is likely to improve this measure. But much of that comparison reflects a skewness toward the very well off. Canada ranks only slightly behind the US on median household incomes. And there is more to the picture than incomes. Much more.
2. World Bank Human Capital Index: Canada ranks above the United States in every single category including overall human capital index, the index for men and the index for women, expected years of school, harmonized test scores, years of school and survival rates. Get the data here.
3. Canada ranks above the US on the UN’s Human Development Index. Go here.
4. The Economist’s Global Liveability Index includes two Canadian cities (Calgary, Vancouver) in the top 10 worldwide and no US cities. Toronto is 12th. The highest-ranked US city in the world is Honolulu—at #23. Sorry New York, you’re only 70th. Here. The Economist says “Canada’s strengths are its public services, particularly its health-care and education systems, which consistently earn top scores. The country is also more stable politically and has less violence than does its southern neighbour.”
5. Canada ranks higher than the US on the UN’s Universal Health Coverage Service Coverage Index that measures access to health care (here). Around 26 million Americans have no health coverage (here). Don’t get sick in the US if you have no insurance or little insurance which is a whole other category; at a minimum it can be financially ruinous if you are at all able to get treatment.
6. Canada ranks higher than the US on harmonized test scores (here and here).
7. On income inequality there is no comparison. Canada’s Gini coefficient is much lower than the US (here).
8. The US murder rate is nearly triple that of Canada’s (here). Canada’s homicide rate per 100,000 people is 2.27. The US sits at 6.38. Gun ownership in the US is vastly higher than in Canada and other developed economies.
9. Canada ranks far safer than the US on overall crime rates. These folks rank Canada as a category 3 country on a 1–11 scale and rank the US at 7 on the same scale.
10. US fiscal policy is mismanaged by a massively wide margin to Canada. The US Federal government’s deficit to GDP ratio is over 7%. Canada’s is just over 1%.
11. Canada has longer life expectancy than the US by several years on average according to both the UN and World Bank measures (here).
DISCLAIMER
This report has been prepared by Scotiabank Economics as a resource for the clients of Scotiabank. Opinions, estimates and projections contained herein are our own as of the date hereof and are subject to change without notice. The information and opinions contained herein have been compiled or arrived at from sources believed reliable but no representation or warranty, express or implied, is made as to their accuracy or completeness. Neither Scotiabank nor any of its officers, directors, partners, employees or affiliates accepts any liability whatsoever for any direct or consequential loss arising from any use of this report or its contents.
These reports are provided to you for informational purposes only. This report is not, and is not constructed as, an offer to sell or solicitation of any offer to buy any financial instrument, nor shall this report be construed as an opinion as to whether you should enter into any swap or trading strategy involving a swap or any other transaction. The information contained in this report is not intended to be, and does not constitute, a recommendation of a swap or trading strategy involving a swap within the meaning of U.S. Commodity Futures Trading Commission Regulation 23.434 and Appendix A thereto. This material is not intended to be individually tailored to your needs or characteristics and should not be viewed as a “call to action” or suggestion that you enter into a swap or trading strategy involving a swap or any other transaction. Scotiabank may engage in transactions in a manner inconsistent with the views discussed this report and may have positions, or be in the process of acquiring or disposing of positions, referred to in this report.
Scotiabank, its affiliates and any of their respective officers, directors and employees may from time to time take positions in currencies, act as managers, co-managers or underwriters of a public offering or act as principals or agents, deal in, own or act as market makers or advisors, brokers or commercial and/or investment bankers in relation to securities or related derivatives. As a result of these actions, Scotiabank may receive remuneration. All Scotiabank products and services are subject to the terms of applicable agreements and local regulations. Officers, directors and employees of Scotiabank and its affiliates may serve as directors of corporations.
Any securities discussed in this report may not be suitable for all investors. Scotiabank recommends that investors independently evaluate any issuer and security discussed in this report, and consult with any advisors they deem necessary prior to making any investment.
This report and all information, opinions and conclusions contained in it are protected by copyright. This information may not be reproduced without the prior express written consent of Scotiabank.
™ Trademark of The Bank of Nova Scotia. Used under license, where applicable.
Scotiabank, together with “Global Banking and Markets”, is a marketing name for the global corporate and investment banking and capital markets businesses of The Bank of Nova Scotia and certain of its affiliates in the countries where they operate, including; Scotiabank Europe plc; Scotiabank (Ireland) Designated Activity Company; Scotiabank Inverlat S.A., Institución de Banca Múltiple, Grupo Financiero Scotiabank Inverlat, Scotia Inverlat Casa de Bolsa, S.A. de C.V., Grupo Financiero Scotiabank Inverlat, Scotia Inverlat Derivados S.A. de C.V. – all members of the Scotiabank group and authorized users of the Scotiabank mark. The Bank of Nova Scotia is incorporated in Canada with limited liability and is authorised and regulated by the Office of the Superintendent of Financial Institutions Canada. The Bank of Nova Scotia is authorized by the UK Prudential Regulation Authority and is subject to regulation by the UK Financial Conduct Authority and limited regulation by the UK Prudential Regulation Authority. Details about the extent of The Bank of Nova Scotia's regulation by the UK Prudential Regulation Authority are available from us on request. Scotiabank Europe plc is authorized by the UK Prudential Regulation Authority and regulated by the UK Financial Conduct Authority and the UK Prudential Regulation Authority.
Scotiabank Inverlat, S.A., Scotia Inverlat Casa de Bolsa, S.A. de C.V, Grupo Financiero Scotiabank Inverlat, and Scotia Inverlat Derivados, S.A. de C.V., are each authorized and regulated by the Mexican financial authorities.
Not all products and services are offered in all jurisdictions. Services described are available in jurisdictions where permitted by law.