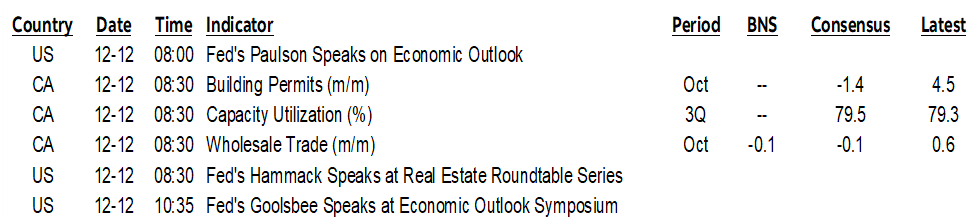
ON DECK FOR FRIDAY, DECEMBER 12
KEY POINTS:
- Reasonably calm markets, light calendars to end an active week
- China’s domestic currency loan growth is at a quarter-century low
- Gilts outperform after weak UK data
- Hats off to the Fed’s brilliant Board of Governors!
- Canadian trade revisions may drive Q3 GDP growth over 3%
There are no major catalysts behind fairly small moves in global sovereign bond yields to end the week. Equities are mixed with US futures tracking a touch lower while Europe rallies after a solid overnight Asian session. The dollar is mixed as it gains on European crosses while CAD and MXN hold their own. China’s credit challenges remain acute, UK data was rather uninspiring, and there is little that’s noteworthy on the North American calendar today beyond light Fed-speak. Canada is quiet other than digesting the move of another turncoat that brings the Liberal government one seat away from a majority.
CHINA’S INELASTIC DEMAND FOR MONEY
Chip wars heated up again overnight. China’s move to throw up to US$70 billion in additional support to its chips sector was the show stealer. Maybe that deliberate in order to mask weak credit figures as a sign of deepening problems.
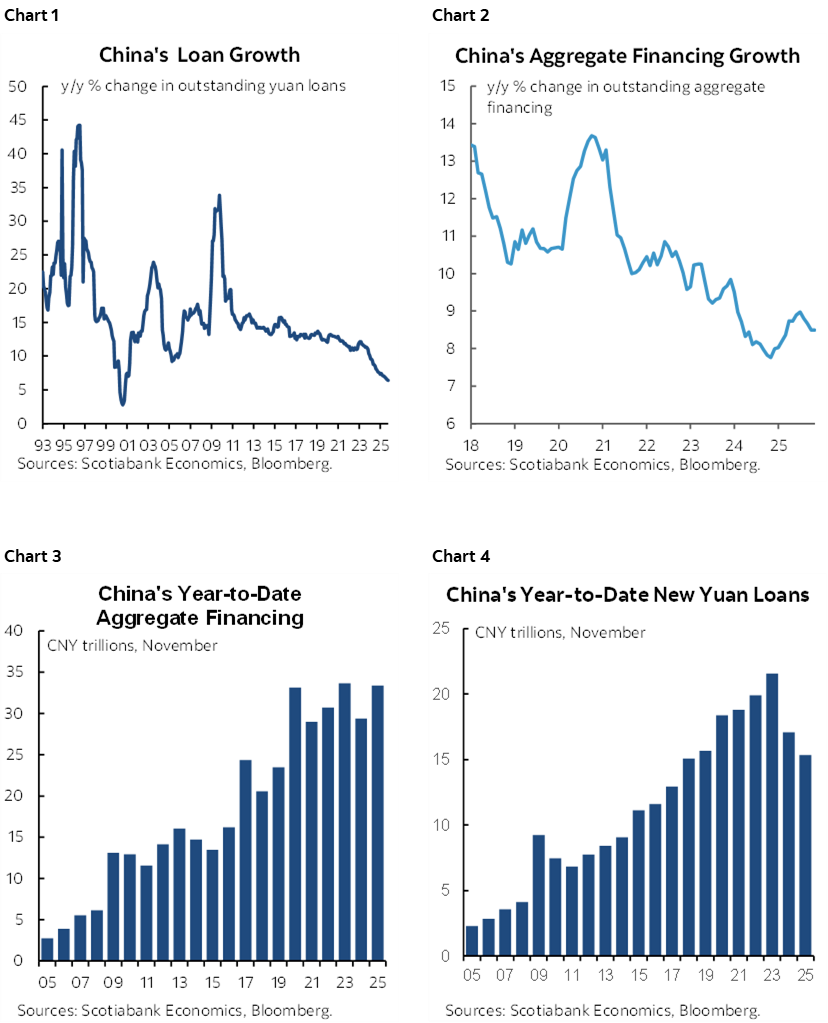
China’s credit cycle continues to slow. Aggregate financing across all products in 2025 has been roughly tied with two earlier peaks in 2020 and 2023 on a flow basis but if not for government bond issuance it would be slower yet as this has represented 40% of total financing in 2025. Core new domestic-currency loan originations are tracking the weakest year since 2018. China is suffering from inelastic demand for money particularly given falling property prices over the past four years and general malaise in the property market that dates back further than that.
Witness charts 1–4. Chart 1 shows that the growth in the total stock of outstanding domestic currency loans is at a quarter-century low. Chart 2 shows that growth in the outstanding stock of all financing products (bonds, equities, yuan denominated and foreign currency loans, bills, trust loans, and shadow products) is also tracking relatively softly. Charts 3 and 4 depict the flow of total aggregate financing and core domestic currency loans.
GILTS OUTPERFORM ON SOFT UK DATA
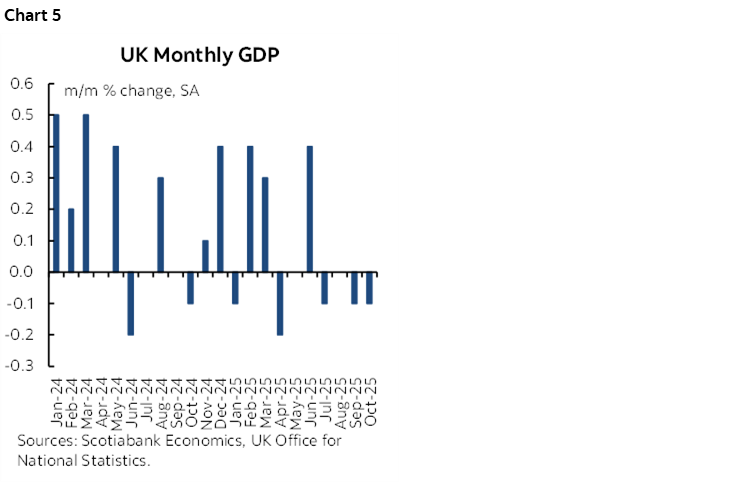
UK data came in softly and motivated slight outperformance by the gilts front-end versus EGBs. GDP unexpectedly shrank by -0.1% m/m in October (+0.1% consensus) as services fell (-0.3% m/m, 0% consensus). Industrial output was up 1.1% (1% consensus) but not due to manufacturing (0.5%, 1.1% consensus). Construction was down -0.6% (-0.1% consensus).
The UK economy has been weak over several months now (chart 5). Cue next week’s BoE cut.
CANADIAN GDP TO BE REVISED HIGHER. AGAIN.
Canadian trade revisions will add to Q3 GDP growth. This view was shared with clients through chats yesterday. Instead of 2.6% q/q SAAR GDP growth in Q3 we may be crossing 3% the next time Statcan takes a swing at the numbers. As charts 6 and 7 demonstrate, the main issue is that what was revealed in the export figures yesterday up to September came in materially stronger than the GDP accounts had assumed. The charts compare export and import growth on a quarterly basis using the monthly trade figures against the trade figures in the GDP accounts; exports were materially stronger and imports were slightly softer than initially estimated. Both of these observations add to GDP—exports for obvious reasons, and weaker imports mean less of an import leakage effect from GDP accounts which in an accounting sense boosts GDP. What GDP had assumed was on a lark in the absence of September data given the US government shutdown and the important of sharing data between the countries to the overall trade position.
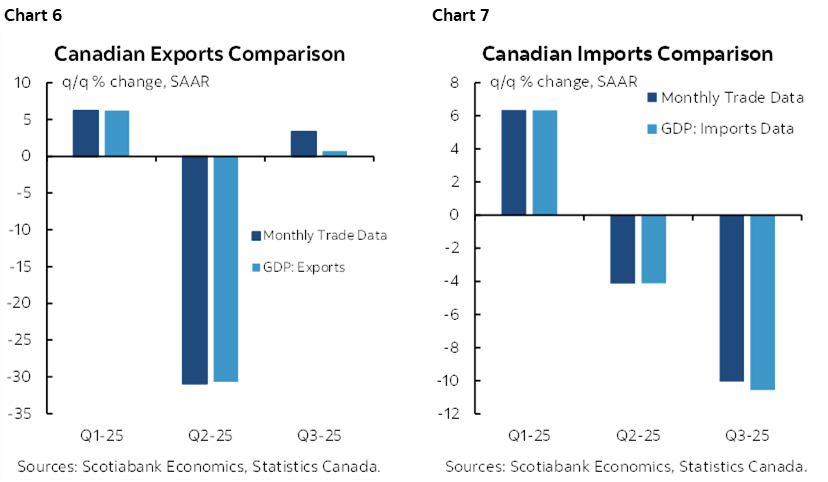
What we don’t know, however, are the implications of the trade figures for other parts of the GDP accounts like inventories. Still, the BoC would welcome better trade figures than initially estimated in Q3 GDP.
FED BOARD 1. TRUMP ADMIN 0.
Brilliant. Absolutely brilliant. Hats off to the Fed’s Board of Governors for pre-empting MAGA’s ruinous plan to harm the Fed’s independence. Trump and Bessent must have smoke coming out of their ears; maybe MAGA shouldn’t have advertised its plans so loudly. This announcement after yesterday’s close reappointed regional Fed presidents and vice presidents to five-year terms starting on March 2026. This avoids the fracas around their expirations on February 28th. Recall that blogs and former Fed officials like Lael Brainard had been warning that the Trump administration might use the five-year review as an opportunity to meddle in the affairs of the district banks by indirectly setting in motion developments that could have replaced some of them. Bessent amplified such concerns with comments about how the regional Presidents should live in their districts. I actually agree with that given the spirit of intent behind the district banks to represent their regions which one might think would require someone who is intimately familiar with local economies and business.
The administration can't appoint regional Presidents that are put in place by the regional boards and approved by the BoG, but can influence their appointment through BoG appointments and votes on the regional committees they control. This post explains how the reserve bank boards are structured. It's the 'class C' directors of the regional Boards that are appointed by the Fed's BoG. Class B directors are non-bankers. Class B and C directors vote for the regional President (not class 'A' directors that are bankers with potential conflicts of interest). The chair of each regional board is a 'C' class director and so is the deputy. So, stack the 'C' class and you are on your way to meddling with who is chosen as the district President. Not any more!
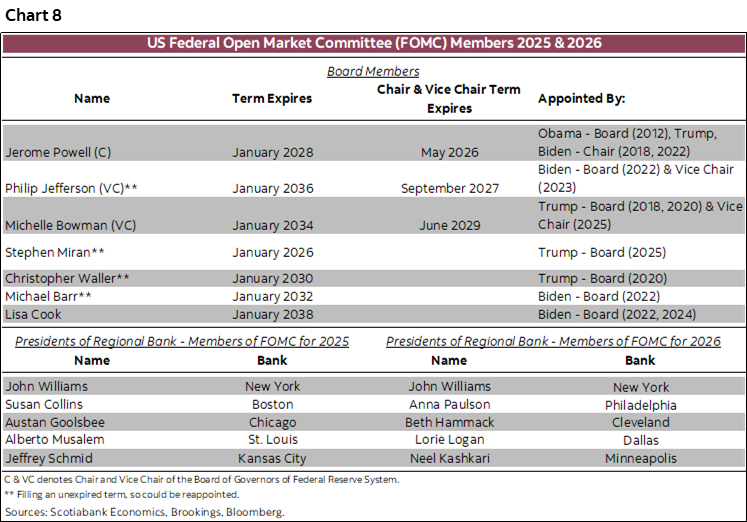
Chart 8, however, shows that there are still spots on the BoG that can be appointed by the administration. Chair Powell will give way to a new chair after the April decision. Powell is likely to step down from the Board in my opinion, versus lingering and second-guessing his successor. Jefferson’s term expires next year. Something has to be done about Miran whose term expires next month because he filled in for Kugler who resigned under controversy.

DISCLAIMER
This report has been prepared by Scotiabank Economics as a resource for the clients of Scotiabank. Opinions, estimates and projections contained herein are our own as of the date hereof and are subject to change without notice. The information and opinions contained herein have been compiled or arrived at from sources believed reliable but no representation or warranty, express or implied, is made as to their accuracy or completeness. Neither Scotiabank nor any of its officers, directors, partners, employees or affiliates accepts any liability whatsoever for any direct or consequential loss arising from any use of this report or its contents.
These reports are provided to you for informational purposes only. This report is not, and is not constructed as, an offer to sell or solicitation of any offer to buy any financial instrument, nor shall this report be construed as an opinion as to whether you should enter into any swap or trading strategy involving a swap or any other transaction. The information contained in this report is not intended to be, and does not constitute, a recommendation of a swap or trading strategy involving a swap within the meaning of U.S. Commodity Futures Trading Commission Regulation 23.434 and Appendix A thereto. This material is not intended to be individually tailored to your needs or characteristics and should not be viewed as a “call to action” or suggestion that you enter into a swap or trading strategy involving a swap or any other transaction. Scotiabank may engage in transactions in a manner inconsistent with the views discussed this report and may have positions, or be in the process of acquiring or disposing of positions, referred to in this report.
Scotiabank, its affiliates and any of their respective officers, directors and employees may from time to time take positions in currencies, act as managers, co-managers or underwriters of a public offering or act as principals or agents, deal in, own or act as market makers or advisors, brokers or commercial and/or investment bankers in relation to securities or related derivatives. As a result of these actions, Scotiabank may receive remuneration. All Scotiabank products and services are subject to the terms of applicable agreements and local regulations. Officers, directors and employees of Scotiabank and its affiliates may serve as directors of corporations.
Any securities discussed in this report may not be suitable for all investors. Scotiabank recommends that investors independently evaluate any issuer and security discussed in this report, and consult with any advisors they deem necessary prior to making any investment.
This report and all information, opinions and conclusions contained in it are protected by copyright. This information may not be reproduced without the prior express written consent of Scotiabank.
™ Trademark of The Bank of Nova Scotia. Used under license, where applicable.
Scotiabank, together with “Global Banking and Markets”, is a marketing name for the global corporate and investment banking and capital markets businesses of The Bank of Nova Scotia and certain of its affiliates in the countries where they operate, including; Scotiabank Europe plc; Scotiabank (Ireland) Designated Activity Company; Scotiabank Inverlat S.A., Institución de Banca Múltiple, Grupo Financiero Scotiabank Inverlat, Scotia Inverlat Casa de Bolsa, S.A. de C.V., Grupo Financiero Scotiabank Inverlat, Scotia Inverlat Derivados S.A. de C.V. – all members of the Scotiabank group and authorized users of the Scotiabank mark. The Bank of Nova Scotia is incorporated in Canada with limited liability and is authorised and regulated by the Office of the Superintendent of Financial Institutions Canada. The Bank of Nova Scotia is authorized by the UK Prudential Regulation Authority and is subject to regulation by the UK Financial Conduct Authority and limited regulation by the UK Prudential Regulation Authority. Details about the extent of The Bank of Nova Scotia's regulation by the UK Prudential Regulation Authority are available from us on request. Scotiabank Europe plc is authorized by the UK Prudential Regulation Authority and regulated by the UK Financial Conduct Authority and the UK Prudential Regulation Authority.
Scotiabank Inverlat, S.A., Scotia Inverlat Casa de Bolsa, S.A. de C.V, Grupo Financiero Scotiabank Inverlat, and Scotia Inverlat Derivados, S.A. de C.V., are each authorized and regulated by the Mexican financial authorities.
Not all products and services are offered in all jurisdictions. Services described are available in jurisdictions where permitted by law.