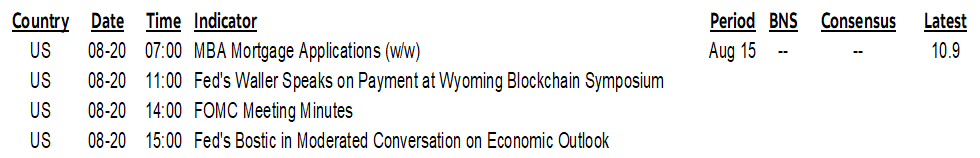
ON DECK FOR WEDNESDAY, AUGUST 20
KEY POINTS:
- Gilts and kiwis outperform with one making more sense than the other
- Stale FOMC minutes will have little to offer
- Gilts ignore warmer UK CPI
- RBNZ cut as expected, dovish guidance drives strong bond rally
- Riksbank held, but left the door open to more
- Bank Indonesia surprises with a cut and dovish guidance
- BoC: you can’t double up on spare capacity arguments for easing…
- …and with full effects of past easing still unfolding…
- …as interest sensitives accelerate…
- …and soaring Canadian pay hikes are undeserved—with pros and cons
Mild risk-off sentiment is weighing on equities as we await you-know-who on Friday. Calendar-based risk will be focused upon minutes to the July 29th–30th FOMC meeting. Overnight developments were fairly light and markets remain focused on Jackson Hole.
Unclear Why Gilts Ignored UK CPI
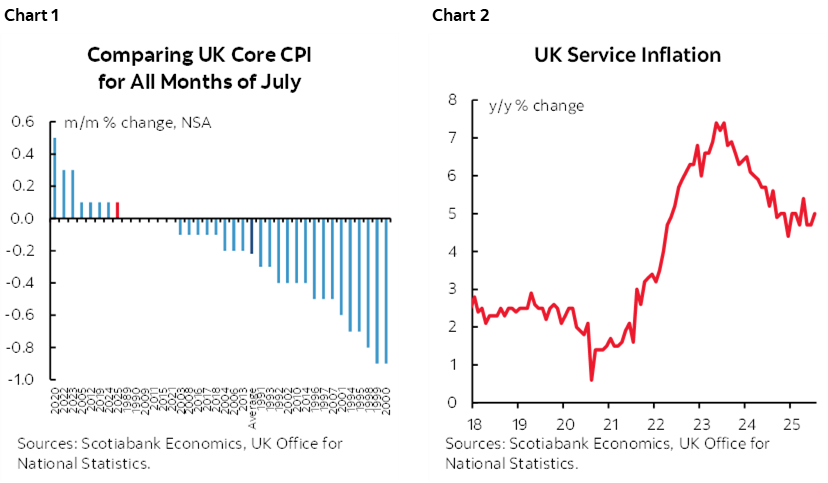
UK inflation surprised to the upside with fairly warm details. Gilts largely shook it off perhaps because of a sense that the drivers were...dare I say it...transitory, although that seems to be an inadequate explanation for why gilts are outperforming all other major sovereign bond markets. Headline CPI was up 0.1% m/m NSA (0% consensus) which pushed the y/y rate up two tenths to 3.8%. Core CPI moved up to 3.8% y/y (3.7 consensus and prior) with the m/m seasonally unadjusted reading among the warmer ones when comparing like months of July over time (chart 1). Services inflation jumped to 5% (4.7% prior) and is showing no signs of cooling (chart 2). Airfare and hotels drove services. Some believe that the effects of concerts in July this year (Oasis) and last summer (Swift) distorted the m/m and y/y readings. Others point to fuel, food, and transport as broader drivers.
Three Regional Central Banks Were All Dovish
Three central bank decisions offered two cuts, one of which was a surprise, but guidance was also important.
- The RBNZ cut by 25bps as widely expected. Dovish guidance indicated openness to two more cuts down to 2.5% by year-end which sank the NZ$ and drove a bull steepener with the two-year yield leading the way with a 17bps rally.
- Bank Indonesia surprised markets with a 25bps cut and appeared open to further easing which weighed on the rupiah.
- Sweden's Riksbank held at 2% as widely expected. Dovish guidance pointed to "some probability of a further interest rate cut this year."
Stale FOMC Minutes on Tap
This afternoon's minutes (2pmET) are likely to be stale in light of mixed data since the meeting (cool jobs, warm inflation) and ahead of Powell’s coming speech at Jackson Hole. Somewhat fresher views than the minutes may be offered by Governor Waller (11amET) but he’s likely to repeat dovish perspectives, and Atlanta President Bostic (3pmET).
BANK OF CANADA
As shared with clients and chat rooms recently, one argument I have a hard time with is that the BoC should be cutting more because of slack. That’s not just because the amount of estimated slack is small and that output gaps play a limited role in explaining inflation.
The BoC saw early signs of slack emerging and anticipated more ahead when they kept cutting into the March meeting and took the policy rate down from 5% in June 2024 to about neutral at 2.75%. To then cut again when you do get some modest slack would be doubling up and insensible unless you think you are getting much more slack than envisaged which I'll return to.
On top of this point, the doves are being too impatient. The full effects of monetary easing take 12–24 months to unfold and so we haven’t even seen the 225bps of easing fully work through the economy yet. A real policy rate toward zero should offer meaningful support.
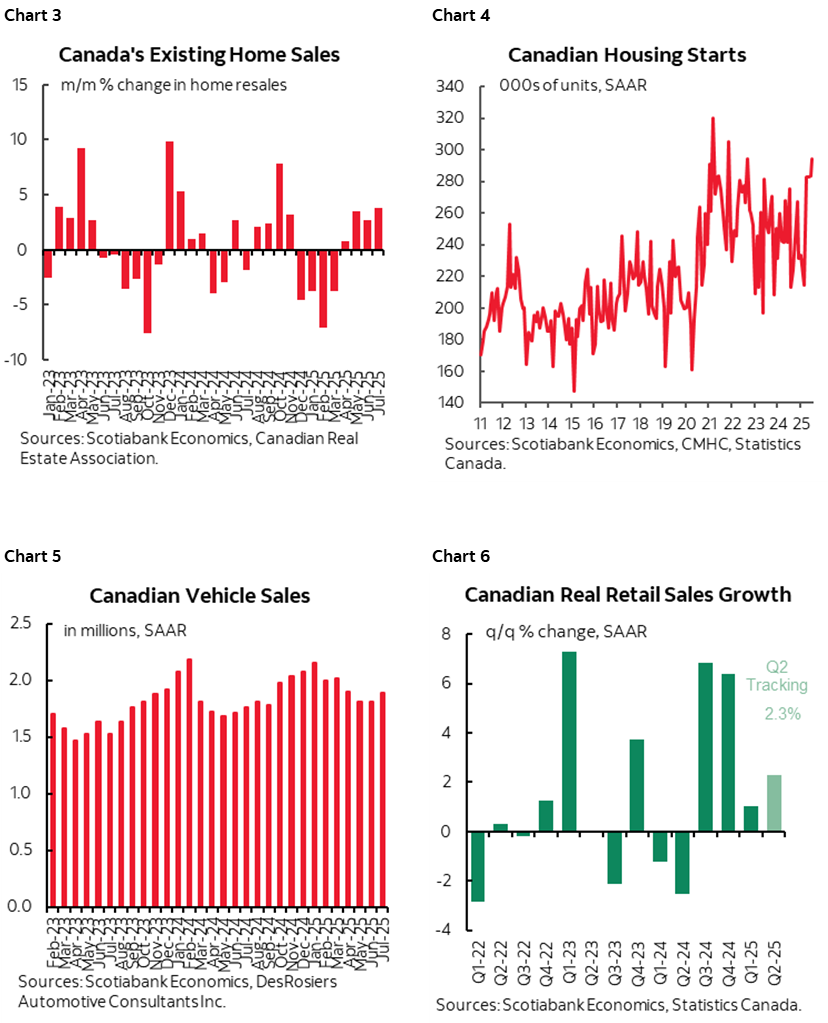
On that note, we are beginning to see the effects in a way that illustrates how monetary policy may be exerting its influence. Interest-sensitive sectors are on the rise, signalling that they don’t need further help and that further easing could overheat them. Housing starts and home sales have been very strong over recent months (charts 3, 4). Auto sales have been fairly resilient and picked up in July (chart 5). Someone is clearly buying big ticket items! Lenders appear very willing to finance it all. Retail sales volumes have picked up with Q2 tracking around 2.3% q/q SAAR and June likely setting up a running head start into Q3 (chart 6). There are yeah—but arguments in all of these cases, but respect the data before you—the gloom that dominates so much that is written these days is being defied by the data that most closely aligns with the impact of monetary policy. For the BoC, unless we’re going back to the Poloz era that inflamed housing imbalances, then it has to be very careful about overstimulating rate sensitives in the futile quest to save sectors most directly affected by tariffs. The latter should be left to fiscal policy with most of the tariff effect outside of a select few sectors being pretty small and accommodated by renewed currency weakening over recent weeks.
In any event, slack is likely small. It was estimated in the July MPR at -0.4% in Q1. Tracking of Q2 GDP suggests it may have risen somewhat, but perhaps not as much as the BoC estimated which runs counter to the risk they may be getting more slack than envisaged. Their July MPR had Q2 GDP growth at -1.5% q/q SAAR and it may prove to be too low. Further, Q3 GDP is getting a running head start based on recent data; if June lands as I expect next week, then it could mean a hand off effect that bakes in 1% q/q SAAR GDP growth in Q3 before we even consider Q3 data. And the supply side part of the gap calculation is probably also getting dinged (eg. tighter immigration, weakened confidence to invest etc).
Now, what about the poor Canadian consumer? Not so poor, in a nutshell.
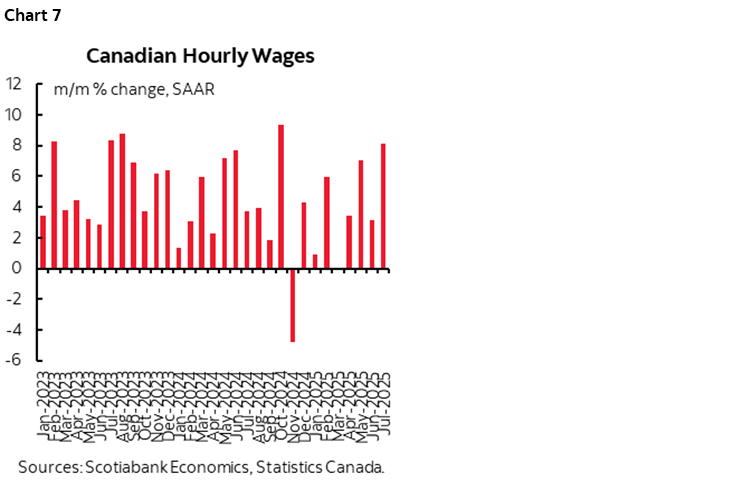
Wages are hot, hot, hot. They were up 8.1% m/m SAAR in July, 3.2% in June, 7.1% in May (chart 7). Contract settlements are off the charts and see yesterday’s morning note (here) for more on the wage settlements being secured in contract negotiations. We’ll get a dump of such data next week.
Productivity is not, not, not. Labour productivity has fallen outright in 15 of the past 19 quarters (chart 8). Because pay has generally been exceeding productivity, unit labour costs (productivity-adjusted total employment costs) have been rising sharply for years and pending Q2 figures after we get GDP (chart 9). Good one, eh?! This country isn't helping its competitiveness issues one bit with or without Trump’s hindrances. The country’s workers and businesses are so busy pointing the finger to government expecting solutions while their behaviour is worsening the nation’s competitiveness.
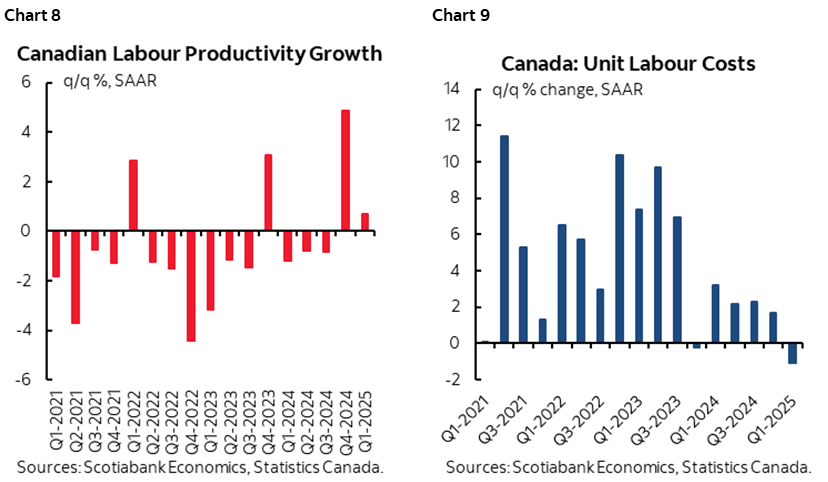
Hot wages + poor productivity = more inflation risk but also more resilient consumers until Canada truly becomes uncompetitive.
So, with dear readers naturally excluded, the argument that remains intact is that Canadians on balance are getting massive pay gains that they don't deserve. Where’s this point being made in the popular press that lauds massive pay hikes and lends highly sympathetic ears to the plight of the poor working stiff? Umm, nowhere. Not even in the business and markets press.
DISCLAIMER
This report has been prepared by Scotiabank Economics as a resource for the clients of Scotiabank. Opinions, estimates and projections contained herein are our own as of the date hereof and are subject to change without notice. The information and opinions contained herein have been compiled or arrived at from sources believed reliable but no representation or warranty, express or implied, is made as to their accuracy or completeness. Neither Scotiabank nor any of its officers, directors, partners, employees or affiliates accepts any liability whatsoever for any direct or consequential loss arising from any use of this report or its contents.
These reports are provided to you for informational purposes only. This report is not, and is not constructed as, an offer to sell or solicitation of any offer to buy any financial instrument, nor shall this report be construed as an opinion as to whether you should enter into any swap or trading strategy involving a swap or any other transaction. The information contained in this report is not intended to be, and does not constitute, a recommendation of a swap or trading strategy involving a swap within the meaning of U.S. Commodity Futures Trading Commission Regulation 23.434 and Appendix A thereto. This material is not intended to be individually tailored to your needs or characteristics and should not be viewed as a “call to action” or suggestion that you enter into a swap or trading strategy involving a swap or any other transaction. Scotiabank may engage in transactions in a manner inconsistent with the views discussed this report and may have positions, or be in the process of acquiring or disposing of positions, referred to in this report.
Scotiabank, its affiliates and any of their respective officers, directors and employees may from time to time take positions in currencies, act as managers, co-managers or underwriters of a public offering or act as principals or agents, deal in, own or act as market makers or advisors, brokers or commercial and/or investment bankers in relation to securities or related derivatives. As a result of these actions, Scotiabank may receive remuneration. All Scotiabank products and services are subject to the terms of applicable agreements and local regulations. Officers, directors and employees of Scotiabank and its affiliates may serve as directors of corporations.
Any securities discussed in this report may not be suitable for all investors. Scotiabank recommends that investors independently evaluate any issuer and security discussed in this report, and consult with any advisors they deem necessary prior to making any investment.
This report and all information, opinions and conclusions contained in it are protected by copyright. This information may not be reproduced without the prior express written consent of Scotiabank.
™ Trademark of The Bank of Nova Scotia. Used under license, where applicable.
Scotiabank, together with “Global Banking and Markets”, is a marketing name for the global corporate and investment banking and capital markets businesses of The Bank of Nova Scotia and certain of its affiliates in the countries where they operate, including; Scotiabank Europe plc; Scotiabank (Ireland) Designated Activity Company; Scotiabank Inverlat S.A., Institución de Banca Múltiple, Grupo Financiero Scotiabank Inverlat, Scotia Inverlat Casa de Bolsa, S.A. de C.V., Grupo Financiero Scotiabank Inverlat, Scotia Inverlat Derivados S.A. de C.V. – all members of the Scotiabank group and authorized users of the Scotiabank mark. The Bank of Nova Scotia is incorporated in Canada with limited liability and is authorised and regulated by the Office of the Superintendent of Financial Institutions Canada. The Bank of Nova Scotia is authorized by the UK Prudential Regulation Authority and is subject to regulation by the UK Financial Conduct Authority and limited regulation by the UK Prudential Regulation Authority. Details about the extent of The Bank of Nova Scotia's regulation by the UK Prudential Regulation Authority are available from us on request. Scotiabank Europe plc is authorized by the UK Prudential Regulation Authority and regulated by the UK Financial Conduct Authority and the UK Prudential Regulation Authority.
Scotiabank Inverlat, S.A., Scotia Inverlat Casa de Bolsa, S.A. de C.V, Grupo Financiero Scotiabank Inverlat, and Scotia Inverlat Derivados, S.A. de C.V., are each authorized and regulated by the Mexican financial authorities.
Not all products and services are offered in all jurisdictions. Services described are available in jurisdictions where permitted by law.