ON DECK FOR FRIDAY, AUGUST 1
KEY POINTS:
- Trump drives global equities lower
- Trump’s tariffs are a 15% tax on American shareholders, businesses and consumers
- Canada’s effective tariff rate is not 35%, remains at 4.6%...
- …which is a manageable hit that is far lower than other countries
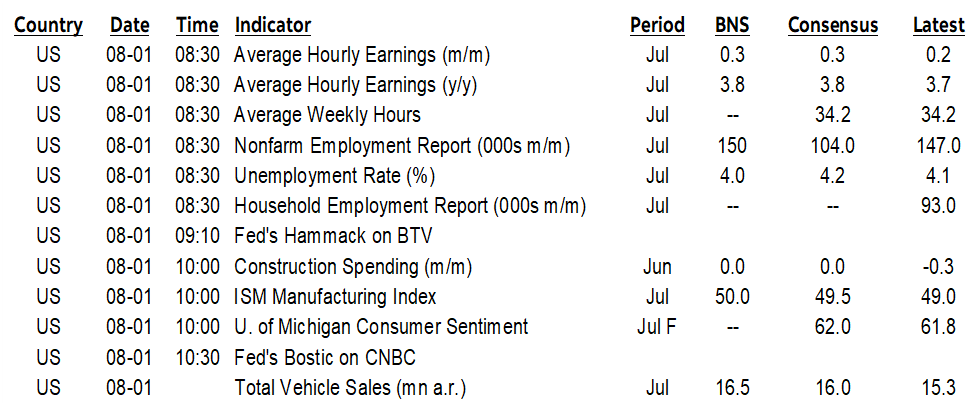
- Nonfarm payrolls on tap…
- …but it’s unlikely to settle much of anything for the Fed
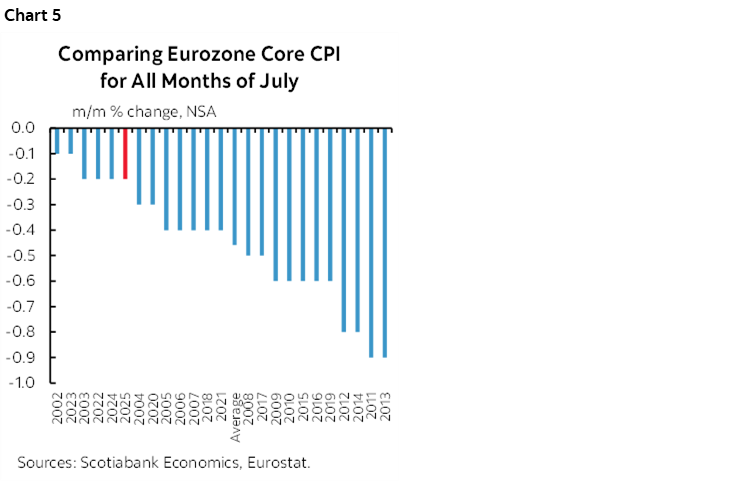
- Eurozone core CPI was warm again
- ISM-manufacturing to follow
- Limited Fed-reactions to follow
Trump is driving global stocks lower this morning. His tariff broadside last night combined with apprehension ahead of nonfarm payrolls explain the approximately 1% drop in US and Canadian equity futures, declines of ½% to over 2% across European cash markets and the declines in overnight Asian equities ranging from about ¾% for the Nikkei to 1% for the Hang Seng and Sensex and about 4% in South Korea. The dollar is broadly firmer along with the yen while CAD is holding its own as markets seek safe havens except for CHF after Switzerland was slammed with a 39% tariff. Sovereign yields are slightly higher toward the longer ends of global curves.
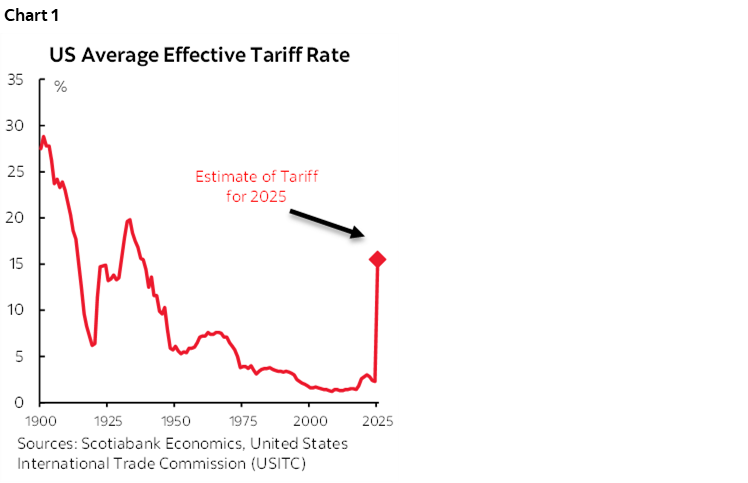
THE US IS HARMING ITSELF
What the US is doing to itself is the stupid thing about all of this. We figure that its effective tariff rate on America’s own imports now stands at 15.5% for just goods and 12.7% for goods and services imports. Chart 1 shows this tariff rate in the historical context. It used to be basically zero. The effective tariff rate applied by everyone else on America’s exports was already close to nothing and remains at 0.8% on total goods and services exports and 1.2% on just goods exports.
Thus, America has imposed a twisted negative shock to its own terms of trade that raise taxes on all Americans to fund income tax cuts for a few and that it can’t afford. The complicated pass through effects will be deleterious to American living standards over time in exchange for immaterial improvements in market access abroad and fake investment ‘deals’.
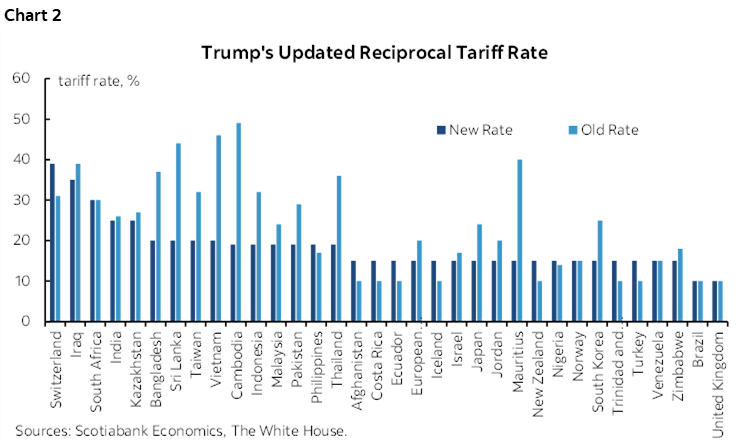
TRUMP’S TARIFF ASSAULT CHANGES LITTLE FOR CANADA, MORE FOR OTHERS
Other countries took last night’s announcements on US tariffs harder (chart 2) than Canada did with Trump’s announcement that was riddled with the usual lies about Canada. We had already factored in a 35% tariff on non-CUSMA/USMCA-compliant goods into our calculations for the effective tariff rate (ETR) on Canadian exports on the assumption that a deal would not yet be reached. Because of the exemption that the administration verified last night and because we’ve long argued that most exports are already CUSMA-compliant, Canada’s ETR remains at 4.6% on total goods and services exports to the world and 6.3% on total goods and services exports to the US. That’s marginally higher than pre-August 1st (chart 3) but not relative to what we and markets had largely assumed before last evening. This includes all tariffs announced to date. Estimates vary, but the assumed CUSMA-compliant share of Canadian trade is around 90% with some cautions (chart 4). Mexico’s compliance factor is lower.
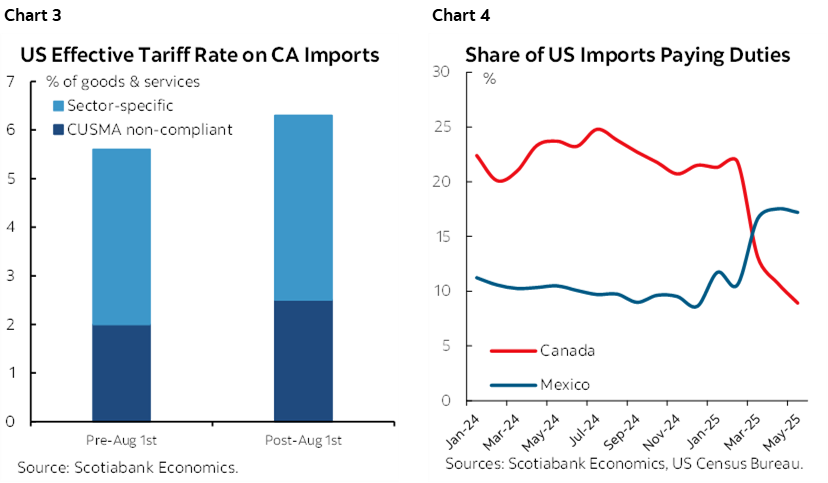
Furthermore, as chart 3 also showed, most of the tariff hit to Canada has nothing to do with the 35% rate on non-compliant trade. It’s driven by sector specific tariffs like on metals. That’s a fiscal policy matter for Canada to address in providing targeted assistance and support, not a broad monetary policy matter in my view.
As we’ve explained all along, this is all unwelcome to Canada, but not debilitating. This is why the C$ is not reacting in any particularly harsh way thus far and relative to other crosses.
NONFARM PAYROLLS
The next big show will be nonfarm payrolls (8:30amET). Considering that the 90% confidence interval around payroll changes is +/-130k, there isn’t that much difference between estimates within consensus. Estimates range from 0k to +170k with a median estimate of 104k and I’m at 150k and for now still ranked #1. Most estimates fall between 75–150k.
See my weekly here for reasons.
Not much rides on this one payrolls report. There will be another in early September before the next FOMC decision on September 17th. There will be multiple inflation readings, lots of other data, and no doubt a lot of volatility in other US policies.
Also watch ISM-manufacturing (10amET) and reactions from a few FOMC officials (Hammack 9:10amET, Bostic 10:30amET).
EUROZONE CORE CPI WAS WARM AGAIN
Eurozone core CPI was relatively warm again. July’s -0.2% m/m seasonally unadjusted reading is among the weakest declines on record comparing like months of July over time since it’s not adjusted (chart 5). The June core reading of 0.4% was likewise among the strongest readings in history comparing like months of June over time. The effect was to keep the year-over-year rate unchanged at 2.3% and the headline rate unchanged at 2% y/y. Evidence of price pressures has to be evaluated at the margin using m/m and this morning’s figures are a caution to the ECB.
DISCLAIMER
This report has been prepared by Scotiabank Economics as a resource for the clients of Scotiabank. Opinions, estimates and projections contained herein are our own as of the date hereof and are subject to change without notice. The information and opinions contained herein have been compiled or arrived at from sources believed reliable but no representation or warranty, express or implied, is made as to their accuracy or completeness. Neither Scotiabank nor any of its officers, directors, partners, employees or affiliates accepts any liability whatsoever for any direct or consequential loss arising from any use of this report or its contents.
These reports are provided to you for informational purposes only. This report is not, and is not constructed as, an offer to sell or solicitation of any offer to buy any financial instrument, nor shall this report be construed as an opinion as to whether you should enter into any swap or trading strategy involving a swap or any other transaction. The information contained in this report is not intended to be, and does not constitute, a recommendation of a swap or trading strategy involving a swap within the meaning of U.S. Commodity Futures Trading Commission Regulation 23.434 and Appendix A thereto. This material is not intended to be individually tailored to your needs or characteristics and should not be viewed as a “call to action” or suggestion that you enter into a swap or trading strategy involving a swap or any other transaction. Scotiabank may engage in transactions in a manner inconsistent with the views discussed this report and may have positions, or be in the process of acquiring or disposing of positions, referred to in this report.
Scotiabank, its affiliates and any of their respective officers, directors and employees may from time to time take positions in currencies, act as managers, co-managers or underwriters of a public offering or act as principals or agents, deal in, own or act as market makers or advisors, brokers or commercial and/or investment bankers in relation to securities or related derivatives. As a result of these actions, Scotiabank may receive remuneration. All Scotiabank products and services are subject to the terms of applicable agreements and local regulations. Officers, directors and employees of Scotiabank and its affiliates may serve as directors of corporations.
Any securities discussed in this report may not be suitable for all investors. Scotiabank recommends that investors independently evaluate any issuer and security discussed in this report, and consult with any advisors they deem necessary prior to making any investment.
This report and all information, opinions and conclusions contained in it are protected by copyright. This information may not be reproduced without the prior express written consent of Scotiabank.
™ Trademark of The Bank of Nova Scotia. Used under license, where applicable.
Scotiabank, together with “Global Banking and Markets”, is a marketing name for the global corporate and investment banking and capital markets businesses of The Bank of Nova Scotia and certain of its affiliates in the countries where they operate, including; Scotiabank Europe plc; Scotiabank (Ireland) Designated Activity Company; Scotiabank Inverlat S.A., Institución de Banca Múltiple, Grupo Financiero Scotiabank Inverlat, Scotia Inverlat Casa de Bolsa, S.A. de C.V., Grupo Financiero Scotiabank Inverlat, Scotia Inverlat Derivados S.A. de C.V. – all members of the Scotiabank group and authorized users of the Scotiabank mark. The Bank of Nova Scotia is incorporated in Canada with limited liability and is authorised and regulated by the Office of the Superintendent of Financial Institutions Canada. The Bank of Nova Scotia is authorized by the UK Prudential Regulation Authority and is subject to regulation by the UK Financial Conduct Authority and limited regulation by the UK Prudential Regulation Authority. Details about the extent of The Bank of Nova Scotia's regulation by the UK Prudential Regulation Authority are available from us on request. Scotiabank Europe plc is authorized by the UK Prudential Regulation Authority and regulated by the UK Financial Conduct Authority and the UK Prudential Regulation Authority.
Scotiabank Inverlat, S.A., Scotia Inverlat Casa de Bolsa, S.A. de C.V, Grupo Financiero Scotiabank Inverlat, and Scotia Inverlat Derivados, S.A. de C.V., are each authorized and regulated by the Mexican financial authorities.
Not all products and services are offered in all jurisdictions. Services described are available in jurisdictions where permitted by law.