| ON DECK FOR FRIDAY, MAY 31 |
KEY POINTS:
- Markets are playing defence into the N.A. market open
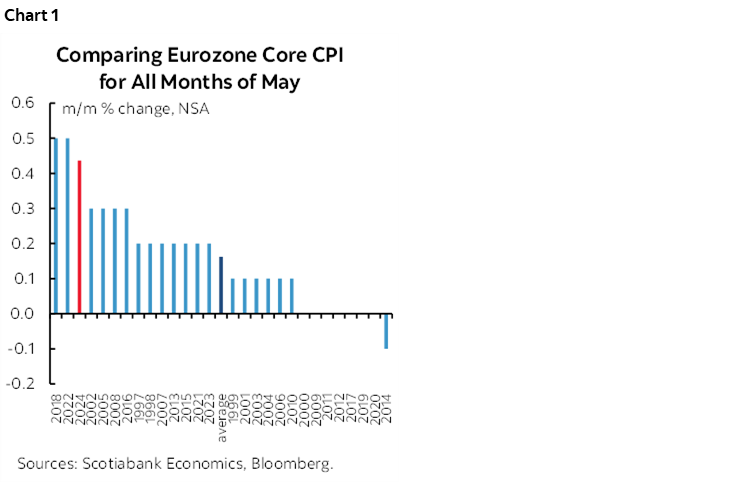
- Eurozone core CPI was the third hottest May on record…
- ...extending the year-long pattern of out-sized gains…
- ...questioning the rush to cut , but at least informing a cautious path thereafter
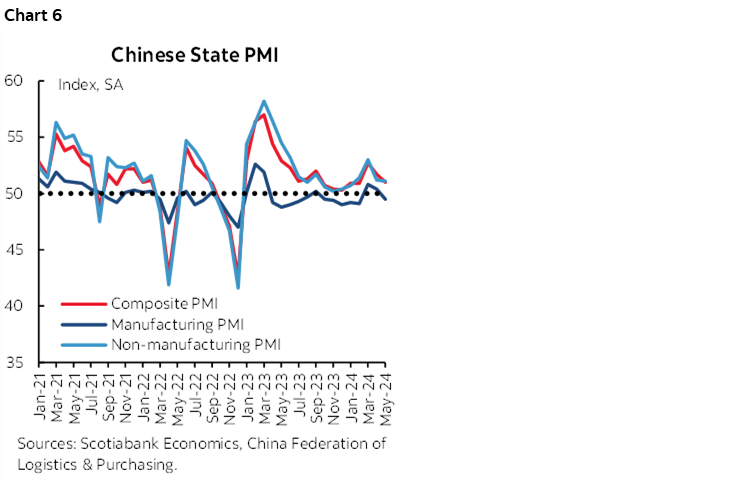
- Chinese state PMIs disappointed
- US core PCE: a small difference could yield big effects on September Fed pricing
- Canadian GDP probably won’t conform to Macklem’s earlier peak pain thesis
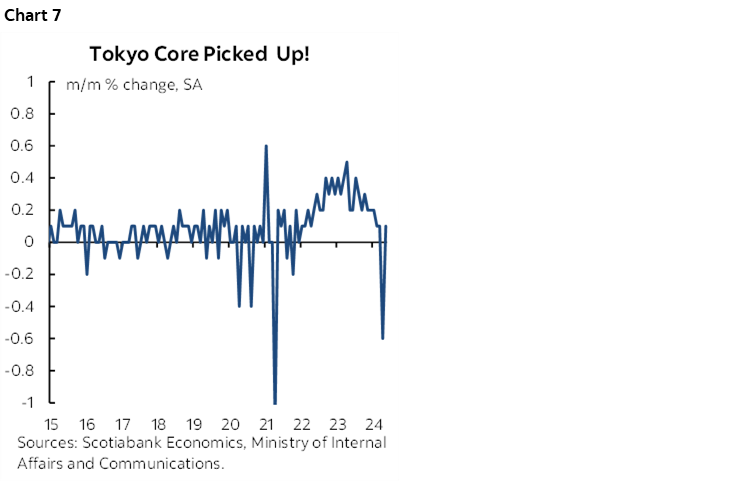
- Yen weakens on mixed data dump including soft rebound in Tokyo core CPI
- Markets are ignoring Trump’s 34 convictions
How Friday is starting may or may not be how it ends. So far, it’s not so pretty, but a lot of data and uncertain month-end effects are still ahead.
Bonds and stocks are cheaper. The main drivers are an upside surprise to Eurozone core CPI and apprehension ahead of US core PCE while Canadian markets will also face a slew of GDP figures. Markets don’t care that Trump is a felon this morning, perhaps because there remains a long road ahead to November 5th.
Eurozone Core CPI Extends Its Hot Streak
Eurozone core CPI was hotter than expected and that is driving sovereign bond yields higher with EGBs underperforming other global benchmarks so far this morning. Some of that cheapening – including in US Ts – began to unfold after French figures surprised higher a few hours before the Eurozone tally.
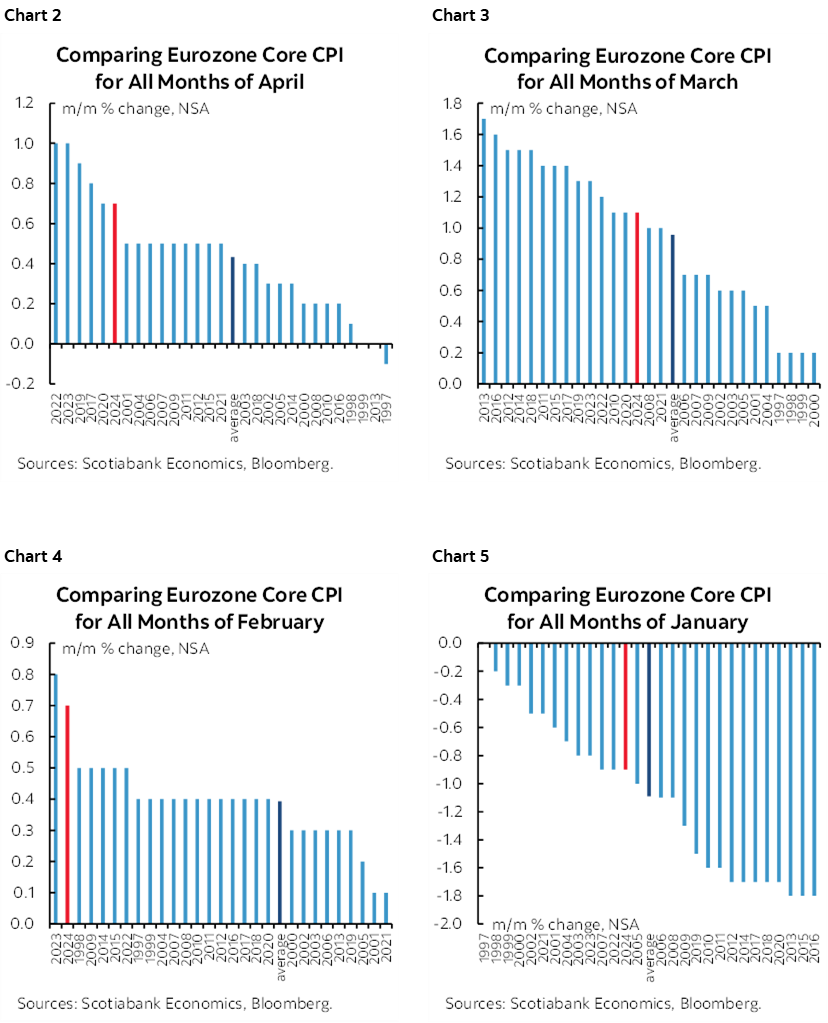
The key, however, is that Eurozone core CPI was up by 0.44% m/m NSA which drove the year-over-year rate higher to 2.9% (2.7% prior and consensus). Since the m/m figure is seasonally unadjusted (NSA) we want to compare like months of May in history. This May was the third hottest on record and only marginally behind a pair of 0.5% prints in 2018 and 2022 (chart 1). That extends the pattern that has been in place very single month this year during which each month compared to like months in history has been hotter than seasonally normal (charts 2–5).
So, the takeaway is that core inflation in the Eurozone has not gone away. In my opinion, they shouldn’t be cutting yet, but seem determined to do so. This could be added to the ECB’s history of bad moves. My principle all along has been that you should be patient so that when you get to delivering cuts you can do it in a consistent, determined and sustainable way. What these prints do is to lessen the prospect for a subsequent cut any time soon. July is priced for a hold after next week and September’s pricing was shaved a few points to about a two-thirds probability of another cut at that meeting.
Eurozone markets ignored German retail sales as volumes fell by -1.2% m/m in April (-0.3% consensus). It was ignored partly because CPI dominated, but also because the miss was mostly due to an upward revision to the prior month (now +2.6% from 1.8%).
China’s Economy Softened in May
China’s state purchasing managers’ indices surprised lower for the month of May (chart 6). That’s not a great signal in terms of the health of China’s economy especially since we’re distant from the time of year when excuses can be made for surprises in either direction due to the Lunar New Year’s multi-month effects. The composite PMI slipped seven-tenths to 51, and so being barely above 50 that signals slow growth. The non-manufacturing PMI held steady (51.1 from 51.2) but the manufacturing PMI slipped into contraction (49.5, 50.4 prior). China is vulnerable to slowing economies abroad—namely the US and Eurozone—and a lack of friends in high places when it comes to trade policy.
Yen Slips on Mixed Data Dump
The yen softened a little further overnight but largely ignored a wave of Japanese data. Key was Tokyo core CPI that arrives well before the national reading. It rebounded a little to 0.1% m/m SA from the prior month’s -0.6% m/m SA drop that had been driven by the Tokyo government’s decision to eliminate high school fees (chart 7). Other releases were mixed as industrial output disappointed (-0.1% m/m, +1.5% consensus) but retail sales soared (+1.2% m/m, 0.6% consensus).
US Core PCE Could Impact September Fed Funds Pricing
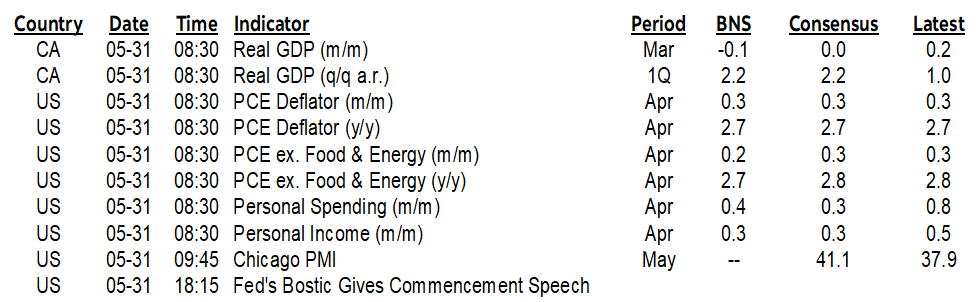
Into the North American session will be two dueling Canadian and US releases at the same time that could cloud the market’s interpretation of the Canadian data.
On core PCE (8:30amET), about half of consensus stands at 0.3% and the other half is at 0.2%. I went with 0.3%. 0.3% would reduce pricing for a September cut, 0.2% would at least reinforce it.
The US also releases spending and income figures for April that are expected to post a pair of 0.3% m/m SA prints.
Canadian GDP May be Doing Much Better than the BoC Feared
As for Canadian GDP (8:30amET), market reaction may be mixed up with the simultaneous release of US PCE. I expect constructive figures. Most have low two-handled Q1 GDP growth with a couple of outliers in the high-1s. Decent scenarios range anywhere from the high 1s to 3 imo.
March GDP is likely to be soft based on advance guidance that it was ‘essentially unchanged’ and monthly readings since then.
It would be a surprise, however, if April GDP did not turn up a strong print given considerations such as the strong 0.8% m/m jump in hours worked. If all that goes tickety boo, then the economy is in a lot better shape than the BoC was assuming coming into the start of the year only to get upside surprises for three quarters in a row from 2023Q4 through 24Q2. In that case, what’s the dang rush to cut? Four months of soft core inflation after blowing inflation management for four years isn’t enough in my books.
DISCLAIMER
This report has been prepared by Scotiabank Economics as a resource for the clients of Scotiabank. Opinions, estimates and projections contained herein are our own as of the date hereof and are subject to change without notice. The information and opinions contained herein have been compiled or arrived at from sources believed reliable but no representation or warranty, express or implied, is made as to their accuracy or completeness. Neither Scotiabank nor any of its officers, directors, partners, employees or affiliates accepts any liability whatsoever for any direct or consequential loss arising from any use of this report or its contents.
These reports are provided to you for informational purposes only. This report is not, and is not constructed as, an offer to sell or solicitation of any offer to buy any financial instrument, nor shall this report be construed as an opinion as to whether you should enter into any swap or trading strategy involving a swap or any other transaction. The information contained in this report is not intended to be, and does not constitute, a recommendation of a swap or trading strategy involving a swap within the meaning of U.S. Commodity Futures Trading Commission Regulation 23.434 and Appendix A thereto. This material is not intended to be individually tailored to your needs or characteristics and should not be viewed as a “call to action” or suggestion that you enter into a swap or trading strategy involving a swap or any other transaction. Scotiabank may engage in transactions in a manner inconsistent with the views discussed this report and may have positions, or be in the process of acquiring or disposing of positions, referred to in this report.
Scotiabank, its affiliates and any of their respective officers, directors and employees may from time to time take positions in currencies, act as managers, co-managers or underwriters of a public offering or act as principals or agents, deal in, own or act as market makers or advisors, brokers or commercial and/or investment bankers in relation to securities or related derivatives. As a result of these actions, Scotiabank may receive remuneration. All Scotiabank products and services are subject to the terms of applicable agreements and local regulations. Officers, directors and employees of Scotiabank and its affiliates may serve as directors of corporations.
Any securities discussed in this report may not be suitable for all investors. Scotiabank recommends that investors independently evaluate any issuer and security discussed in this report, and consult with any advisors they deem necessary prior to making any investment.
This report and all information, opinions and conclusions contained in it are protected by copyright. This information may not be reproduced without the prior express written consent of Scotiabank.
™ Trademark of The Bank of Nova Scotia. Used under license, where applicable.
Scotiabank, together with “Global Banking and Markets”, is a marketing name for the global corporate and investment banking and capital markets businesses of The Bank of Nova Scotia and certain of its affiliates in the countries where they operate, including; Scotiabank Europe plc; Scotiabank (Ireland) Designated Activity Company; Scotiabank Inverlat S.A., Institución de Banca Múltiple, Grupo Financiero Scotiabank Inverlat, Scotia Inverlat Casa de Bolsa, S.A. de C.V., Grupo Financiero Scotiabank Inverlat, Scotia Inverlat Derivados S.A. de C.V. – all members of the Scotiabank group and authorized users of the Scotiabank mark. The Bank of Nova Scotia is incorporated in Canada with limited liability and is authorised and regulated by the Office of the Superintendent of Financial Institutions Canada. The Bank of Nova Scotia is authorized by the UK Prudential Regulation Authority and is subject to regulation by the UK Financial Conduct Authority and limited regulation by the UK Prudential Regulation Authority. Details about the extent of The Bank of Nova Scotia's regulation by the UK Prudential Regulation Authority are available from us on request. Scotiabank Europe plc is authorized by the UK Prudential Regulation Authority and regulated by the UK Financial Conduct Authority and the UK Prudential Regulation Authority.
Scotiabank Inverlat, S.A., Scotia Inverlat Casa de Bolsa, S.A. de C.V, Grupo Financiero Scotiabank Inverlat, and Scotia Inverlat Derivados, S.A. de C.V., are each authorized and regulated by the Mexican financial authorities.
Not all products and services are offered in all jurisdictions. Services described are available in jurisdictions where permitted by law.