| ON DECK FOR FRIDAY, MARCH 8 |
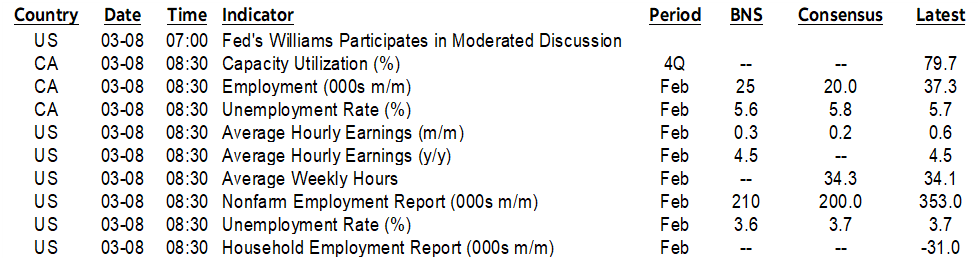
KEY POINTS:
- Markets brace for US, Canadian jobs and wages
- Will nonfarm payrolls continue to destroy Powell’s rebalancing narrative?
- Nonfarm might play second fiddle to wages
- Canadian wages, the BoC and M. Night Shyamalan may have something in common
- The BoJ rumour mill keeps driving yen strength
- Peru’s central bank surprised almost everyone
Welcome to Jobs Friday in North America. There are other considerations worth flagging afterward, but let’s get right to the top of mind issues into the N.A. market open.
CANADIAN JOBS PREVIEW—ON WAGE WATCH
The Bank of Canada claimed in this week’s communications that there were ‘signs’ that wage growth may be ebbing. It’s unclear how rich the evidence is to back up this claim. Do you mean ‘signs’ as in data? Or signs, like mysterious crop circles in Mel Gibson’s movie of the same name?? Ooooh the intrigue. It’s like M. Night Shyamalan wrote the bloody BoC statement!
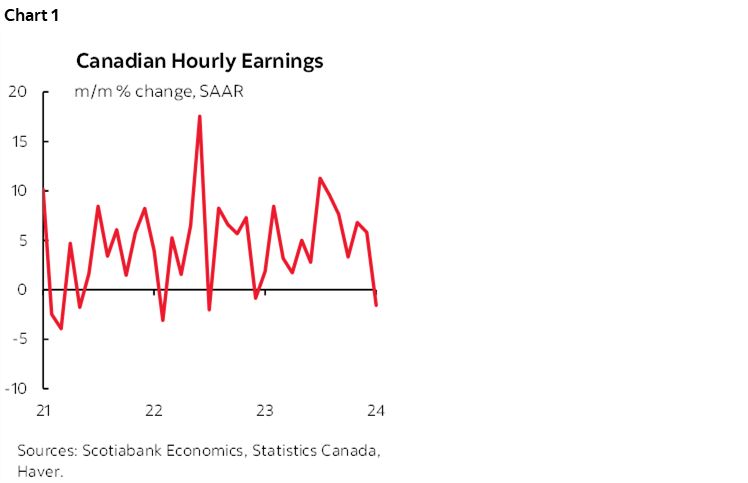
We’re about to find out a bit more evidence when February’s wage figures arrive. January’s average hourly earnings fell by 1.6% m/m SAAR for the first drop since December 2022. Monthly dips along a strong trend are not unusual (chart 1). Overreacting to them is. Especially when collective bargaining exercises are driving explosive wage gains that will filter through the data for years to come. Especially when any wage gain is inflationary when not justified by tumbling labour productivity.
Here's a preview of the expectations for today numbers (8:30amET). One thing is for certain – Canada’s job market is hardly slowing in my opinion. 37k jobs were created in January. 480k jobs have been created since the end of 2022. Half a million folks. Half a million folks who are among the folks looking to buy a home, a car, and sundry other things upon which to spend their good fortune.
Let’s see what happened in February without overreacting no matter what happens given the high degree of statistical noise. Here are the expectations.
- Consensus median: 20k
- Consensus mean: 24k (slight skewness higher)
- Scotia: 25k
- Range: 5k – 77k (most are within 5–25k)
- Std Dev: 17.2k
- 95% C.I.: 57k
- UR: 5.8% from 5.7% (Scotia 5.6%)
Rationale:
- Strong immigration is probably still filling vacancies that have fallen back to pre-pandemic levels but are still high enough for job growth.
- Tracking of a GDP rebound into Q1 tends to be correlated with employment gains.
- High frequency alt-data on business conditions may suggest a significant job gain. This is based upon mobility data, business openings and closings etc and the Statcan business conditions index is tracking very strongly into the new year.
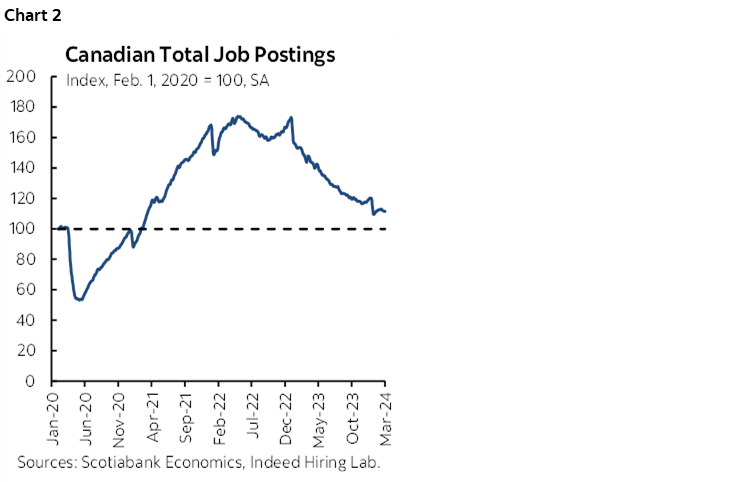
- Job postings have been ebbing but remain solid (chart 2).
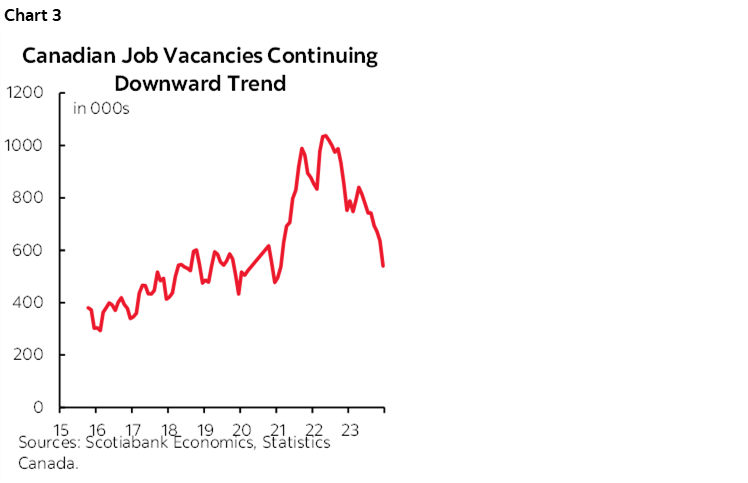
- Ditto for job vacancies (chart 3).
- Watch wages. Average hourly wages slipped by 1.6% m/m SAAR in January and may rebound. We’ve seen slips before, only for a strong trend to re-emerge. The smooth pattern is still strong at about triple the BoC’s 2% target on a 3-month moving average of the m/m SAAR basis.
US JOBS PREVIEW—WILL NONFARM CONTINUE TO DESTROY POWELL’S REBALANCING NARRATIVE?
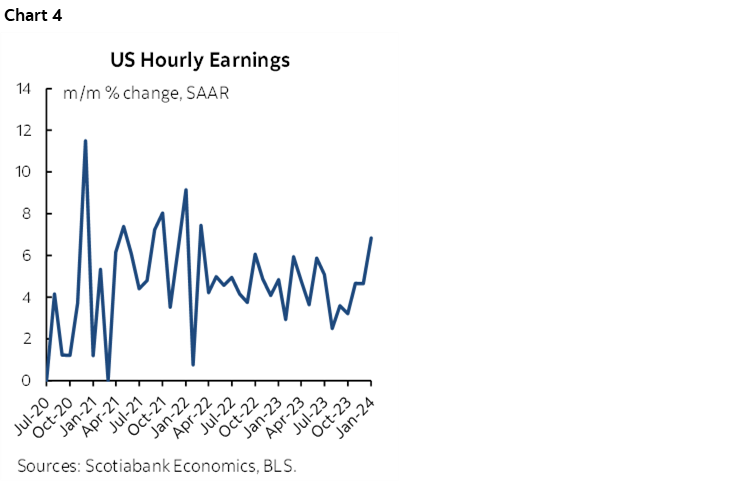
The last couple of months chucked Fed Chair Powell’s rebalancing narrative out the window (recall here). Nonfarm payrolls were up by 353k jobs in January and 333k in December. Revisions added 117k to raise December’s gain to that level and another smaller amount to November. Wage growth accelerated to 0.6% m/m SA or 6.8% m/m SAAR and wage growth has been on an upward trend over the past half year (chart 4). While some readings on the US labour market have been undeniably cooling, that has not been the case for the most important measures followed by the Federal Reserve.
Today’s update for February has to be taken in that context (8:30amET). This is not a weak or even weakening job market to date. It may well soften in future, but job growth can soften by a lot from this recent pace without sparking concern and without meriting policy easing at least in terms of the full employment part of the dual mandate.
Here are the expectations into the numbers.
- Consensus median: 200k
- Consensus mean: 197k (no material skewness)
- Scotia: 220k
- Range: 110 – 286k (most within 175–225k)
- Whisper number: 206
- Std Dev: 30k
- 90% C.I.: +/- 130k
- UR: 3.7% unchanged
Rationale:
- Most advance signals point to slower job growth, but nonfarm often doesn’t line up with them.
- Initial jobless claims were low and stable between reference periods.
- ISM-employment subindices point to softening job growth.
- The Consumer confidence jobs plentiful subindex pulled back a little in February after increasing in January.
- ADP private payrolls were up by +140k but they’ve been understating private nonfarm payrolls for a while and ADP tends to be an unreliable gauge over long periods of time.
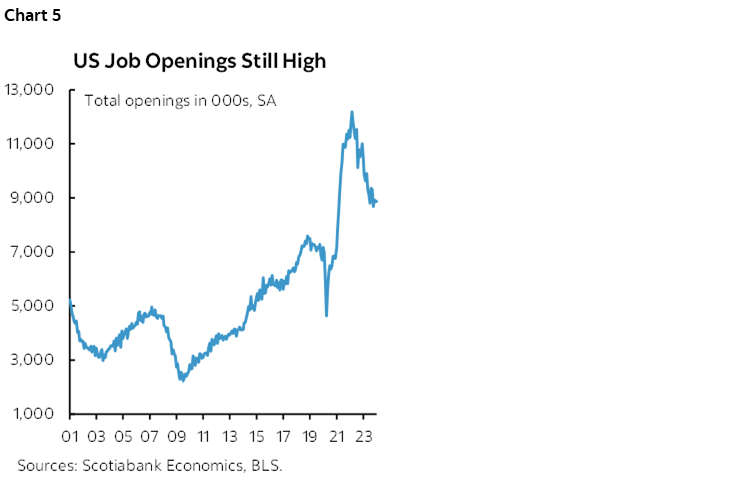
- JOLTS job vacancies pulled back a little in January but are still high (chart 5).
- NFIB measures for hiring plans and hard to fill vacancies both pulled back.
- Watch wages. The 0.6% m/m SA surge in January might be tough to repeat as it was the strongest gain since January 2022.
BoJ RUMOURS AND BCRP’S SURPRISE
There were a few developments overnight that are worth flagging. The yen appreciated again on a Reuters piece that cites ‘four sources familiar with its thinking’ that more BoJ policymakers are leaning toward ending negative rates at the March 18th–19th meeting. The piece nevertheless said “an imminent policy shift is hardly a done deal as there is no consensus within the nine-member board on whether to pull the trigger” that soon. Righto, start a rumour, quash a rumour all in one story.
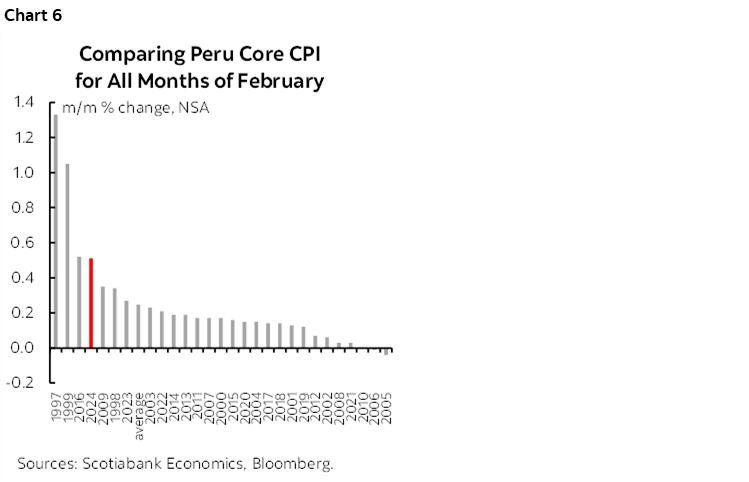
Peru’s central bank surprised markets by holding its policy reference rate unchanged at 6.25% against 12 out of 13 forecasters who expected a 25bps cut. Only one person got the call right. I guess the stronger than seasonally usual jump in core CPI during February rattled a few cages as it jumped by 0.5% m/m NSA which was unusually hot compared to like months in history (chart 6).
DISCLAIMER
This report has been prepared by Scotiabank Economics as a resource for the clients of Scotiabank. Opinions, estimates and projections contained herein are our own as of the date hereof and are subject to change without notice. The information and opinions contained herein have been compiled or arrived at from sources believed reliable but no representation or warranty, express or implied, is made as to their accuracy or completeness. Neither Scotiabank nor any of its officers, directors, partners, employees or affiliates accepts any liability whatsoever for any direct or consequential loss arising from any use of this report or its contents.
These reports are provided to you for informational purposes only. This report is not, and is not constructed as, an offer to sell or solicitation of any offer to buy any financial instrument, nor shall this report be construed as an opinion as to whether you should enter into any swap or trading strategy involving a swap or any other transaction. The information contained in this report is not intended to be, and does not constitute, a recommendation of a swap or trading strategy involving a swap within the meaning of U.S. Commodity Futures Trading Commission Regulation 23.434 and Appendix A thereto. This material is not intended to be individually tailored to your needs or characteristics and should not be viewed as a “call to action” or suggestion that you enter into a swap or trading strategy involving a swap or any other transaction. Scotiabank may engage in transactions in a manner inconsistent with the views discussed this report and may have positions, or be in the process of acquiring or disposing of positions, referred to in this report.
Scotiabank, its affiliates and any of their respective officers, directors and employees may from time to time take positions in currencies, act as managers, co-managers or underwriters of a public offering or act as principals or agents, deal in, own or act as market makers or advisors, brokers or commercial and/or investment bankers in relation to securities or related derivatives. As a result of these actions, Scotiabank may receive remuneration. All Scotiabank products and services are subject to the terms of applicable agreements and local regulations. Officers, directors and employees of Scotiabank and its affiliates may serve as directors of corporations.
Any securities discussed in this report may not be suitable for all investors. Scotiabank recommends that investors independently evaluate any issuer and security discussed in this report, and consult with any advisors they deem necessary prior to making any investment.
This report and all information, opinions and conclusions contained in it are protected by copyright. This information may not be reproduced without the prior express written consent of Scotiabank.
™ Trademark of The Bank of Nova Scotia. Used under license, where applicable.
Scotiabank, together with “Global Banking and Markets”, is a marketing name for the global corporate and investment banking and capital markets businesses of The Bank of Nova Scotia and certain of its affiliates in the countries where they operate, including; Scotiabank Europe plc; Scotiabank (Ireland) Designated Activity Company; Scotiabank Inverlat S.A., Institución de Banca Múltiple, Grupo Financiero Scotiabank Inverlat, Scotia Inverlat Casa de Bolsa, S.A. de C.V., Grupo Financiero Scotiabank Inverlat, Scotia Inverlat Derivados S.A. de C.V. – all members of the Scotiabank group and authorized users of the Scotiabank mark. The Bank of Nova Scotia is incorporated in Canada with limited liability and is authorised and regulated by the Office of the Superintendent of Financial Institutions Canada. The Bank of Nova Scotia is authorized by the UK Prudential Regulation Authority and is subject to regulation by the UK Financial Conduct Authority and limited regulation by the UK Prudential Regulation Authority. Details about the extent of The Bank of Nova Scotia's regulation by the UK Prudential Regulation Authority are available from us on request. Scotiabank Europe plc is authorized by the UK Prudential Regulation Authority and regulated by the UK Financial Conduct Authority and the UK Prudential Regulation Authority.
Scotiabank Inverlat, S.A., Scotia Inverlat Casa de Bolsa, S.A. de C.V, Grupo Financiero Scotiabank Inverlat, and Scotia Inverlat Derivados, S.A. de C.V., are each authorized and regulated by the Mexican financial authorities.
Not all products and services are offered in all jurisdictions. Services described are available in jurisdictions where permitted by law.