ON DECK FOR TUESDAY, JANUARY 16
KEY POINTS:
- Risk-off sentiment sweeps across asset classes
- Why markets are nervous toward a pending speech by the Fed’s Waller
- Gilts messed up their interpretation of UK wages
- US bank earnings continue
- CDN underlying inflation may further inform the sticky trend…
- …after the BoC’s surveys showed sticky and high inflation expectations...
- ...that along with evidence of changed labour market behaviour...
- ...signal they’re still behind the eight-ball
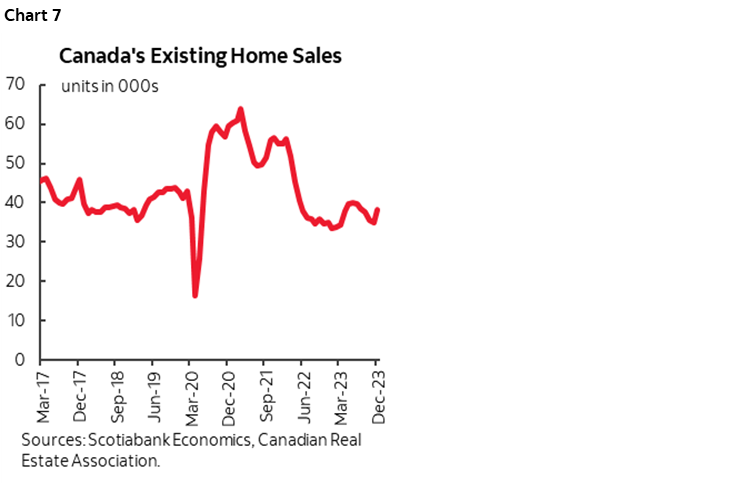
- CDN home sales are merely normalizing between spring seasons
- Data showed that Canadian shocks eased but still persisted into year-end
Risk-off sentiment is marked by equities that are down by ½% to ¾% across the main N.A. futures and European cash benchmarks after Asian equities broadly fell by as much as 2% in HK. The dollar is significantly stronger against all major crosses. US Ts are cheaper by about 6-7bps across the curve as Americans return from a day off Canada’s curve is also 4-5bps cheaper. I don’t agree with how outperforming UK markets interpreted their labour market readings ahead of US bank earnings, a potentially key Fed speech and Canadian CPI. ECB-speak from yesterday continues to contribute to the feel that markets are overly aggressive in pricing cuts.
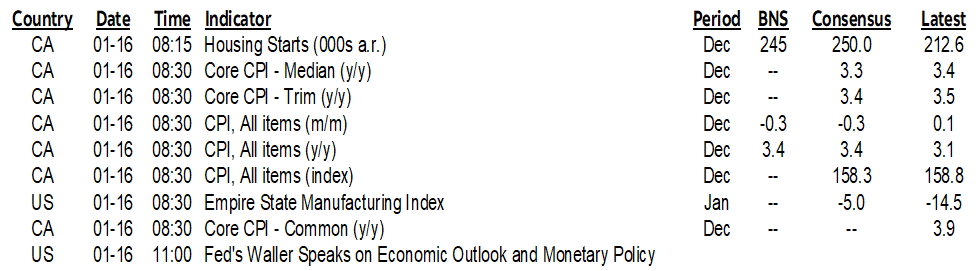
UK wage growth sharply accelerated in November yet the gilts front-end rallied on the data. It’s not the year-over-year rate that one should ever pay attention to even though that’s what probably happened. That measure is too influenced by year-ago base effects. For evidence of pressures at the margin, it’s the year-over-year rate that jumped to 8% m/m SAAR that matters. That November reading—the hottest since May—suggests that the -5.6% reading in October was the anomaly relative to the trend (chart 1). In other words, wage pressures remain very much alive and well in the UK which is a threat to the BoE’s durable achievement of 2% inflation relative to what markets are pricing for cuts.
Other UK job market data was mixed. Payroll employment fell by 24k in December (-13k consensus) but the prior month was revised up by 21k to a gain of 9k which explains much of the miss in the latest reading. Jobless claims increased by 11.7k, but here too that follows a downward revision to the prior month from a previously reported 16k jump in jobless claims during November to flat.
US bank earnings returned thsi morning with a pair of key names—GS and Morgan Stanley.
Then Fed Governor Waller speaks on the outlook later this morning (11amET). Waller matters partly because back in November he was the one who contributed to March cut pricing when he said this:
“If inflation’s coming down, once you get inflation down low enough, you don’t necessarily have to keep rates up at those levels... if we see this inflation continuing for several more months — I don’t know how long that might be, three months, four months, five months — that we feel confident that inflation is really down and on its way, that you can then start lowering the policy rate just because inflation’s lower.”
If Waller repeats or leans against this view in his updated outlook then it could be impactful to Fed cut timing particularly given his prior reputation as a hawk and how aggressively markets are pricing Fed moves.
Canada updates CPI this morning in the wake of yesterday’s sticky inflation expectations (8:30amET). See the week ahead for more. My estimate is -0.3% m/m NSA which translates into about a +0.3% m/m SA rise after taking account of seasonal adjustments for December. -0.3% m/m NSA is the mode, median and mean within the consensus sample. -0.2% is the next most popular number, then -0.4% with a tail call for -0.5%. Base effects on their own should pop the year-over-year rate up to 3.7% from 3.1% previously. Factoring in expectations for the m/m change lowers that to 3.4%.
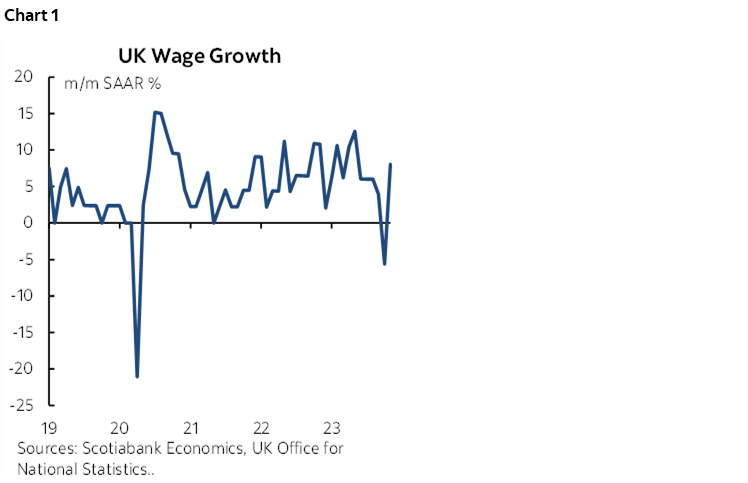
Key, however, will be the trimmed mean and weighted median gauges in m/m SAAR terms and they are largely impossible to estimate in advance given the high sensitivity to the many unknowns among the 55 CPI components that go into calculating them. They have been pretty volatile after rising at a 4-handled pace in July and August, dropping back down to the upper 1s and lower 2s during a soft patch in September and October, and then popping back up to 3½% in November (chart 2). December’s data could further inform the recent trend. Also bear in mind that the core measures can be subject to revisions.
Don’t trust the Bank of Canada’s spin on yesterday’s surveys. Their mission is to convince everyone that they have everything under control, that tightened monetary policy is working just fine and that additional evidence is unfolding in the direction of achieving their 2% inflation target. The Governor’s job is to convince Canadians on all of these counts so as to manage expectations. A street economist, by contrast, has to question everything including the central bank’s communications motives.
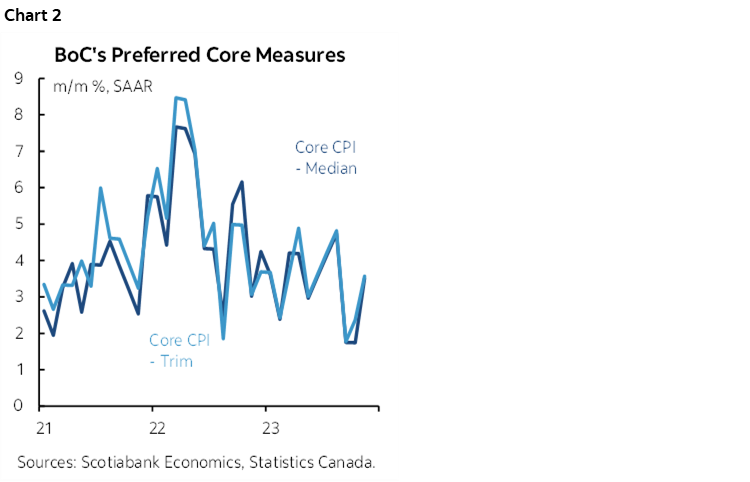
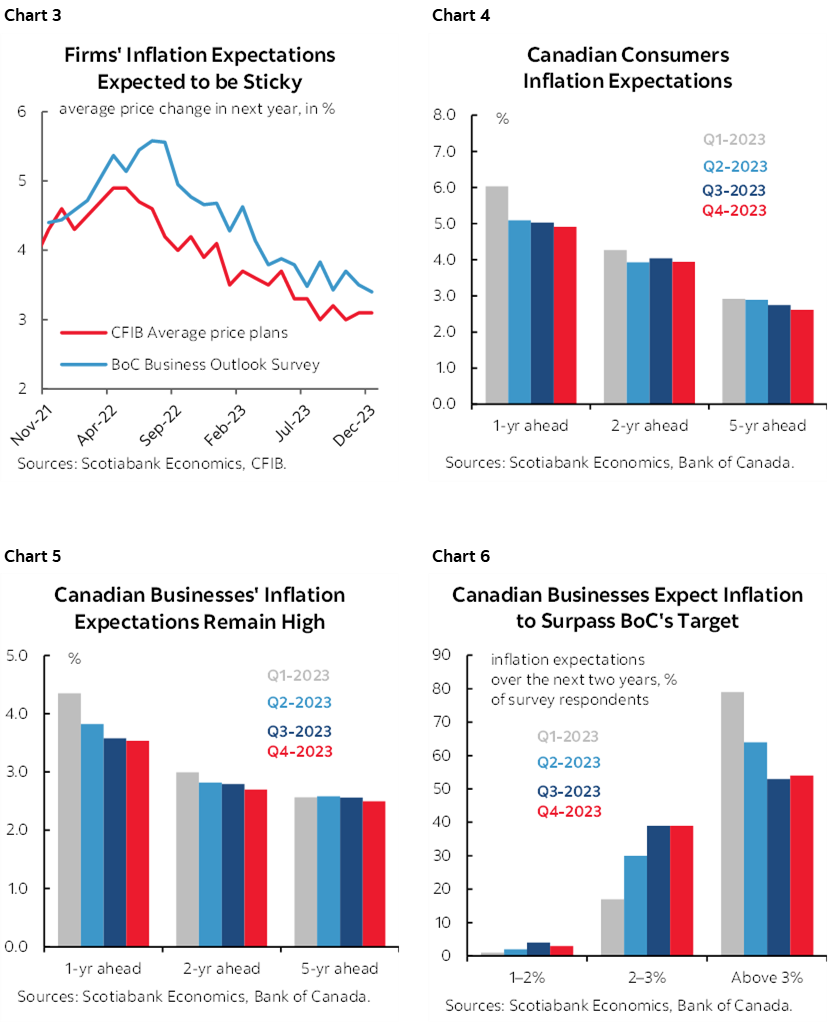
Enter how to read progress on inflation expectations. The BoC sounded more encouraged than justified by the data. Chart 3 shows that the 1-year ahead measure of business inflation expectations followed the timelier small business survey evidence from the CFIB. Also consider chart 4 that shows still very sticky consumers’ expectations for inflation; for a soft-data survey, the change was statistically negligible and continues to indicate sustained pressure upon inflation expectations at rates well above the BoC’s 2% target especially over the 1–2 year policy horizon that dominates concern. Also consider charts 5 and 6 for business expectations of inflation across different time horizons; here too, nobody believes that the BoC will achieve 2% inflation any time soon.
Why does it matter? Because I continue to think that the BoC is behind the eight ball and hung up its cleats too soon. Job done. Not. When inflation expectations become unmoored as they are and when there is evidence on the back of this that behaviour has changed, then it is going to be very difficult to durably achieve the inflation target. Behaviour has changed by way of the aggressive lagging gains in wage demands plus the multi-year gains baked into collective bargaining decisions at rates far above 2%. Collective bargaining matters much more to Canada where one-third of the workforce is unionized than in the US where 10% belong to a union.
Further, Canadian macro data improved into year-end as indicated by yesterday’s releases and this morning’s housing starts are expected to add to this (8:15amET). I’ll share comments below that were offered to clients instantly on the back of the releases:
- Existing home sales were up by 8.7% m/m SA for the biggest gain since April’s rise of over 11%. Sales didn’t collapse last year by any stretch of the imagination; they surged in the Spring when sales were brought forward from later in the year and the longer trend is merely normalizing toward pre-pandemic levels (chart 7). The market pivoted back into net sellers’ territory as the sales-to-new-listings ratio increased to 57.8% while sales to total inventory was just 3.8 months and remains well below the historical average of about 5 months. For the year as a whole, prices were little changed (+0.7% y/y) using CREA’s measure adjusted for compositional shifts, and average unadjusted prices were up by 5.1% y/y.
- Manufacturing sales volumes were also up by 1.6% m/m with wholesale trade up by 0.8% m/m SA (both November). Both of these releases would have been even stronger if not for considerations such as a temporarily shut auto assembly plant in Ontario that is retooling and if not for ongoing reverberations of the UAW strike in the US. Statcan also continues to flag the distortions across several petrochemical plants that were previously shut down and which are still weighing on the q/q numbers.
Also recall that Canada released auto sales for December way back on January 3rd when both Desrosiers Automotive Consultants reported on them (here) and then Ward’s offered their estimate on January 8th (here). As written at the time, it was a strong month in a year that built momentum despite supply headaches.
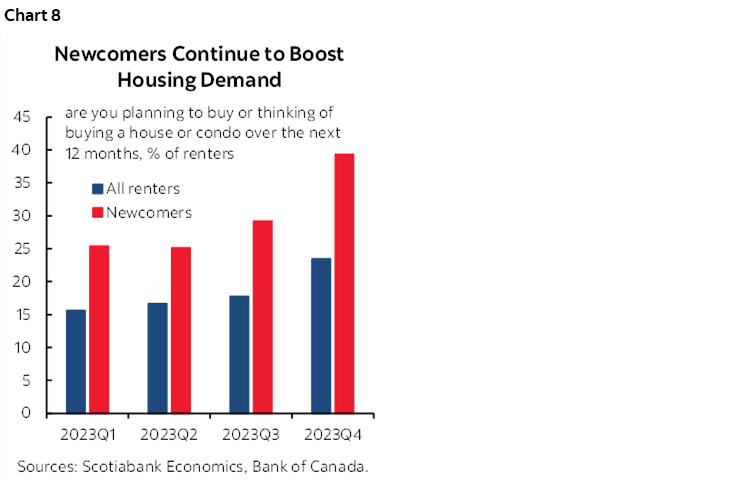
Finally, in a more forward looking sense for Canadian housing, I’m still of the belief that if the BoC were to cut along the market’s priced timeline then they will have learned absolutely nothing. They may as well bring back Poloz who sparked housing bubbles but still denies it. I’ve been saying for ages now that immigration is far too excessive. Take the aggressive rise of newcomers as they migrate from the rental stock upon arrival toward the owned accommodation segment (chart 8) and combine it with other drivers and why on earth would you throw kerosene onto the Spring housing market with rate cuts? Housing inventories are tight, jobs were up 430k last year, wages are ripping, bonds have rallied as a driver of 5-year fixed rate mortgages, and first-time buyers have spent more time building up bigger downpayments to capitalize upon cheaper housing. Yeah. Sure. Cut. Also time those cuts by signalling to governments through the Winter budget season they don’t have as much to worry about in terms of interest expense as they thought last Fall, leading them to spend even more. Then stand back and watch as the same imbalances return while inflation risk is already at a renewed inflection point higher.
DISCLAIMER
This report has been prepared by Scotiabank Economics as a resource for the clients of Scotiabank. Opinions, estimates and projections contained herein are our own as of the date hereof and are subject to change without notice. The information and opinions contained herein have been compiled or arrived at from sources believed reliable but no representation or warranty, express or implied, is made as to their accuracy or completeness. Neither Scotiabank nor any of its officers, directors, partners, employees or affiliates accepts any liability whatsoever for any direct or consequential loss arising from any use of this report or its contents.
These reports are provided to you for informational purposes only. This report is not, and is not constructed as, an offer to sell or solicitation of any offer to buy any financial instrument, nor shall this report be construed as an opinion as to whether you should enter into any swap or trading strategy involving a swap or any other transaction. The information contained in this report is not intended to be, and does not constitute, a recommendation of a swap or trading strategy involving a swap within the meaning of U.S. Commodity Futures Trading Commission Regulation 23.434 and Appendix A thereto. This material is not intended to be individually tailored to your needs or characteristics and should not be viewed as a “call to action” or suggestion that you enter into a swap or trading strategy involving a swap or any other transaction. Scotiabank may engage in transactions in a manner inconsistent with the views discussed this report and may have positions, or be in the process of acquiring or disposing of positions, referred to in this report.
Scotiabank, its affiliates and any of their respective officers, directors and employees may from time to time take positions in currencies, act as managers, co-managers or underwriters of a public offering or act as principals or agents, deal in, own or act as market makers or advisors, brokers or commercial and/or investment bankers in relation to securities or related derivatives. As a result of these actions, Scotiabank may receive remuneration. All Scotiabank products and services are subject to the terms of applicable agreements and local regulations. Officers, directors and employees of Scotiabank and its affiliates may serve as directors of corporations.
Any securities discussed in this report may not be suitable for all investors. Scotiabank recommends that investors independently evaluate any issuer and security discussed in this report, and consult with any advisors they deem necessary prior to making any investment.
This report and all information, opinions and conclusions contained in it are protected by copyright. This information may not be reproduced without the prior express written consent of Scotiabank.
™ Trademark of The Bank of Nova Scotia. Used under license, where applicable.
Scotiabank, together with “Global Banking and Markets”, is a marketing name for the global corporate and investment banking and capital markets businesses of The Bank of Nova Scotia and certain of its affiliates in the countries where they operate, including; Scotiabank Europe plc; Scotiabank (Ireland) Designated Activity Company; Scotiabank Inverlat S.A., Institución de Banca Múltiple, Grupo Financiero Scotiabank Inverlat, Scotia Inverlat Casa de Bolsa, S.A. de C.V., Grupo Financiero Scotiabank Inverlat, Scotia Inverlat Derivados S.A. de C.V. – all members of the Scotiabank group and authorized users of the Scotiabank mark. The Bank of Nova Scotia is incorporated in Canada with limited liability and is authorised and regulated by the Office of the Superintendent of Financial Institutions Canada. The Bank of Nova Scotia is authorized by the UK Prudential Regulation Authority and is subject to regulation by the UK Financial Conduct Authority and limited regulation by the UK Prudential Regulation Authority. Details about the extent of The Bank of Nova Scotia's regulation by the UK Prudential Regulation Authority are available from us on request. Scotiabank Europe plc is authorized by the UK Prudential Regulation Authority and regulated by the UK Financial Conduct Authority and the UK Prudential Regulation Authority.
Scotiabank Inverlat, S.A., Scotia Inverlat Casa de Bolsa, S.A. de C.V, Grupo Financiero Scotiabank Inverlat, and Scotia Inverlat Derivados, S.A. de C.V., are each authorized and regulated by the Mexican financial authorities.
Not all products and services are offered in all jurisdictions. Services described are available in jurisdictions where permitted by law.