| ON DECK FOR FRIDAY, FEBRUARY 9 |
KEY POINTS:
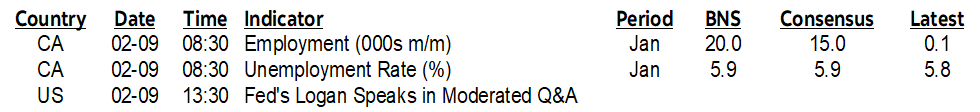
- Markets await US data wiggles
- Five years of US CPI revisions are on tap...
- ...but the potential implications are likely exaggerated
- Canadian jobs set for update as the slowing narrative is overblown so far
- China’s loan originations accelerated
- Peru’s central bank cut, issues data dependent forward guidance
I guess it’s a further sign of the times that data revisions—yes, revisions!—would have markets somewhat on tenterhooks to end the week. It all sounds very much over hyped and over analyzed to me. Let’s just see the numbers, watch markets potentially over react, and then settle back into assessing incremental risks that will ultimately guide the Fed. In my opinion, Governor Waller sounded a tad ridiculous upon making the fate of US monetary policy so dependent upon this morning’s possible changes. Said revisions will compete against Canadian labour market readings in local markets. Chinese credit figures are being largely ignored in markets and Peru’s markets will assess the BCRP’s latest rate decision.
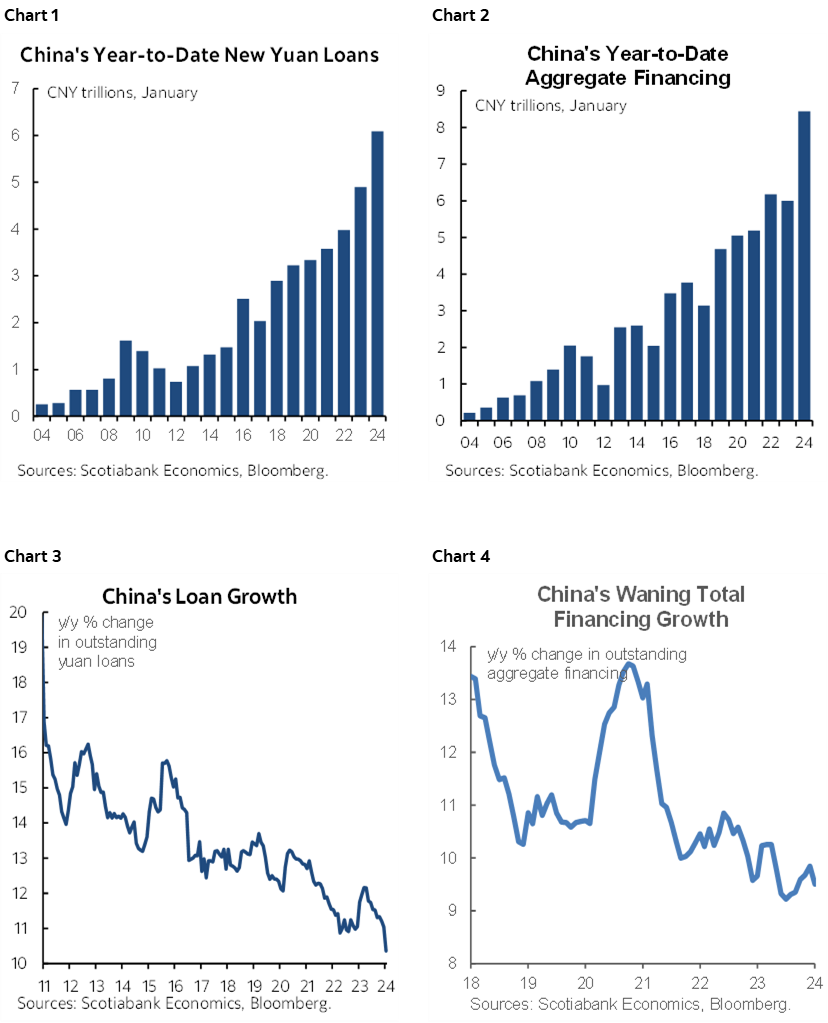
Chinese Loan Originations Accelerate, Growth in Outstandings Cools
China randomly released financing figures this morning. They showed the strongest start to the new year on record in terms of new originations, while growth in outstandings continued to slip. Chart 1 shows new yuan loans that were issued in January compared to all other prior Januarys. Chart 2 does likewise for aggregate financing that also includes FX loans, bonds, equities, trust loans and shadow banking products. Chart 3 depicts growth in outstanding balances of yuan-denominated loans and chart 4 shows growth in outstanding balances across all financing products.
Peru’s Central Bank Cut, Emphasizes Uncertainty
Peru’s central bank cut by 25bps last evening as widely expected. That extended the pattern of 25bps reductions for a cumulative 150bps of easing since cuts began in September. The central bank expects inflation “to be within that target in the next two months.” Guidance indicated that inflation is expected to continue to point lower. Forward rate guidance noted “This decision does not necessarily imply a sequence of interest rate reductions” with emphasis upon data dependence.
US CPI Revisions and the Fed
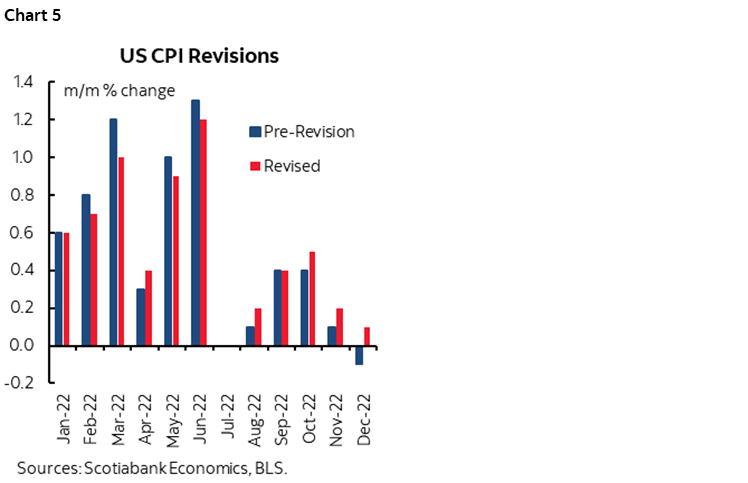
Annual revisions to the past five years of US CPI figures will be delivered this morning (8:30amET). The purpose is to re-estimate seasonal adjustment factors and hence seasonally adjusted m/m headline and core CPI from January 2019 to December 2023. I’ve seen a lot of ink splashed on trying to out-guess what the revisions may look like. That’s a waste of time imo given the extreme sensitivity to missing information and the BLS’s exact methodologies, so let’s just see the numbers.
Recall that a year ago, the revisions surprised by coming in a bit hotter than expected toward the end of 2022 (chart 5) and that somewhat spooked bonds and the Fed. Will this year’s revisions fundamentally alter the Fed’s course? I highly doubt it, regardless of how markets may or may not react today. A very strong US economy and job market plus rising global transportation costs are among the factors that are keeping the Fed cautious. So is whether core goods disinflation will continue to abate in next week’s CPI and subsequent reports, while core services inflation remains sticky.
Dallas Fed President Logan will have the opportunity to react to the revisions when she speaks at 1:30pmET.
Canada’s Slowing Job Growth Narrative Needs Stronger Evidence
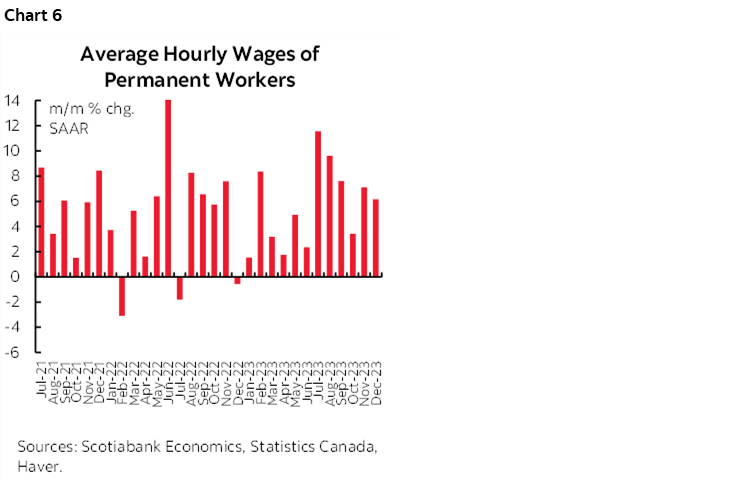
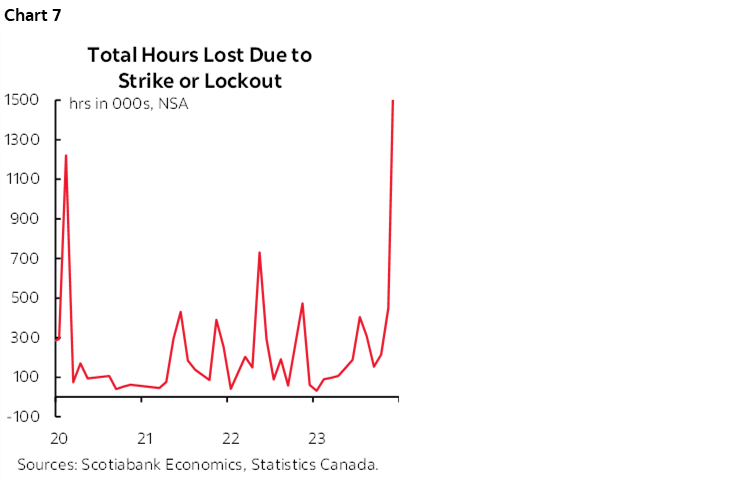
Canada updates jobs, wages, hours worked and other labour force measures for January this morning (8:30amET). I went with +20k and a tick higher UR at 5.9%. Hours worked will probably gain as striking workers in Quebec returned to work (chart 6). That could be a plus for January GDP given GDP is an identity defined as hours times labour productivity.
Canada has a little more momentum into these figures than initially thought. Instead of flat employment in December, Statcan’s annual revisions to seasonal adjustments that were released on January 29th revised up that month to post a roughly 7k gain. That’s not much, but there is another reason to fade the view that Canada’s job market cooled in December. The initial print was only flat because of self-employed jobs that fell 18k as an offset to a similar rise in payrolls. Self-employed jobs are statistically noisier with a much higher standard deviation relative to the mean monthly change; in other words, it’s soft, statistically less reliable data. Taking this into consideration, it’s hard to argue that the job market has been materially cooling after strong gains were registered over prior months.
Other than jobs, wages may matter by more. Wages were up by 6.2% m/m SAAR in December (chart 7) and that popped the year-over-year rate up to 5.7% from 5%. One month isn’t something to overreact toward, but the trend has been undeniably hot and the momentum in wage settlements points to multi-year pressures as productivity tanks.
DISCLAIMER
This report has been prepared by Scotiabank Economics as a resource for the clients of Scotiabank. Opinions, estimates and projections contained herein are our own as of the date hereof and are subject to change without notice. The information and opinions contained herein have been compiled or arrived at from sources believed reliable but no representation or warranty, express or implied, is made as to their accuracy or completeness. Neither Scotiabank nor any of its officers, directors, partners, employees or affiliates accepts any liability whatsoever for any direct or consequential loss arising from any use of this report or its contents.
These reports are provided to you for informational purposes only. This report is not, and is not constructed as, an offer to sell or solicitation of any offer to buy any financial instrument, nor shall this report be construed as an opinion as to whether you should enter into any swap or trading strategy involving a swap or any other transaction. The information contained in this report is not intended to be, and does not constitute, a recommendation of a swap or trading strategy involving a swap within the meaning of U.S. Commodity Futures Trading Commission Regulation 23.434 and Appendix A thereto. This material is not intended to be individually tailored to your needs or characteristics and should not be viewed as a “call to action” or suggestion that you enter into a swap or trading strategy involving a swap or any other transaction. Scotiabank may engage in transactions in a manner inconsistent with the views discussed this report and may have positions, or be in the process of acquiring or disposing of positions, referred to in this report.
Scotiabank, its affiliates and any of their respective officers, directors and employees may from time to time take positions in currencies, act as managers, co-managers or underwriters of a public offering or act as principals or agents, deal in, own or act as market makers or advisors, brokers or commercial and/or investment bankers in relation to securities or related derivatives. As a result of these actions, Scotiabank may receive remuneration. All Scotiabank products and services are subject to the terms of applicable agreements and local regulations. Officers, directors and employees of Scotiabank and its affiliates may serve as directors of corporations.
Any securities discussed in this report may not be suitable for all investors. Scotiabank recommends that investors independently evaluate any issuer and security discussed in this report, and consult with any advisors they deem necessary prior to making any investment.
This report and all information, opinions and conclusions contained in it are protected by copyright. This information may not be reproduced without the prior express written consent of Scotiabank.
™ Trademark of The Bank of Nova Scotia. Used under license, where applicable.
Scotiabank, together with “Global Banking and Markets”, is a marketing name for the global corporate and investment banking and capital markets businesses of The Bank of Nova Scotia and certain of its affiliates in the countries where they operate, including; Scotiabank Europe plc; Scotiabank (Ireland) Designated Activity Company; Scotiabank Inverlat S.A., Institución de Banca Múltiple, Grupo Financiero Scotiabank Inverlat, Scotia Inverlat Casa de Bolsa, S.A. de C.V., Grupo Financiero Scotiabank Inverlat, Scotia Inverlat Derivados S.A. de C.V. – all members of the Scotiabank group and authorized users of the Scotiabank mark. The Bank of Nova Scotia is incorporated in Canada with limited liability and is authorised and regulated by the Office of the Superintendent of Financial Institutions Canada. The Bank of Nova Scotia is authorized by the UK Prudential Regulation Authority and is subject to regulation by the UK Financial Conduct Authority and limited regulation by the UK Prudential Regulation Authority. Details about the extent of The Bank of Nova Scotia's regulation by the UK Prudential Regulation Authority are available from us on request. Scotiabank Europe plc is authorized by the UK Prudential Regulation Authority and regulated by the UK Financial Conduct Authority and the UK Prudential Regulation Authority.
Scotiabank Inverlat, S.A., Scotia Inverlat Casa de Bolsa, S.A. de C.V, Grupo Financiero Scotiabank Inverlat, and Scotia Inverlat Derivados, S.A. de C.V., are each authorized and regulated by the Mexican financial authorities.
Not all products and services are offered in all jurisdictions. Services described are available in jurisdictions where permitted by law.