ON DECK FOR FRIDAY, FEBRUARY 2
KEY POINTS:
- Tech earnings buoy risk sentiment…
- …as markets await nonfarm payrolls and wages
- Why US nonfarm payrolls face even more uncertainty than usual
- Tentative evidence is confirming my bullish Canadian housing narrative…
- …that is part of the narrative that portrays cut pricing to be offside
US tech earnings are supporting risk appetite ahead of nonfarm payrolls and wages. There was nothing else by way of material developments overnight. Canadian housing developments are flagged below.
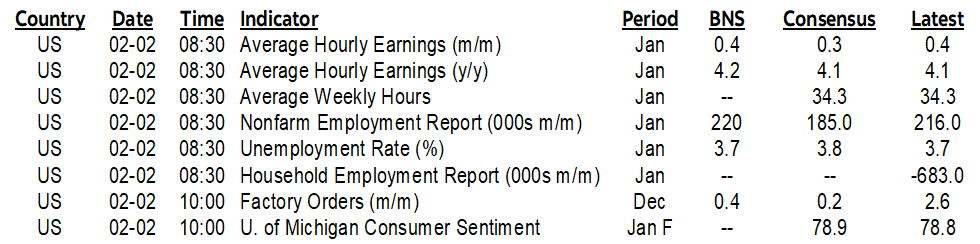
Here is a preview of the establishment (aka Current Employment Statistics) and household (aka Current Population Survey) surveys of US job market conditions for January (8:30amET). The normal elevated uncertainty having to do with high statistical noise at the best of times is going to be even greater this time.
Consensus median: 185k
Consensus mean: 196k
Scotia: 220k
Range: Most are within 140k – 240k which is well within statistical noise bands
Whisper number: 213k
Std dev: 41k
90% confidence interval: +/-130k (ergo noisy!)
Wages: 0.3% m/m SA // Scotia 0.4% m/m
UR: 3.8% // Scotia 3.7% from 3.7%
Watch for annual benchmark revisions that adjust SA factors for payrolls. Watch for fresh population estimates that could drive revisions to the companion household survey from which the UR is derived. Control for potential weather effects.
As for what we can piece together from other advance labour market readings, here’s the list:
- Consumers said jobs were materially more plentiful in January as the jobs plentiful reading within the Conf Board’s consumer confidence gauge jumped by 5.1 points to its highest reading since last June.
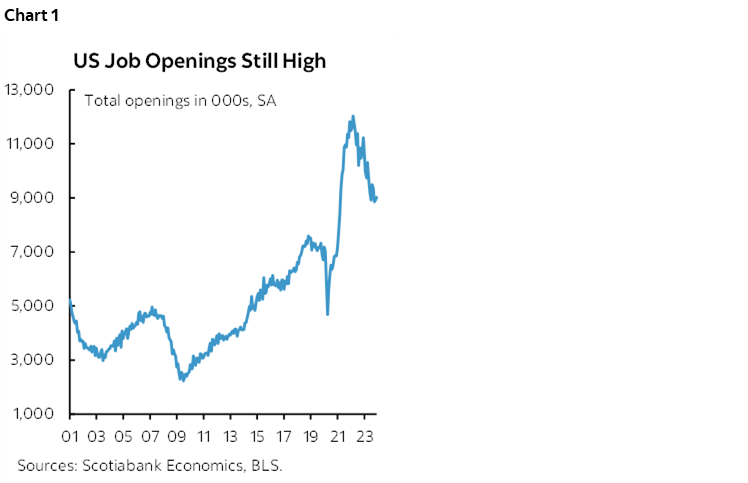
- JOLTS job vacancies increased in December. They are well off the peak, but still well above pre-pandemic levels (chart 1).
- The NFIB small business measure of jobs hard to fill fell a point to its lowest since January 2021. The NFIB’s hiring plans index fell two points to its weakest since May 2020.
- ADP private payrolls were up by just 107k. Lots of head fakes in terms of the relationship to nonfarm private payrolls.
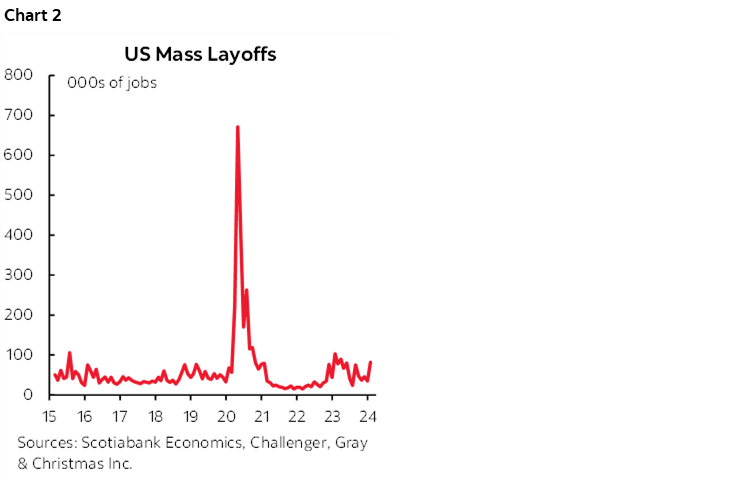
- Challenger layoffs increased to 82k in January from 35k but they are not seasonally adjusted (chart 2). The same thing happened at the start of last year. What I think is happening is that companies hired so many workers out of the pandemic and then as they reported full year earnings and conducted performance reviews they’ve been engaged in greater than normal culling of the workforce at the start of each year. I would caution against declaring a trend.
- Initial jobless claims were little changed between the December and January nonfarm reference periods (the pay period including the 12th).
On a totally different note, I'm hearing of more and more bullish Canadian housing facts that play to my narrative that the BoC is going to be caught flat footed into the Spring market once again. On the heels of an 8.7% m/m SA jump in Canadian existing home sales in December that was the hottest gain since last April’s surge, the tentative evidence is pointing toward a continuation of strong momentum.
1. I'm hearing multiple anecdotes of soaring mortgage applications across the street and desks.
2. Calgary home sales during January sound like they were strong, pushing months supply down to 1.3 months nearing 2006 lows (here). 1.3 months!! Vancouver and Toronto should be out next week.
3. Check out the bidding frenzy that occurred at this pretty average home, albeit distorted by a list-low sales tactic.
As for the drivers? This has nothing to do with a Spring or mid-year rate cut that's not gonna happen anyway. This is about mismanaged and grossly excessive immigration, lean supply, 1st time buyers amassing bigger down payments to capitalize upon slightly cheaper prices, ripping wages, a strong job market, seasonal demand, and better household finances than often portrayed.
DISCLAIMER
This report has been prepared by Scotiabank Economics as a resource for the clients of Scotiabank. Opinions, estimates and projections contained herein are our own as of the date hereof and are subject to change without notice. The information and opinions contained herein have been compiled or arrived at from sources believed reliable but no representation or warranty, express or implied, is made as to their accuracy or completeness. Neither Scotiabank nor any of its officers, directors, partners, employees or affiliates accepts any liability whatsoever for any direct or consequential loss arising from any use of this report or its contents.
These reports are provided to you for informational purposes only. This report is not, and is not constructed as, an offer to sell or solicitation of any offer to buy any financial instrument, nor shall this report be construed as an opinion as to whether you should enter into any swap or trading strategy involving a swap or any other transaction. The information contained in this report is not intended to be, and does not constitute, a recommendation of a swap or trading strategy involving a swap within the meaning of U.S. Commodity Futures Trading Commission Regulation 23.434 and Appendix A thereto. This material is not intended to be individually tailored to your needs or characteristics and should not be viewed as a “call to action” or suggestion that you enter into a swap or trading strategy involving a swap or any other transaction. Scotiabank may engage in transactions in a manner inconsistent with the views discussed this report and may have positions, or be in the process of acquiring or disposing of positions, referred to in this report.
Scotiabank, its affiliates and any of their respective officers, directors and employees may from time to time take positions in currencies, act as managers, co-managers or underwriters of a public offering or act as principals or agents, deal in, own or act as market makers or advisors, brokers or commercial and/or investment bankers in relation to securities or related derivatives. As a result of these actions, Scotiabank may receive remuneration. All Scotiabank products and services are subject to the terms of applicable agreements and local regulations. Officers, directors and employees of Scotiabank and its affiliates may serve as directors of corporations.
Any securities discussed in this report may not be suitable for all investors. Scotiabank recommends that investors independently evaluate any issuer and security discussed in this report, and consult with any advisors they deem necessary prior to making any investment.
This report and all information, opinions and conclusions contained in it are protected by copyright. This information may not be reproduced without the prior express written consent of Scotiabank.
™ Trademark of The Bank of Nova Scotia. Used under license, where applicable.
Scotiabank, together with “Global Banking and Markets”, is a marketing name for the global corporate and investment banking and capital markets businesses of The Bank of Nova Scotia and certain of its affiliates in the countries where they operate, including; Scotiabank Europe plc; Scotiabank (Ireland) Designated Activity Company; Scotiabank Inverlat S.A., Institución de Banca Múltiple, Grupo Financiero Scotiabank Inverlat, Scotia Inverlat Casa de Bolsa, S.A. de C.V., Grupo Financiero Scotiabank Inverlat, Scotia Inverlat Derivados S.A. de C.V. – all members of the Scotiabank group and authorized users of the Scotiabank mark. The Bank of Nova Scotia is incorporated in Canada with limited liability and is authorised and regulated by the Office of the Superintendent of Financial Institutions Canada. The Bank of Nova Scotia is authorized by the UK Prudential Regulation Authority and is subject to regulation by the UK Financial Conduct Authority and limited regulation by the UK Prudential Regulation Authority. Details about the extent of The Bank of Nova Scotia's regulation by the UK Prudential Regulation Authority are available from us on request. Scotiabank Europe plc is authorized by the UK Prudential Regulation Authority and regulated by the UK Financial Conduct Authority and the UK Prudential Regulation Authority.
Scotiabank Inverlat, S.A., Scotia Inverlat Casa de Bolsa, S.A. de C.V, Grupo Financiero Scotiabank Inverlat, and Scotia Inverlat Derivados, S.A. de C.V., are each authorized and regulated by the Mexican financial authorities.
Not all products and services are offered in all jurisdictions. Services described are available in jurisdictions where permitted by law.