| ON DECK FOR TUESDAY, FEBRUARY 13 |
KEY POINTS:
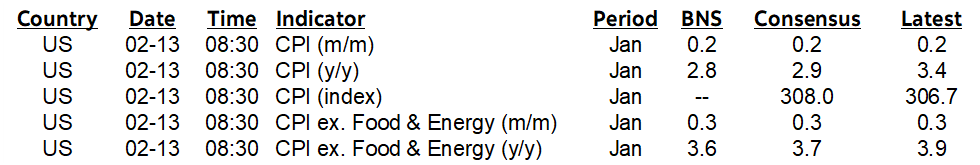
- Markets await US CPI
- US core CPI expected to extend the recent pattern
- Hot UK job market drives gilts to underperform, sterling appreciation
- Swiss Franc depreciates as CPI softens
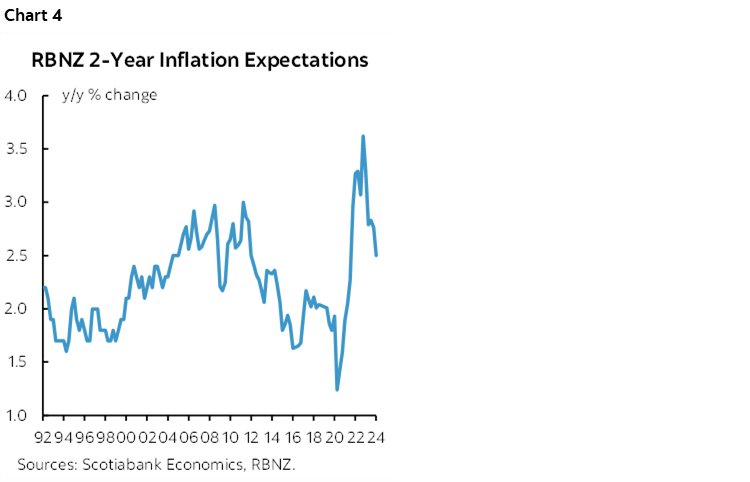
- NZ$ depreciates, curve bull steepens on lower inflation expectations
Markets are bracing for US CPI as UK markets react to an overall hot assessment of the local job market. That has US Treasury and EGB curves slightly rallying, while gilts are slightly underperforming. Equities are treading carefully. Plus oil is up a touch on a revised IEA outlook.
Round 1 of UK data dump week ended positively for the UK economy, not so much for markets. Gilts are underperforming other sovereign bonds this morning in a bear flattener move. The probability of a cut by the June meeting was further reduced with the market’s base case being a fully priced cut by August that was also shaved a little. Sterling is outperforming most crosses.
Here is what went down:
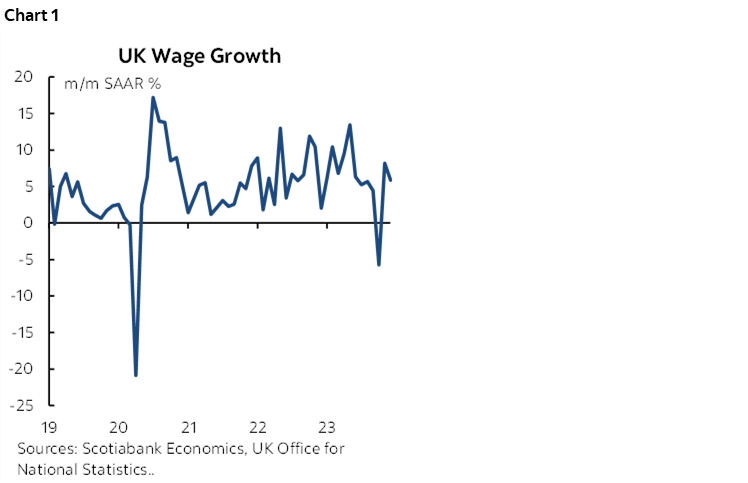
- Wage growth excluding bonuses remains hot (chart 1). Wages were up by 5.9% m/m SAAR in December after the prior 8.2% m/m SAAR gain. The decline in October was the aberration on the trend line that has been market by hot gains. These gains in the UK are being registered despite falling productivity.
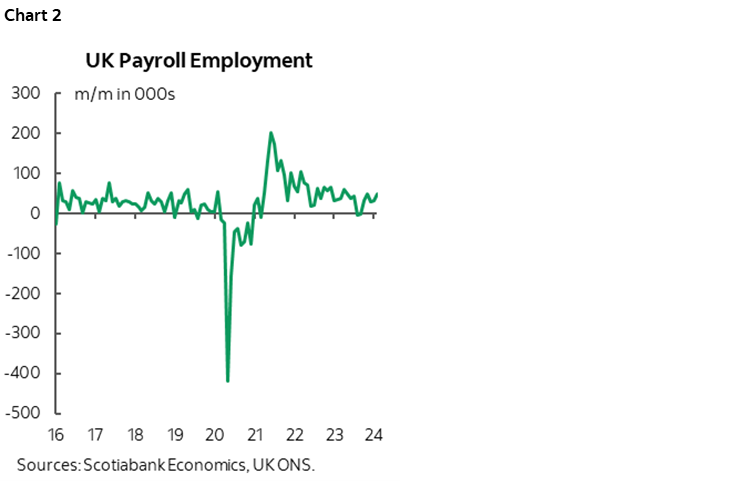
- UK payrolls were up by 48k in January and the prior month was revised up from a loss of 24k to a gain of 31k (chart 2).
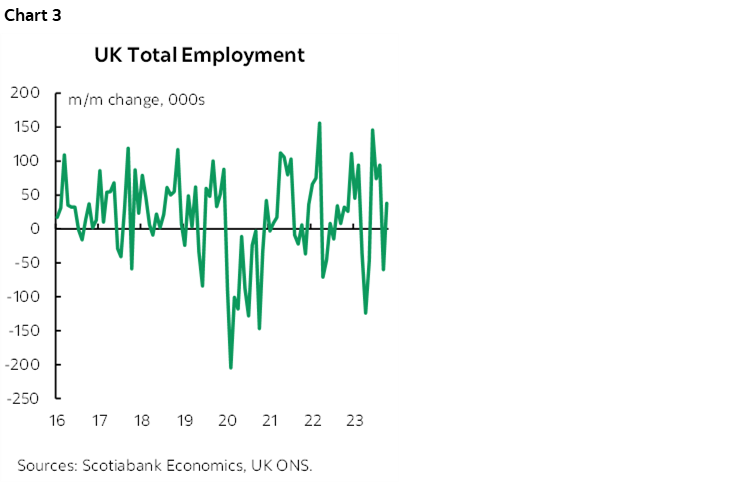
- Lagging total employment was up by 38k m/m SA in December after a 60k drop the prior month (chart 3).
- Jobless claims were up 14k in January while the prior month’s figure was revised down to 5.5k from 11.7k.
All of this should be taken in stride with a lot more UK data due out this week including CPI tomorrow, Q4 GDP on Thursday, and a dump of just about every other December reading this week.
The Swiss franc is underperforming as the rates curve bull steepens following weaker than expected CPI.
The NZ$ is underperforming and its rates curve slightly bull steepened after the RBNZ’s 2-year inflation expectations reading fell again to 2.5% from 2¾% the prior quarter (chart 4). The measure peaked in late 2022 at 3.6% and has been trending lower since then, but still remains a little above the 2% readings that existed before the pandemic.
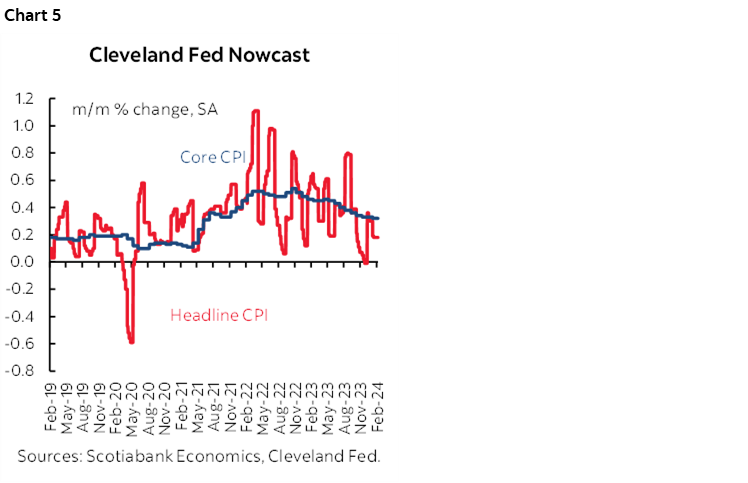
US CPI (8:30amET) is one of two CPI reports and one more PCE report before the March 20th FOMC communications. If core CPI lands at 0.3% m/m SA as expected, then it should drive another core PCE print of 0.2% or so on Feb 29th. That would be the fourth soft reading in a row when FOMC members generally say they want a few more months of evidence after Powell basically ruled out cutting in March.
For details on the estimates, the impact of weighting changes that take effect this time and what to watch for please see the section on US CPI in the Global Week Ahead here. Chart 5 shows the Cleveland Fed’s ‘nowcast’ tracking of headline and core CPI.
DISCLAIMER
This report has been prepared by Scotiabank Economics as a resource for the clients of Scotiabank. Opinions, estimates and projections contained herein are our own as of the date hereof and are subject to change without notice. The information and opinions contained herein have been compiled or arrived at from sources believed reliable but no representation or warranty, express or implied, is made as to their accuracy or completeness. Neither Scotiabank nor any of its officers, directors, partners, employees or affiliates accepts any liability whatsoever for any direct or consequential loss arising from any use of this report or its contents.
These reports are provided to you for informational purposes only. This report is not, and is not constructed as, an offer to sell or solicitation of any offer to buy any financial instrument, nor shall this report be construed as an opinion as to whether you should enter into any swap or trading strategy involving a swap or any other transaction. The information contained in this report is not intended to be, and does not constitute, a recommendation of a swap or trading strategy involving a swap within the meaning of U.S. Commodity Futures Trading Commission Regulation 23.434 and Appendix A thereto. This material is not intended to be individually tailored to your needs or characteristics and should not be viewed as a “call to action” or suggestion that you enter into a swap or trading strategy involving a swap or any other transaction. Scotiabank may engage in transactions in a manner inconsistent with the views discussed this report and may have positions, or be in the process of acquiring or disposing of positions, referred to in this report.
Scotiabank, its affiliates and any of their respective officers, directors and employees may from time to time take positions in currencies, act as managers, co-managers or underwriters of a public offering or act as principals or agents, deal in, own or act as market makers or advisors, brokers or commercial and/or investment bankers in relation to securities or related derivatives. As a result of these actions, Scotiabank may receive remuneration. All Scotiabank products and services are subject to the terms of applicable agreements and local regulations. Officers, directors and employees of Scotiabank and its affiliates may serve as directors of corporations.
Any securities discussed in this report may not be suitable for all investors. Scotiabank recommends that investors independently evaluate any issuer and security discussed in this report, and consult with any advisors they deem necessary prior to making any investment.
This report and all information, opinions and conclusions contained in it are protected by copyright. This information may not be reproduced without the prior express written consent of Scotiabank.
™ Trademark of The Bank of Nova Scotia. Used under license, where applicable.
Scotiabank, together with “Global Banking and Markets”, is a marketing name for the global corporate and investment banking and capital markets businesses of The Bank of Nova Scotia and certain of its affiliates in the countries where they operate, including; Scotiabank Europe plc; Scotiabank (Ireland) Designated Activity Company; Scotiabank Inverlat S.A., Institución de Banca Múltiple, Grupo Financiero Scotiabank Inverlat, Scotia Inverlat Casa de Bolsa, S.A. de C.V., Grupo Financiero Scotiabank Inverlat, Scotia Inverlat Derivados S.A. de C.V. – all members of the Scotiabank group and authorized users of the Scotiabank mark. The Bank of Nova Scotia is incorporated in Canada with limited liability and is authorised and regulated by the Office of the Superintendent of Financial Institutions Canada. The Bank of Nova Scotia is authorized by the UK Prudential Regulation Authority and is subject to regulation by the UK Financial Conduct Authority and limited regulation by the UK Prudential Regulation Authority. Details about the extent of The Bank of Nova Scotia's regulation by the UK Prudential Regulation Authority are available from us on request. Scotiabank Europe plc is authorized by the UK Prudential Regulation Authority and regulated by the UK Financial Conduct Authority and the UK Prudential Regulation Authority.
Scotiabank Inverlat, S.A., Scotia Inverlat Casa de Bolsa, S.A. de C.V, Grupo Financiero Scotiabank Inverlat, and Scotia Inverlat Derivados, S.A. de C.V., are each authorized and regulated by the Mexican financial authorities.
Not all products and services are offered in all jurisdictions. Services described are available in jurisdictions where permitted by law.