ON DECK FOR WEDNESDAY, AUGUST 28

KEY POINTS:
- Markets passing time in late August trading
- Australian rates underperform on CPI update
- Canada’s bank earnings season is posting more beats than misses
- Canada, US auctions on tap
- Tech earnings pose risk in the aftermarket
- The Fed is too confident that the job market is slowing
- The impact of Canada’s plans to curtail immigration
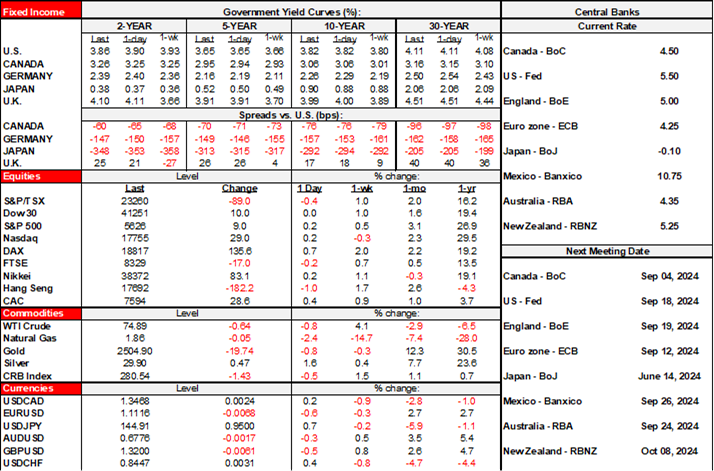
It’s very quiet in the markets in classic late-August fashion and absent major macro catalysts that could influence market sentiment. We just have Canadian bank earnings to consider. Overnight developments were extremely light and only included monthly Australian CPI that was a tick higher than expected at 3.5% y/y which contributed to very mild underperformance by the Australian rates curve relative to others. There is no macro risk on tap into the N.A. session, just regular hum drum auctions. Canada auctions 2s at noon. The US auctions 2-year FRNs at 11:30amET and 5s at 1pmET. We’ll get Nvidia’s earnings in the after-market which may be key to tech and broader stock market sentiment given how big it is at the forefront of AI investment.
3–2 IN CANADA’S BANK EARNINGS SEASON
The score is 3–2 for beats to misses in Canada’s bank earnings season so far. RBC’s earnings strongly beat expectations at C$3.26 (consensus EPS $2.97). National Bank also posted a solid beat with EPS at C$2.68 ($2.47 consensus). That leaves us with beats by my employer (BNS) yesterday, plus RBC and National today, and earlier misses by BMO and TD with CIBC poised to either tie the score or tip the balance further toward beats when they release tomorrow.
There isn’t much to write about by way of the day’s topics, but here’s a bit of effort on two special topics.
ARE FED OFFICIALS TOO CONFIDENT IN THE SLOWING JOB MARKET NARRATIVE?
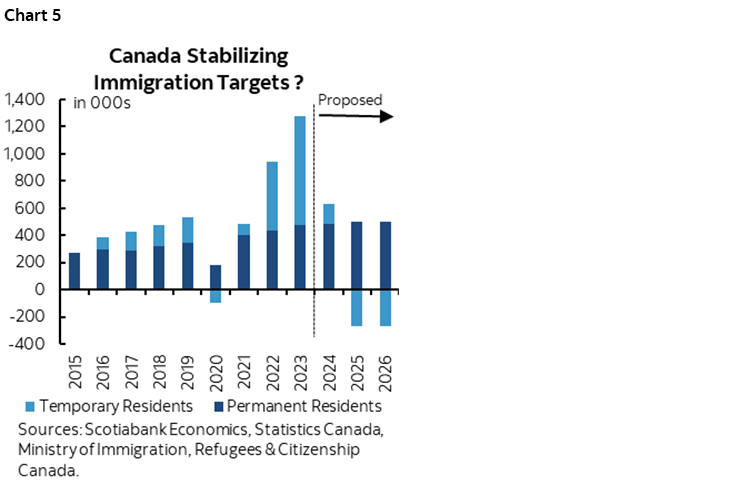
Are Federal Reserve officials too confident that the job market is slowing across a panoply of measures? I wrote about this in my Global Week Ahead (here) and will add another couple of examples to the oddities around seasonally adjusted job market readings. In my weekly, I noted that nonfarm payrolls and the household survey (as well as inflation) appear to be plagued by ongoing seasonal adjustment distortions. Those jobs charts are repeated in charts 1, 2. The same pattern exists in other readings, like initial claims (chart 3) and even the Conference Board’s consumer confidence measure for jobs plentiful (chart 4).
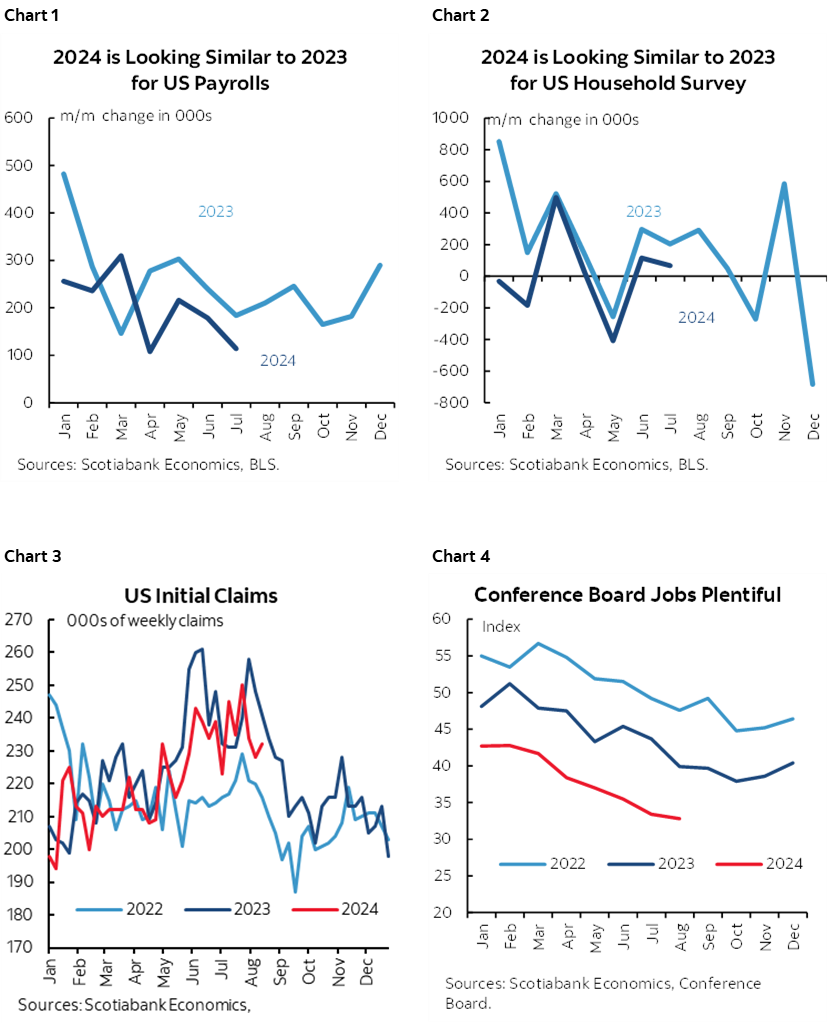
The theory behind the steady pattern of the strongest seasonally adjusted readings at the start of the year and then weaker readings is that the pandemic’s disruptive effects hit from March 2020 and subsequent months and with rolling shocks through on and off waves of restrictions. Seasonal adjustment factors may be distorted in the aftermath. I had presented further views on this in my nonfarm payrolls note here and still don’t believe in the downward revisions to nonfarm payrolls (here).
MACRO EFFECTS OF CHANGING CANADA’S IMMIGRATION TARGETS
What may be the impact of the changes announced to Canada’s immigration plans that target fewer temporary foreign workers (aka temporary foreign worker program and international mobility program work permit holders) on the heels of the earlier announcements regarding international students (aka study permit holders)?
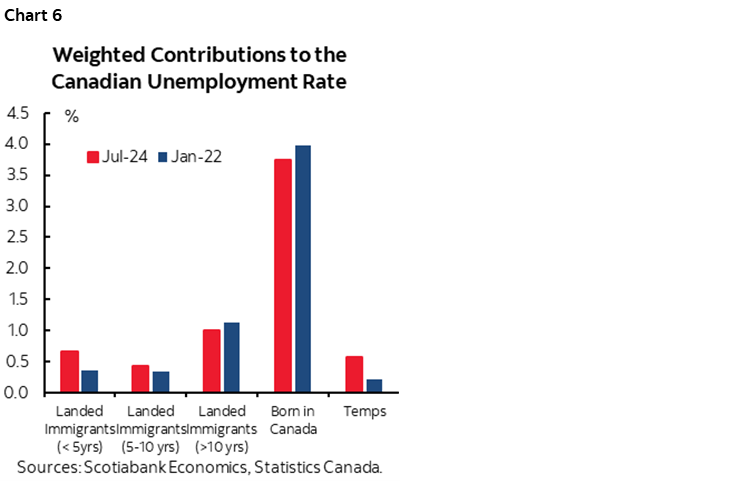
This is part of the goal of reducing the non permanent resident category from 6.8% of total population to 5% of presumably projected population (not current) within three years which will lower annual population growth to under 1% y/y probably starting in 2025. Chart 5 shows the required path for temporary residents that must decline in absolute terms each year in order to achieve this target. There may be more changes ahead as PM Trudeau said that a fuller immigration plan will be unveiled later this year and may include reductions to permanent resident immigration flows. As usual, Trudeau spoke, and then we're waiting for a formal release with greater details that is as yet unavailable at the Ministry’s website (here) which continues the odd way of making policy announcements.
This is in keeping with the announcements a few months ago that depended upon negotiations with provinces and educational institutions that get more money from international students than crowded-out domestic students and without being accountable for how to house them. There is no educating-the-world motive here; it’s plain dollars and cents guiding educational institutions particularly in light of funding shortfalls from other sources. These negotiations were to take into late Summer and Fall before announcements.
As for macro effects:
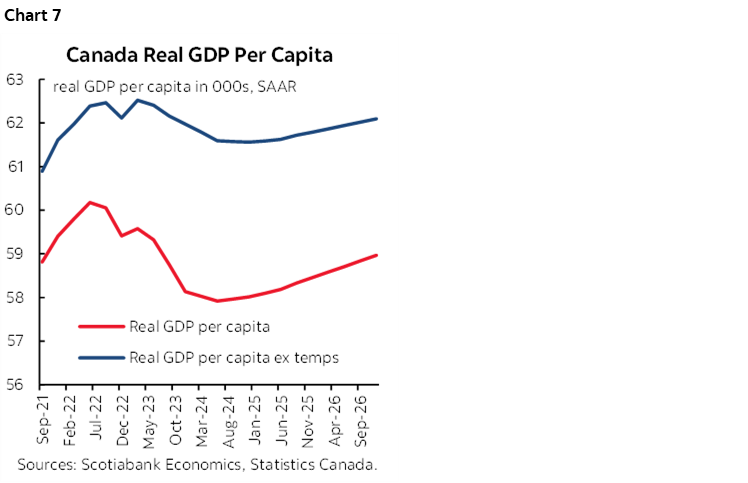
1. It will push the unemployment rate down as most of the reason why it has risen has been due to the temp category in terms of the breakdown of the unemployed (chart 6). As that temp population is reduced, it will shrink the labour force more so than employment since many of the temp foreign workers, international students and asylum seekers who make up that category have been unable to find work. The chart shows that the UR between early 2022 and now fell for those born in Canada, was little changed for landed immigrants as it slipped for long-term landed immigrants but ticked up for more recent ones and climbed for non permanent residents (temps). A decline in the UR may give the BoC the impression that the labour market has tightened. This could be as fallacious as the argument that it has loosened as the UR was driven up by temps despite the fact they don’t compete for the vast overwhelming numbers of jobs.
2. I expect little to no impact on key wage measures but obviously the direction of risks to wage growth is higher rather than lower. The main wage measure comes from the Labour Force Survey and is for permanent employees which is defined as a job that is expected to last as long as the employee wants it which likely excludes many students and temp foreign workers. Plus, there is very little to no clear linkage between immigration swings and aggregate wages in the literature even in the US where the literature is much deeper. That literature shows that the immigration wage elasticity across multiple studies converges around zero.
3. As for GDP, key is that I expect it to put a renewed upward trend into real GDP per capita versus the downward trend to date. Chart 7 shows GDP per capita including and excluding temps and uses Statcan projections for total population, the required projections for temps to get them down to 5% of total population within three years, and our projected base case for GDP. Excluding temps to date shows nowhere near the hit to real GDP per capita. As population growth goes from around 3% y/y during the period since 2022 when immigration began surging and back down to <1% y/y when these changes take effect, it should lift real GDP per capita all else equal. We have GDP growth at 2% next year and hence double projected population growth. This is why I've been arguing that the focus upon declining real GDP per capita has been partly politicized as a sign of economic failure whereas a significant part of the drivers has been due to the mismanaged explosion of the number of temps (ie: nonpermanent residents) being brought into the country. It’s certainly not to deny there is also a long-established productivity problem in Canada that spans multiple administrations with accountability spread across public and private sectors.
4. Why remove the temp category from the numbers which reveals a stronger performance for real per capita GDP? From what I recall of my student years long ago, students don’t contribute proportionately to the economy as others do! Tuition, books, maybe some form of housing, some modest form of employment, beer money etc. Nor do temp foreign workers who send paycheques home, spend a little here, and take the rest back home with them when they leave. Nor do asylum seekers. Why include those categories that are temporarily skyrocketing, and on the assumptions that a) they’ll never turn into contributing to the economy in a more fulsome manner, b) that they’ll stay, and c) that they contribute the same as the permanent residents category of immigration and the born in Canada components? By definition, the temps category is either transient labour and/or on the path to contributing more in future and as they do they’ll lift GDP per capita.
5. The BoC knows these arguments. That’s why they say potential GDP growth was lifted temporarily to 2.4% in 2024 by the population surge but that it will come back down to 1.9% in 2025 and 2026 as population growth ebbs. I think they went too high in response to the population surge which is the next point. So, they are already assuming that the supply side’s growth rate has peaked. The question is that of relative magnitudes on the way up and way down as immigration policy shifts. But again, the BoC should not treat all bodies as having the same impact on GDP growth as one another which is basically what they’re doing in going so high on potential GDP growth to date. Students, temp foreign workers and asylum seekers are not contributing one-for-one in proportionate terms to GDP growth as others so why treat them as such. Makes no sense.
So to sum up:
- the economy is performing better in real per capita GDP terms than some say because many non permanent residents should be removed from the calcs.
- The BoC overestimated potential growth to date and so the output gap is not as big as they are assuming imo.
- this adds to reason to still view inflation risk as higher than they are assuming on top of other reasons to still be guarded toward inflation risk.
DISCLAIMER
This report has been prepared by Scotiabank Economics as a resource for the clients of Scotiabank. Opinions, estimates and projections contained herein are our own as of the date hereof and are subject to change without notice. The information and opinions contained herein have been compiled or arrived at from sources believed reliable but no representation or warranty, express or implied, is made as to their accuracy or completeness. Neither Scotiabank nor any of its officers, directors, partners, employees or affiliates accepts any liability whatsoever for any direct or consequential loss arising from any use of this report or its contents.
These reports are provided to you for informational purposes only. This report is not, and is not constructed as, an offer to sell or solicitation of any offer to buy any financial instrument, nor shall this report be construed as an opinion as to whether you should enter into any swap or trading strategy involving a swap or any other transaction. The information contained in this report is not intended to be, and does not constitute, a recommendation of a swap or trading strategy involving a swap within the meaning of U.S. Commodity Futures Trading Commission Regulation 23.434 and Appendix A thereto. This material is not intended to be individually tailored to your needs or characteristics and should not be viewed as a “call to action” or suggestion that you enter into a swap or trading strategy involving a swap or any other transaction. Scotiabank may engage in transactions in a manner inconsistent with the views discussed this report and may have positions, or be in the process of acquiring or disposing of positions, referred to in this report.
Scotiabank, its affiliates and any of their respective officers, directors and employees may from time to time take positions in currencies, act as managers, co-managers or underwriters of a public offering or act as principals or agents, deal in, own or act as market makers or advisors, brokers or commercial and/or investment bankers in relation to securities or related derivatives. As a result of these actions, Scotiabank may receive remuneration. All Scotiabank products and services are subject to the terms of applicable agreements and local regulations. Officers, directors and employees of Scotiabank and its affiliates may serve as directors of corporations.
Any securities discussed in this report may not be suitable for all investors. Scotiabank recommends that investors independently evaluate any issuer and security discussed in this report, and consult with any advisors they deem necessary prior to making any investment.
This report and all information, opinions and conclusions contained in it are protected by copyright. This information may not be reproduced without the prior express written consent of Scotiabank.
™ Trademark of The Bank of Nova Scotia. Used under license, where applicable.
Scotiabank, together with “Global Banking and Markets”, is a marketing name for the global corporate and investment banking and capital markets businesses of The Bank of Nova Scotia and certain of its affiliates in the countries where they operate, including; Scotiabank Europe plc; Scotiabank (Ireland) Designated Activity Company; Scotiabank Inverlat S.A., Institución de Banca Múltiple, Grupo Financiero Scotiabank Inverlat, Scotia Inverlat Casa de Bolsa, S.A. de C.V., Grupo Financiero Scotiabank Inverlat, Scotia Inverlat Derivados S.A. de C.V. – all members of the Scotiabank group and authorized users of the Scotiabank mark. The Bank of Nova Scotia is incorporated in Canada with limited liability and is authorised and regulated by the Office of the Superintendent of Financial Institutions Canada. The Bank of Nova Scotia is authorized by the UK Prudential Regulation Authority and is subject to regulation by the UK Financial Conduct Authority and limited regulation by the UK Prudential Regulation Authority. Details about the extent of The Bank of Nova Scotia's regulation by the UK Prudential Regulation Authority are available from us on request. Scotiabank Europe plc is authorized by the UK Prudential Regulation Authority and regulated by the UK Financial Conduct Authority and the UK Prudential Regulation Authority.
Scotiabank Inverlat, S.A., Scotia Inverlat Casa de Bolsa, S.A. de C.V, Grupo Financiero Scotiabank Inverlat, and Scotia Inverlat Derivados, S.A. de C.V., are each authorized and regulated by the Mexican financial authorities.
Not all products and services are offered in all jurisdictions. Services described are available in jurisdictions where permitted by law.