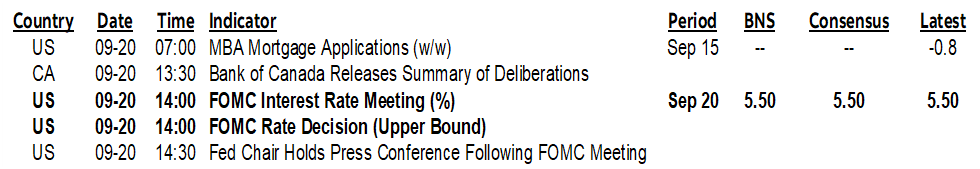
ON DECK FOR WEDNESDAY, SEPTEMBER 20
KEY POINTS:
- Global markets await the Fed
- FOMC expected to deliver a hawkish pass…
- …raise its GDP forecast, lower the UR, leave core PCE little changed…
- …probably continue to signal another hike for two main reasons…
- …while changing future dots is largely futile
- BoC to deliver its Summary of Deliberations today
- The BoC’s selective ‘ups and downs’ is about putting on a brave face
- UK core CPI undershot all forecasts…
- …slashing BoE hike pricing toward a hawkish pause
Welcome to Fed Day with a side order of UK inflation after Canadian inflation rattled a few cages yesterday. Gilts are strongly outperforming post UK core CPI that came in far beneath forecasts as 2s rally by about 15bps in a 2s10s bull steepener. The result drove pricing for tomorrow’s BoE decision toward being more of a coin toss and more toward one-and-done terminal rate pricing.
Other sovereign curves are slightly richer but generally fading the UK data as specific to that market and with the greater focus being upon the Fed. Sterling is underperforming while the dollar is little changed on balance. Equities have a slight bid across NA futures and European cash markets.
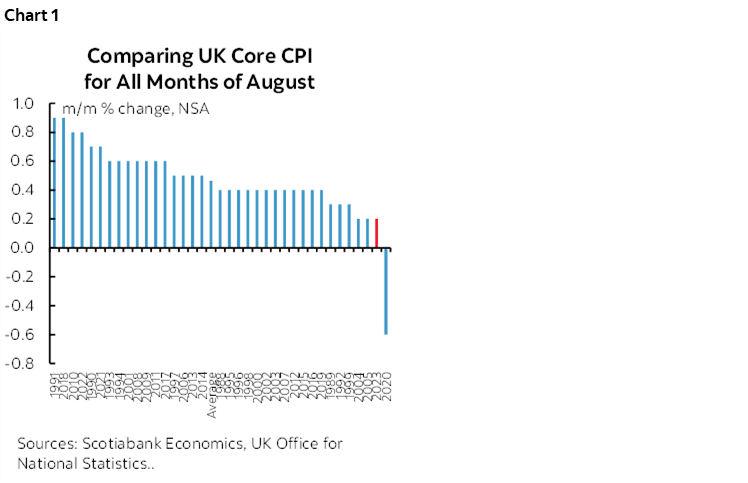
UK core inflation swung from one of the hottest m/m NSA readings on record in July to one of the weakest readings for like months of August (chart 1). Core CPI was up by just 0.16% m/m NSA which is about half of the average for months of August. That dragged the year-over-year reading down to 6.2% (6.9% prior, 6.8% consensus). 6.2% was four-tenths below the lowest forecast in consensus and so economists totally blew their calls. The result even offset energy’s effects on headline CPI that itself came in much weaker than expected at 0.3% m/m (0.7% consensus).
The trend in UK core CPI is still rather warm and there were some distortions in this print, but still, the magnitude of the weakening also has to be put in the context of other recent data that has disappointed. Jobs are being lost. Wage pressures have eased somewhat. GDP has stalled out. Higher frequency activity readings have been disappointing of late. The BoE has candidly expressed openness to forecasting recession but as evidence accumulates that it is unfolding, it will require steely resolve to stick to tightening that may be too much for the doves and moderates on the MPC.
So, onto the Fed we must go. Please see the Global Week Ahead for a fuller set of expectations and arguments here. Statement, Summary of Economic Projections and the ‘dot plot’ all land at 2pmET followed by Chair Powell’s presser 30 minutes later for around an hour.
A pause is almost universally expected along with unchanged balance sheet guidance. They have to revise up GDP growth at least for this year and perhaps take some of that away from next year on the math effects. They also have to revise down the UR this year and perhaps next year. Very little change if any is expected to core PCE forecasts.
On the bias, I would expect continued data dependence and a repeat of “In determining the extent of additional policy firming that may be appropriate….” language.
Regarding the Rorschach test, I’m unconvinced they’ll make major changes to the dots and/or that markets should care. They probably have to carry over the residual hike in the June dots a) because of potential concern about prematurely removing a hike bias if the soft patch proves to be transitory like other pandemic-era episodes, and b) because they are seeking to manage markets and don’t want everyone piling into the front-end just yet.
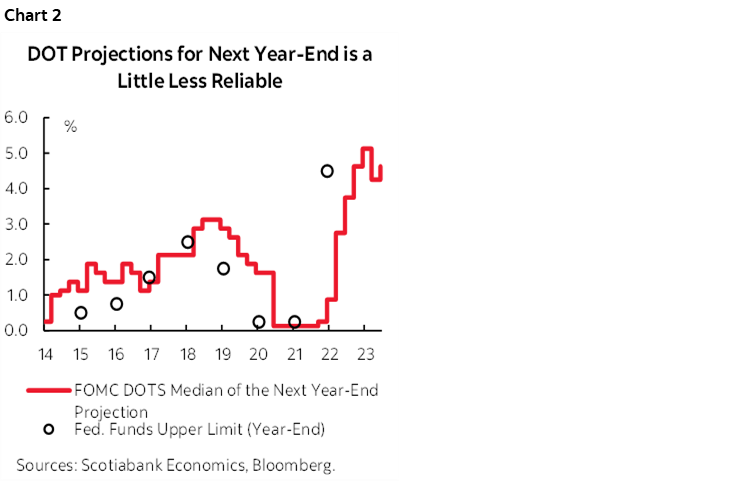
On the 2024 dots, why bother changing them? They only have 100bps of cuts by the end of 2024 assuming they hike once more from here over coming meetings, 75 if they don’t. It’s more likely that they will reduce rather than add to this amount of easing at this point. Markets might show a temporary reaction, but would probably quickly fade this, given that the present year dots perform reasonably well especially by mid-year, but the one-year out and further dots perform horribly in relation to what actually happens. Chart 2 illustrates tracking of the one-year ahead dots and what ultimately happens to fed funds. Longer-term forward guidance was always shaky at the Fed but has been severely damaged by the pandemic. So fool me once….you know how it goes.
The BoC’s Summary of Deliberations (SoD, for short) to the process leading up to the September 6th pause decision will be released at 1:30pmET just before the FOMC statement. They’re not meeting minutes per se, as opposed to being a descriptive account of views expressed during the lengthy formal process leading up to decision day. They are being published at the behest of IMF demands to increase transparency. Watch for hints around the degree of unanimity toward a pause and the range of discussion points after Macklem hinted that they would include such perspectives. I wouldn’t say the SoD has been terribly useful since being introduced in part because they still don’t allow for the full flavour of discussion and any differing views to shine through.
There isn’t much follow through on yesterday’s Canadian CPI print that met my expectations but was higher than consensus (recap here). Key may be how the Bank of Canada views the surprise and on that I’d be careful at this point.
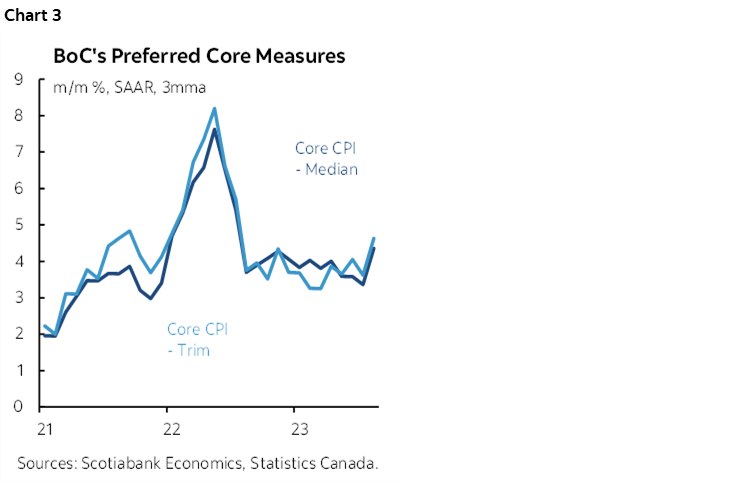
A Deputy Governor at the BoC said yesterday that ripping inflation is merely a sign of the “ups and downs” and “not that unusual.” Really now, well let’s see here. Chart 3 shows that it’s about much more than just ups and downs since the trend is running around very sticky smoothed core gauges that are well above the BoC’s 2% headline target. Like more than twice as high using trend core gauges and nearly three times higher going by the latest core gauges. There is high persistence and core inflation measures have accelerated over the summer months as opposed to mere ‘ups and downs’.
So why did DepGov Kozicki say this when a dispassionate reading of the data should have counselled greater caution? It’s possible it’s just her opinion and not reflective of Governing Council. It’s possible that was speaking without the glam and burden of being the Governor. It would also be rational if it was because the BoC wants to see much more data on the path to the late October decision and beyond.
But it’s also important to emphasize that BoC communications are trying to assert that they’ve got it all under control when in reality they do not. They are under political pressure to sound like everything is under control. Despite the fact that they are, the BoC wants you to believe that they are not still way behind the inflation curve, nor are they way behind wage and productivity pressures with still much further work to do. Heck no, 2% inflation is in sight—by 2025, you know, kind of like how Mars comes into sight as a wee little reddish dot in a powerful enough backyard telescope. Ooooh look everyone, I can see it—and they’re waving back! Yoo hoo! Yep, that’s right, we’ve got it all under control. Minister Freeland said so.
You say Canada is taking on far too many new arrivals than the country can house in a horse’s lifetime and that this is carrying inflationary effects? Meh, just ups and downs. Do a posting trot. Less painful.
The US$24 rise in WTI spot prices since June and the terms of trade are resulting in an imported positive income shock to a commodities producing economy? Meh, just ups and downs.
The northern Turkish lira? Just ups and downs and my do those twenty dollar bills look great in the bathroom.
Governments priming the pumps into their Fall updates? Bwah, me worry? Nah, just more little ups and downs, nothing to see there either, folks. Trudeau/Freeland and the Premiers have that under control too; they called and wrote to the Governor and promised us so who are we at the BoC to say otherwise??
Now, where was this ups and downs bias when it came to discussing Q2 GDP growth? Half the country was on fire—literally—with strikes aplenty and then toss in a really wet month of July, yet that was taken as a sign that higher rates are working. What’s that smell? Must just be a little bonfire. Pass the marshmallows. In referencing the three-quarter trend in GDP growth we’re also being asked to believe that Q4 last year was also such a sign, despite the biggest inventory drawn down in over forty years that dragged multiple percentage points off growth and had zippo to do with rates.
DISCLAIMER
This report has been prepared by Scotiabank Economics as a resource for the clients of Scotiabank. Opinions, estimates and projections contained herein are our own as of the date hereof and are subject to change without notice. The information and opinions contained herein have been compiled or arrived at from sources believed reliable but no representation or warranty, express or implied, is made as to their accuracy or completeness. Neither Scotiabank nor any of its officers, directors, partners, employees or affiliates accepts any liability whatsoever for any direct or consequential loss arising from any use of this report or its contents.
These reports are provided to you for informational purposes only. This report is not, and is not constructed as, an offer to sell or solicitation of any offer to buy any financial instrument, nor shall this report be construed as an opinion as to whether you should enter into any swap or trading strategy involving a swap or any other transaction. The information contained in this report is not intended to be, and does not constitute, a recommendation of a swap or trading strategy involving a swap within the meaning of U.S. Commodity Futures Trading Commission Regulation 23.434 and Appendix A thereto. This material is not intended to be individually tailored to your needs or characteristics and should not be viewed as a “call to action” or suggestion that you enter into a swap or trading strategy involving a swap or any other transaction. Scotiabank may engage in transactions in a manner inconsistent with the views discussed this report and may have positions, or be in the process of acquiring or disposing of positions, referred to in this report.
Scotiabank, its affiliates and any of their respective officers, directors and employees may from time to time take positions in currencies, act as managers, co-managers or underwriters of a public offering or act as principals or agents, deal in, own or act as market makers or advisors, brokers or commercial and/or investment bankers in relation to securities or related derivatives. As a result of these actions, Scotiabank may receive remuneration. All Scotiabank products and services are subject to the terms of applicable agreements and local regulations. Officers, directors and employees of Scotiabank and its affiliates may serve as directors of corporations.
Any securities discussed in this report may not be suitable for all investors. Scotiabank recommends that investors independently evaluate any issuer and security discussed in this report, and consult with any advisors they deem necessary prior to making any investment.
This report and all information, opinions and conclusions contained in it are protected by copyright. This information may not be reproduced without the prior express written consent of Scotiabank.
™ Trademark of The Bank of Nova Scotia. Used under license, where applicable.
Scotiabank, together with “Global Banking and Markets”, is a marketing name for the global corporate and investment banking and capital markets businesses of The Bank of Nova Scotia and certain of its affiliates in the countries where they operate, including; Scotiabank Europe plc; Scotiabank (Ireland) Designated Activity Company; Scotiabank Inverlat S.A., Institución de Banca Múltiple, Grupo Financiero Scotiabank Inverlat, Scotia Inverlat Casa de Bolsa, S.A. de C.V., Grupo Financiero Scotiabank Inverlat, Scotia Inverlat Derivados S.A. de C.V. – all members of the Scotiabank group and authorized users of the Scotiabank mark. The Bank of Nova Scotia is incorporated in Canada with limited liability and is authorised and regulated by the Office of the Superintendent of Financial Institutions Canada. The Bank of Nova Scotia is authorized by the UK Prudential Regulation Authority and is subject to regulation by the UK Financial Conduct Authority and limited regulation by the UK Prudential Regulation Authority. Details about the extent of The Bank of Nova Scotia's regulation by the UK Prudential Regulation Authority are available from us on request. Scotiabank Europe plc is authorized by the UK Prudential Regulation Authority and regulated by the UK Financial Conduct Authority and the UK Prudential Regulation Authority.
Scotiabank Inverlat, S.A., Scotia Inverlat Casa de Bolsa, S.A. de C.V, Grupo Financiero Scotiabank Inverlat, and Scotia Inverlat Derivados, S.A. de C.V., are each authorized and regulated by the Mexican financial authorities.
Not all products and services are offered in all jurisdictions. Services described are available in jurisdictions where permitted by law.