ON DECK FOR TUESDAY, SEPTEMBER 12

KEY POINTS:
- Markets passing time ahead of tomorrow’s US CPI…
- …while monitoring a trifecta of near-term risks…
- …that are likely to weigh on FOMC sentiment next week
- Gilts outperform as UK jobs, wages cool
- UK jobs have fallen for three consecutive months
- UK wage pressures are easing at the margin
- US CPI warning comes from small business plans to hike prices
On the eve of tomorrow’s US CPI and with the exception of the UK, it’s off-calendar risk that is arguably more intriguing than what’s on the formal calendars.
The US may be going into a nasty combination of a UAW strike and a government shutdown alongside the modest hit to consumption from changes to student loans. The shock risk into Q4 negates the fact consensus has been increasingly revising Q3 GDP growth projections higher. Of course the Fed’s going to tread very carefully into that environment which makes next week’s meeting all but assured to offer a pause. That would be true even if it were not the case that payrolls have been rising at a more modest pace of about 150k over the last three months and core inflation has stalled out over the past 3–4 months pending tomorrow’s update that is expected to be soft. The Fed typically does not add monetary policy tightening at the margin when things like government shutdowns are hanging in the air and at a time of year when market risk appetite is often on fragile foundations. Other market influences include tech earnings volatility that’s dampening US equities this morning ahead of Apple’s roll-out plans for new products.
The USD is broadly stronger. Sovereign bond yields are mostly little changed except for gilts. Equities are soft and little changed on balance across NA futures and European cash. Yesterday’s cheapening in JGB 10s and appreciation in the yen on vague talk of maybe, possibly, might, could tweak negative rate policy at the BoJ later in the year has stabilized into this morning.
Gilts are outperforming on a combination of clearly softening employment and wage growth and a fairly bleak assessment offered by BoE Deputy-nominee Sarah Breeden. Breeden said she expects flat GDP over the next two years but no recession; ruling out recession with a flat GDP outlook seems rather strong imo and probably more about the politics of seeking approval.
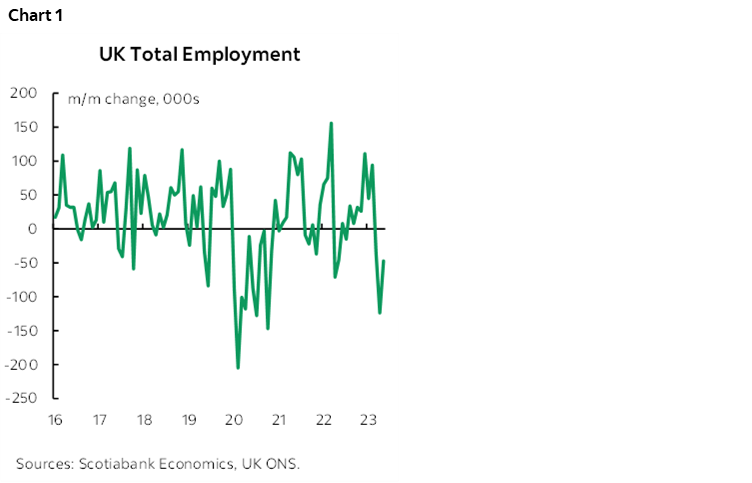
Total UK employment has fallen for three months in a row (chart 1). It was down 47k in July after a 124k drop in June and a 36k decline in May for the first declines since September 2022 and the first string of three or more declines in a row since early 2021.
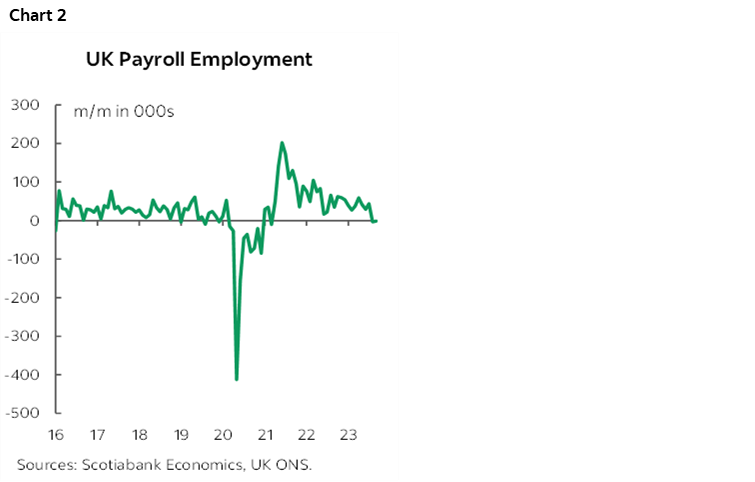
Fresher UK payrolls data is also flattening out (chart 2). A small dip of -1k payroll positions in August follows the prior month’s small 3.5k drop. The past two months have halted the strong gains. The drop in total employment is more about smaller businesses that lack formal payrolls.
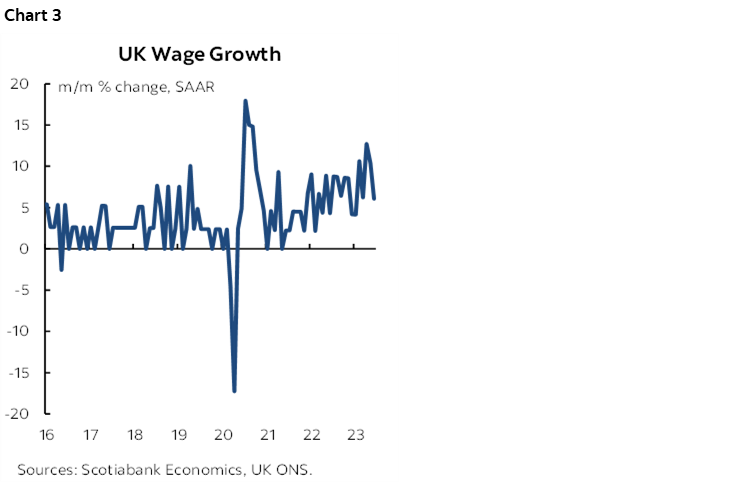
UK wage growth is still strong but cooling. Key is to look at it in month-over-month, seasonally adjusted and annualized terms (chart 3). By that yardstick, UK wage growth landed at 6% m/m SAAR in July for the second month in a row. That’s cooler than the 10-13% range of earlier months, but not cool. The year-over-year measure was 7.8% for a second month and is a 21st Century record high, but if recent gains at the margin continue at this pace then they will take over the base effects and drive slightly cooler year-over-year gains.
Calendar-based risk is very light into the N.A. session. Brazil and India update CPI figures, both at 8amET. There is nothing due out in Canada.
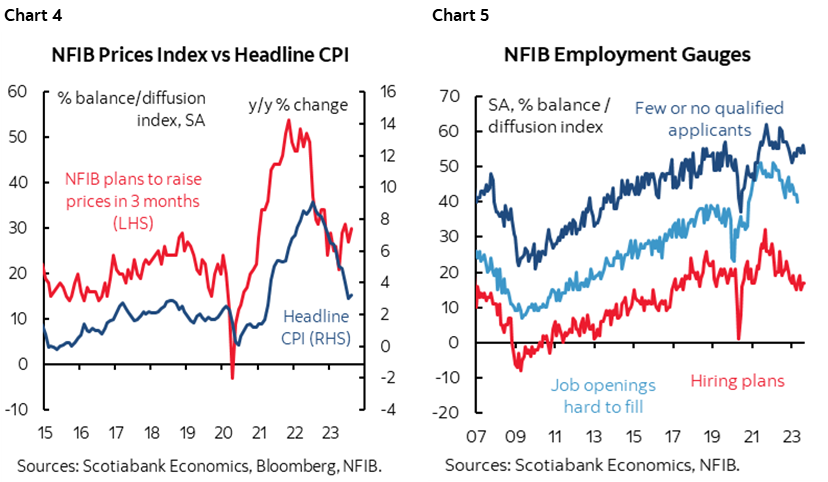
The US updated NFIB small business confidence that held steady in August’s reading that has nevertheless spent the past year trending around lows last seen about a decade ago. There remains a solid net percentage of firms saying they plan to raise prices in the next quarter and that’s a warning sign for nearer term inflation and that suggests near-term upward pressure on CPI inflation in addition to evidence from gasoline prices (chart 4). Hiring plans held steady and have been moving sideways this year while the measure for jobs that are hard to fill improved a bit (chart 5).
DISCLAIMER
This report has been prepared by Scotiabank Economics as a resource for the clients of Scotiabank. Opinions, estimates and projections contained herein are our own as of the date hereof and are subject to change without notice. The information and opinions contained herein have been compiled or arrived at from sources believed reliable but no representation or warranty, express or implied, is made as to their accuracy or completeness. Neither Scotiabank nor any of its officers, directors, partners, employees or affiliates accepts any liability whatsoever for any direct or consequential loss arising from any use of this report or its contents.
These reports are provided to you for informational purposes only. This report is not, and is not constructed as, an offer to sell or solicitation of any offer to buy any financial instrument, nor shall this report be construed as an opinion as to whether you should enter into any swap or trading strategy involving a swap or any other transaction. The information contained in this report is not intended to be, and does not constitute, a recommendation of a swap or trading strategy involving a swap within the meaning of U.S. Commodity Futures Trading Commission Regulation 23.434 and Appendix A thereto. This material is not intended to be individually tailored to your needs or characteristics and should not be viewed as a “call to action” or suggestion that you enter into a swap or trading strategy involving a swap or any other transaction. Scotiabank may engage in transactions in a manner inconsistent with the views discussed this report and may have positions, or be in the process of acquiring or disposing of positions, referred to in this report.
Scotiabank, its affiliates and any of their respective officers, directors and employees may from time to time take positions in currencies, act as managers, co-managers or underwriters of a public offering or act as principals or agents, deal in, own or act as market makers or advisors, brokers or commercial and/or investment bankers in relation to securities or related derivatives. As a result of these actions, Scotiabank may receive remuneration. All Scotiabank products and services are subject to the terms of applicable agreements and local regulations. Officers, directors and employees of Scotiabank and its affiliates may serve as directors of corporations.
Any securities discussed in this report may not be suitable for all investors. Scotiabank recommends that investors independently evaluate any issuer and security discussed in this report, and consult with any advisors they deem necessary prior to making any investment.
This report and all information, opinions and conclusions contained in it are protected by copyright. This information may not be reproduced without the prior express written consent of Scotiabank.
™ Trademark of The Bank of Nova Scotia. Used under license, where applicable.
Scotiabank, together with “Global Banking and Markets”, is a marketing name for the global corporate and investment banking and capital markets businesses of The Bank of Nova Scotia and certain of its affiliates in the countries where they operate, including; Scotiabank Europe plc; Scotiabank (Ireland) Designated Activity Company; Scotiabank Inverlat S.A., Institución de Banca Múltiple, Grupo Financiero Scotiabank Inverlat, Scotia Inverlat Casa de Bolsa, S.A. de C.V., Grupo Financiero Scotiabank Inverlat, Scotia Inverlat Derivados S.A. de C.V. – all members of the Scotiabank group and authorized users of the Scotiabank mark. The Bank of Nova Scotia is incorporated in Canada with limited liability and is authorised and regulated by the Office of the Superintendent of Financial Institutions Canada. The Bank of Nova Scotia is authorized by the UK Prudential Regulation Authority and is subject to regulation by the UK Financial Conduct Authority and limited regulation by the UK Prudential Regulation Authority. Details about the extent of The Bank of Nova Scotia's regulation by the UK Prudential Regulation Authority are available from us on request. Scotiabank Europe plc is authorized by the UK Prudential Regulation Authority and regulated by the UK Financial Conduct Authority and the UK Prudential Regulation Authority.
Scotiabank Inverlat, S.A., Scotia Inverlat Casa de Bolsa, S.A. de C.V, Grupo Financiero Scotiabank Inverlat, and Scotia Inverlat Derivados, S.A. de C.V., are each authorized and regulated by the Mexican financial authorities.
Not all products and services are offered in all jurisdictions. Services described are available in jurisdictions where permitted by law.