ON DECK FOR WEDNESDAY, JUNE 21
KEY POINTS:
- First day of summer rains on bonds thanks to UK CPI, fear of Powell
- UK core CPI continues along a super-hot trend
- The BoE should be seriously considering a 50bps move tomorrow
- Fed’s Powell is likely to repeat similar messaging...
- ...as markets are unwisely haircutting the dot plot’s 2 more hikes in 2023
- Two things to watch for in the BoC’s not-minutes minutes
- Brazil’s central bank could take another dovish step forward
- Canadian retail sales surprise higher, but Q2 is still tracking a dip
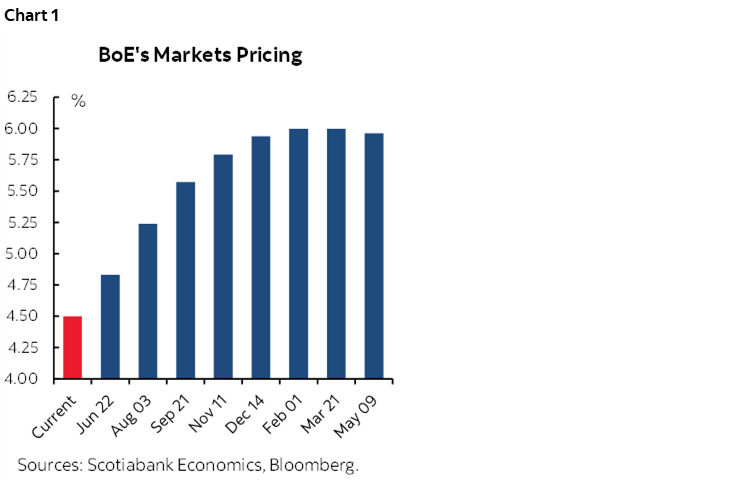
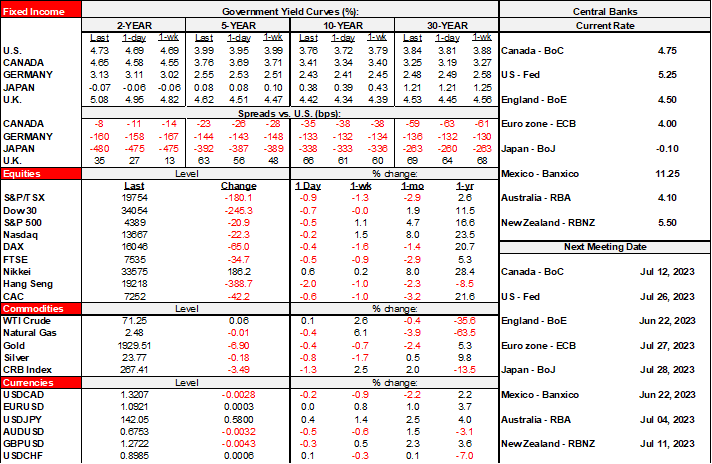
Welcome to the 1st Day of summer in the northern hemisphere. Sovereign bonds are kicking it off under cloudy skies with gilts being the worst performers following another core CPI shocker as markets inch further toward 50bps BoE hike risk versus a dead boring consensus that is devoid of any risk-takers in the boring herd. Market pricing for the BoE is shown in chart 1. Equities are mixed with N.A. and European cash markets generally little changed. The dollar is little changed.
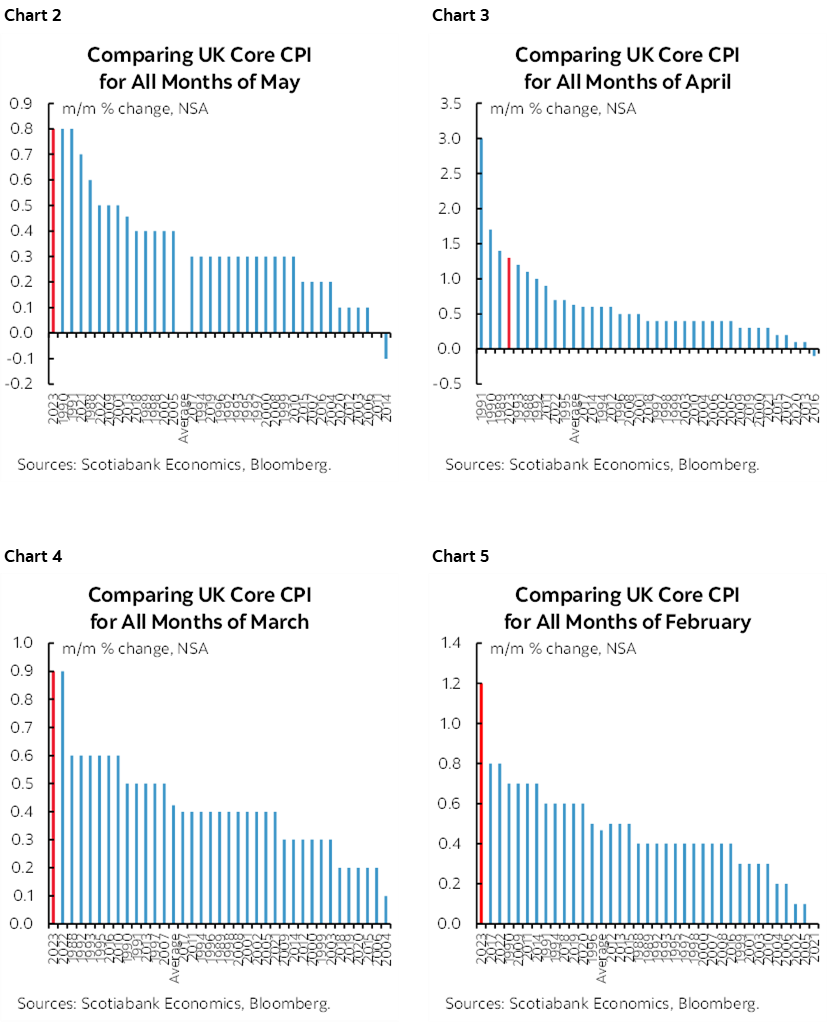
UK core CPI registered one of the three hottest months of May on record (chart 2). The 0.8% m/m NSA gain was a full half-point above the historical average for all months of May and extends the pattern of hot gains measured this way (charts 3–5). It was the same thing in April. Same in March. Same in February. Enough said, note the strong evidence of the pattern on core inflation readings consistently being well out of historical samples judged this way to evaluate fresh pressures at the margin rather than year-over-year rates that are less meaningful. The impact was at least partially predictable. Gilts hurled in technicolour with the two-year yield now 14bps higher on the day in a bear flattener move. The signalling and carry effect rippled through global bond markets.
Pricing for tomorrow’s BoE decision moved up by about 4bps and is now pricing a decent shot at a 50bps move which would up the pace again since the last 50bps move in February. No one within consensus is courageous enough to take the risk of calling for a 50bps move which makes for a rather bland consensus. The BoE has surprised before. Data has been resoundingly strong including wages, jobs and core inflation. Upping the pace now could mean not having to go as high as markets are pushing toward as I argued in my week ahead. There is also the race-against-the-clock argument that posits with each passing month that businesses, households and governments see inflation like this, they fall further into a state of disbelief toward the BoE’s 2% target and it becomes harder to achieve it over time as expectations shift. Just have a look at linkers that are signalling unmoored expectations that should very much concern the BoE. If the BoE wimps out with 25 then it’s another step toward never achieving their inflation target and lights out for the UK.
Terminal rate pricing also edged higher with 150bps of tightening priced with a peak Bank Rate of about 6% from 4.5% at present. Sterling, however, initially rallied but then sank to being among the worst performers to the USD on the day perhaps on concern that inflation will remain persistent, and the BoE will crush the economy.
The BoC’s not-minutes minutes aka the Summary of Deliberations arrive this afternoon (1:30pmET). Does the Governing Council have a bias toward tightening further or was this a one-more-and-done hike? How rich was the discussion around the neutral rate, given that DepGov Beaudry indicated that the risks to the 2–3% with a 2.5% midpoint estimates were skewed higher?
Fed Chair Powell delivers part 1 of his semi-annual testimony on monetary policy before Congress (10amET). Today he wakes up the House Financial Services Committee. Tomorrow he comes to play again before the Senate Banking Committee. I think he’ll largely repeat last week’s messages and so far did so in his opening testimony (here). Recall that the dot plot is showing 50bps of further hikes from here over the duration of this year’s four remaining meetings. Nine were in that camp, four expected 1 hike, two expected none and were cancelled out by two who leaned toward 75bps and one who threw caution to the wind with 100bps of further hikes (gimme a ‘B’, gimme a ‘u’….).
Brazil’s central bank is widely expected to extend its hold by e.o.d. today (5:30pmET) but may further soften guidance after previously saying that willingness to hike further if necessary was “a less likely scenario.” Inflation cooled since that meeting in May and is approaching the target.
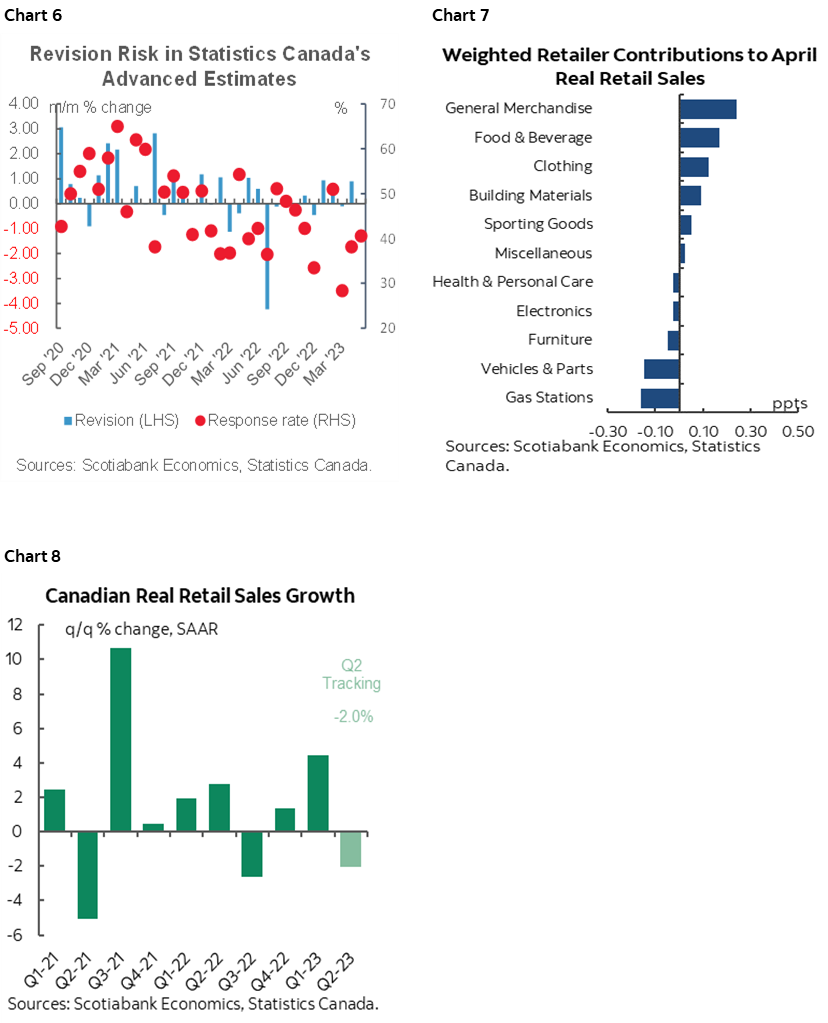
Finally, Canada updated retail sales both for April and May this morning. They offered a strong beat. Nominal sales were up by 1.1% m/m in April which shamed not only consensus (0.4%) but also Statcan’s ’flash’ guidance that had leaned toward a 0.5% rise. This continues the pattern of useless flash guidance (chart 6). Further, preliminary guidance for May points to a gain of 0.2% m/m and that should be taken with a mountain of salt given the flash’s reliability. Sales volumes were up 0.3% m/m in April which indicates that most of the 1.1% rise was due to higher prices, but still, volumes were expected to fall in April given the flash guidance and CPI for that month and so even on volumes it’s a strong beat. We don’t get useful details for May’s guidance. April’s breakdown of the weighted drivers to the mild gasin in sales volumes is shown in chart 7. Still, Q2 is very tentatively tracking a 2% q/q SAAR drop in sales volumes after a 4.4% Q1 gain and based upon an expected mild gain in May volumes and assuming June lands flat in order to focus the math upon the effects of what we know so far (chart 8). That Q2 softening could be a) tentative until further data into Spring, and b) reflect a rotation toward services spending in Q2 that is not captured in retail sales in Canada and c) could reflect a pulled-forward effect on sales growth in Q1.
DISCLAIMER
This report has been prepared by Scotiabank Economics as a resource for the clients of Scotiabank. Opinions, estimates and projections contained herein are our own as of the date hereof and are subject to change without notice. The information and opinions contained herein have been compiled or arrived at from sources believed reliable but no representation or warranty, express or implied, is made as to their accuracy or completeness. Neither Scotiabank nor any of its officers, directors, partners, employees or affiliates accepts any liability whatsoever for any direct or consequential loss arising from any use of this report or its contents.
These reports are provided to you for informational purposes only. This report is not, and is not constructed as, an offer to sell or solicitation of any offer to buy any financial instrument, nor shall this report be construed as an opinion as to whether you should enter into any swap or trading strategy involving a swap or any other transaction. The information contained in this report is not intended to be, and does not constitute, a recommendation of a swap or trading strategy involving a swap within the meaning of U.S. Commodity Futures Trading Commission Regulation 23.434 and Appendix A thereto. This material is not intended to be individually tailored to your needs or characteristics and should not be viewed as a “call to action” or suggestion that you enter into a swap or trading strategy involving a swap or any other transaction. Scotiabank may engage in transactions in a manner inconsistent with the views discussed this report and may have positions, or be in the process of acquiring or disposing of positions, referred to in this report.
Scotiabank, its affiliates and any of their respective officers, directors and employees may from time to time take positions in currencies, act as managers, co-managers or underwriters of a public offering or act as principals or agents, deal in, own or act as market makers or advisors, brokers or commercial and/or investment bankers in relation to securities or related derivatives. As a result of these actions, Scotiabank may receive remuneration. All Scotiabank products and services are subject to the terms of applicable agreements and local regulations. Officers, directors and employees of Scotiabank and its affiliates may serve as directors of corporations.
Any securities discussed in this report may not be suitable for all investors. Scotiabank recommends that investors independently evaluate any issuer and security discussed in this report, and consult with any advisors they deem necessary prior to making any investment.
This report and all information, opinions and conclusions contained in it are protected by copyright. This information may not be reproduced without the prior express written consent of Scotiabank.
™ Trademark of The Bank of Nova Scotia. Used under license, where applicable.
Scotiabank, together with “Global Banking and Markets”, is a marketing name for the global corporate and investment banking and capital markets businesses of The Bank of Nova Scotia and certain of its affiliates in the countries where they operate, including; Scotiabank Europe plc; Scotiabank (Ireland) Designated Activity Company; Scotiabank Inverlat S.A., Institución de Banca Múltiple, Grupo Financiero Scotiabank Inverlat, Scotia Inverlat Casa de Bolsa, S.A. de C.V., Grupo Financiero Scotiabank Inverlat, Scotia Inverlat Derivados S.A. de C.V. – all members of the Scotiabank group and authorized users of the Scotiabank mark. The Bank of Nova Scotia is incorporated in Canada with limited liability and is authorised and regulated by the Office of the Superintendent of Financial Institutions Canada. The Bank of Nova Scotia is authorized by the UK Prudential Regulation Authority and is subject to regulation by the UK Financial Conduct Authority and limited regulation by the UK Prudential Regulation Authority. Details about the extent of The Bank of Nova Scotia's regulation by the UK Prudential Regulation Authority are available from us on request. Scotiabank Europe plc is authorized by the UK Prudential Regulation Authority and regulated by the UK Financial Conduct Authority and the UK Prudential Regulation Authority.
Scotiabank Inverlat, S.A., Scotia Inverlat Casa de Bolsa, S.A. de C.V, Grupo Financiero Scotiabank Inverlat, and Scotia Inverlat Derivados, S.A. de C.V., are each authorized and regulated by the Mexican financial authorities.
Not all products and services are offered in all jurisdictions. Services described are available in jurisdictions where permitted by law.