ON DECK FOR FRIDAY, FEBRUARY 3
KEY POINTS:
- Risk-off driven by US earnings, ahead of payrolls
- Markets may be more positioned for nonfarm downside than upside
- Advance nonfarm indicators are mixed
- Hype versus caution around potential nonfarm revisions
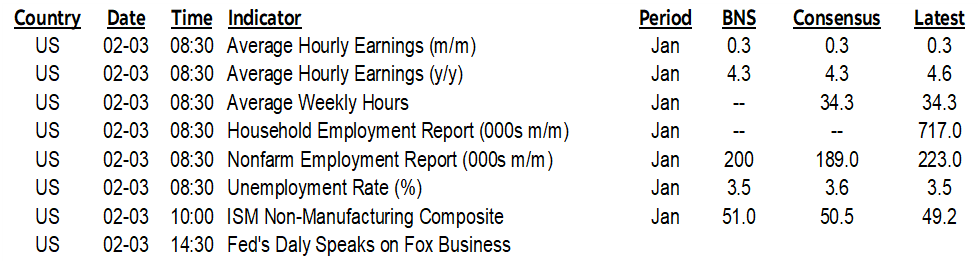
Risk-off sentiment follows a round of weak earnings reports last evening ahead of US nonfarm payrolls (8:30amET). The decks are otherwise cleared for payrolls with nothing else on tap by way of calendar-based macro or earnings risk today as I think ISM-services (10amET) may fade in the background to payrolls.
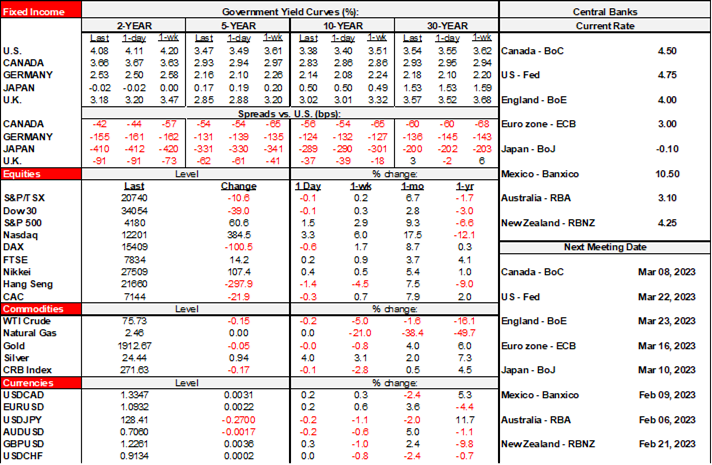
US equity futures are down by nearly 1% for snps to over 1½% for the Nasdaq while Canadian futures are little changed and European cash markets are slightly lower except for a mild gain in London. Sovereign curves are mixed with slight richening at the US front-end and in gilts, versus slight cheapening across EGBs. The USD is slightly softer and mostly due to mild gains by the euro, sterling and yen versus softening across higher beta crosses.
After such massive market moves in the wake of the Fed and ECB, bonds appear to be better positioned for a bad US payrolls report to end the week, but vulnerable to signs of resilience through some combination of revisions not being as bad as feared and/or January payrolls popping higher than expected. How stocks could react isn’t clear in that a solid report could reinforce further Fed hikes but allay recession concerns, while a bad report could do the opposite. Maybe the best outcome for all would be to walk up the moderate middle.
The indicators tracked below are more divided than usual which may be a sign of an inflection point. The pattern to date has emphasized steady beats in eleven of the past twelve payroll reports. There is also a +/-120k 90% confidence interval around any monthly change in payrolls so the noise factor is always high. Then layer on the fact that revisions could really complicate this one (see below).
NONFARM EXPECTATIONS
Consensus median: 189k
Consensus mean: 197k (ie: no material skewness)
Scotia: 200k
Trimmed range: 150k–250k
Std dev: 39k
Whisper number: 197k
UR: 3.6% from 3.5% prior (Scotia 3.5%)
Wages m/m: 0.3% m/m (Scotia same)
MIXED DRIVERS
On the plus side:
- JOLTS vacancies moved up in Dec
- NFIB hiring plans inched back up to 19 in Jan from 17. Hard to fill also moved up to 45 from 41.
- Consumer confidence jobs plentiful moved up to 48.2 in January from 46.4 prior, confirming rise in vacancies and hiring plans
- initial claims fell by roughly 20k between nonfarm reference periods in Jan over Dec
- ISM-mfrg-employment slipped to 50.6 from 51.4, but still indicating positive mfrg emp growth
On the negative side:
- ADP disappointed at 106k. Improbable but not impossible odds nonfarm lands at consensus or higher but ADP is shaky at best.
- Challenger layoffs topping 100k in January. That doesn’t mean they immediately show up in jobs partly given how the reference period works.
The wildcards:
- revisions. The annual benchmarking exercises put everything up in the air including the cumulative path to date and the year-end jumping off point from 2022 into January 2023. Scroll back up to see the rant about revisions.
- ISM-services-employment doesn’t arrive until after nonfarm today, so we lack this reading for the service sector. Sometimes it arrives before, sometimes after nonfarm.
ANNUAL REVISIONS—HYPE VERSUS UNCERTAINTY
Today’s payrolls will incorporate annual benchmark revisions that could get at least as much if not more attention than the January estimates.
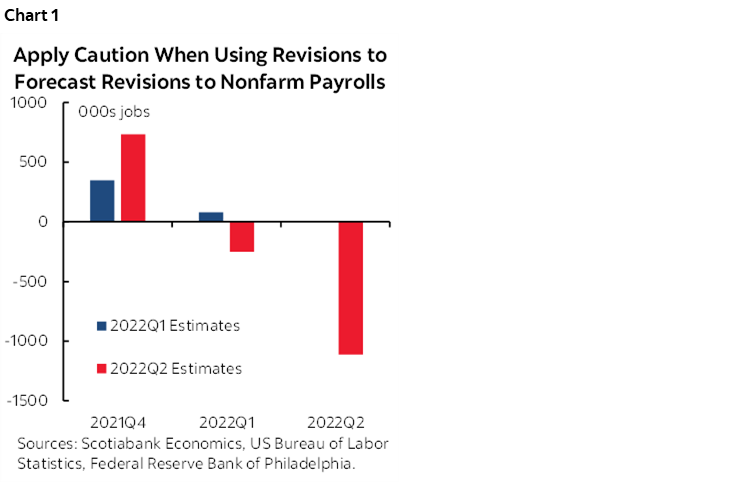
I wrote about this on December 22nd in the week ahead (here). At the time, economists at the Philly Fed had released another update of their analysis of revisions using alternative source data that only goes up to 2022Q2 (here and here). Based on their alternative approach, they said payrolls could be revised down from a currently estimated Q2 gain of 1.122 million to practically zero (+10k). There were headlines about this at the time while the usual blogger universe ran with it, some of which were more intelligent and less political than others.
If their analysis is true, then it could be a big deal to markets today. It’s a welcome addition to the analysis but I can’t help but feel that the economists overstated their case.
Cautionary points I made at the time are nevertheless still valid now:
- the Philly Fed folks are using alternative data sources that are subject to their own big revisions in order to forecast revisions to payrolls. Huh? I don’t know how they can have such implied faith that their own data won’t be revised as they make claims about pending revisions to payrolls.
- as a case in point, their analysis for the prior Q1 had previously said payrolls were underestimating their sources for Q1 job growth by 81k but then in the Q2 report they said Q1 payrolls were instead overestimating job growth by 253k for a net swing of 334k. If their alternative sources for estimating job growth are susceptible to being revised by hundreds of thousands of jobs in a single quarter then shouldn’t you be more circumspect and careful?
- As another example, their initial analysis in 22Q1 for 2021Q4 had indicated that payrolls were underestimating job growth by 348k that quarter. When they revised that analysis for 2021Q4 in 2022Q2, suddenly payrolls were underestimating job growth by comparison to their sources by 733k jobs, or more than double their initial estimate! So during the first two quarters that they began to publish this work their alternative sources were revised by an absolute value equal to 719,000 jobs!! And you think nonfarm has issues??
The figures are shown in chart 1. So what’s the bottom line? I would expect negative revisions today. At this point in the cycle that wouldn’t be terribly surprising. It would be a shock if the figures are instead revised to be stronger. I have no idea by how much they are likely to be revised. I don’t trust a process that uses often heavily revised alternative data to make overly strident claims in forecasting the magnitude of revisions to nonfarm payrolls. We simply have to wait and see how the full suite of numbers across months and quarters change.
Whatever the outcome, expect the distinct possibility of greater than usual market volatility around the nonfarm release because of this issue.
DISCLAIMER
This report has been prepared by Scotiabank Economics as a resource for the clients of Scotiabank. Opinions, estimates and projections contained herein are our own as of the date hereof and are subject to change without notice. The information and opinions contained herein have been compiled or arrived at from sources believed reliable but no representation or warranty, express or implied, is made as to their accuracy or completeness. Neither Scotiabank nor any of its officers, directors, partners, employees or affiliates accepts any liability whatsoever for any direct or consequential loss arising from any use of this report or its contents.
These reports are provided to you for informational purposes only. This report is not, and is not constructed as, an offer to sell or solicitation of any offer to buy any financial instrument, nor shall this report be construed as an opinion as to whether you should enter into any swap or trading strategy involving a swap or any other transaction. The information contained in this report is not intended to be, and does not constitute, a recommendation of a swap or trading strategy involving a swap within the meaning of U.S. Commodity Futures Trading Commission Regulation 23.434 and Appendix A thereto. This material is not intended to be individually tailored to your needs or characteristics and should not be viewed as a “call to action” or suggestion that you enter into a swap or trading strategy involving a swap or any other transaction. Scotiabank may engage in transactions in a manner inconsistent with the views discussed this report and may have positions, or be in the process of acquiring or disposing of positions, referred to in this report.
Scotiabank, its affiliates and any of their respective officers, directors and employees may from time to time take positions in currencies, act as managers, co-managers or underwriters of a public offering or act as principals or agents, deal in, own or act as market makers or advisors, brokers or commercial and/or investment bankers in relation to securities or related derivatives. As a result of these actions, Scotiabank may receive remuneration. All Scotiabank products and services are subject to the terms of applicable agreements and local regulations. Officers, directors and employees of Scotiabank and its affiliates may serve as directors of corporations.
Any securities discussed in this report may not be suitable for all investors. Scotiabank recommends that investors independently evaluate any issuer and security discussed in this report, and consult with any advisors they deem necessary prior to making any investment.
This report and all information, opinions and conclusions contained in it are protected by copyright. This information may not be reproduced without the prior express written consent of Scotiabank.
™ Trademark of The Bank of Nova Scotia. Used under license, where applicable.
Scotiabank, together with “Global Banking and Markets”, is a marketing name for the global corporate and investment banking and capital markets businesses of The Bank of Nova Scotia and certain of its affiliates in the countries where they operate, including; Scotiabank Europe plc; Scotiabank (Ireland) Designated Activity Company; Scotiabank Inverlat S.A., Institución de Banca Múltiple, Grupo Financiero Scotiabank Inverlat, Scotia Inverlat Casa de Bolsa, S.A. de C.V., Grupo Financiero Scotiabank Inverlat, Scotia Inverlat Derivados S.A. de C.V. – all members of the Scotiabank group and authorized users of the Scotiabank mark. The Bank of Nova Scotia is incorporated in Canada with limited liability and is authorised and regulated by the Office of the Superintendent of Financial Institutions Canada. The Bank of Nova Scotia is authorized by the UK Prudential Regulation Authority and is subject to regulation by the UK Financial Conduct Authority and limited regulation by the UK Prudential Regulation Authority. Details about the extent of The Bank of Nova Scotia's regulation by the UK Prudential Regulation Authority are available from us on request. Scotiabank Europe plc is authorized by the UK Prudential Regulation Authority and regulated by the UK Financial Conduct Authority and the UK Prudential Regulation Authority.
Scotiabank Inverlat, S.A., Scotia Inverlat Casa de Bolsa, S.A. de C.V, Grupo Financiero Scotiabank Inverlat, and Scotia Inverlat Derivados, S.A. de C.V., are each authorized and regulated by the Mexican financial authorities.
Not all products and services are offered in all jurisdictions. Services described are available in jurisdictions where permitted by law.