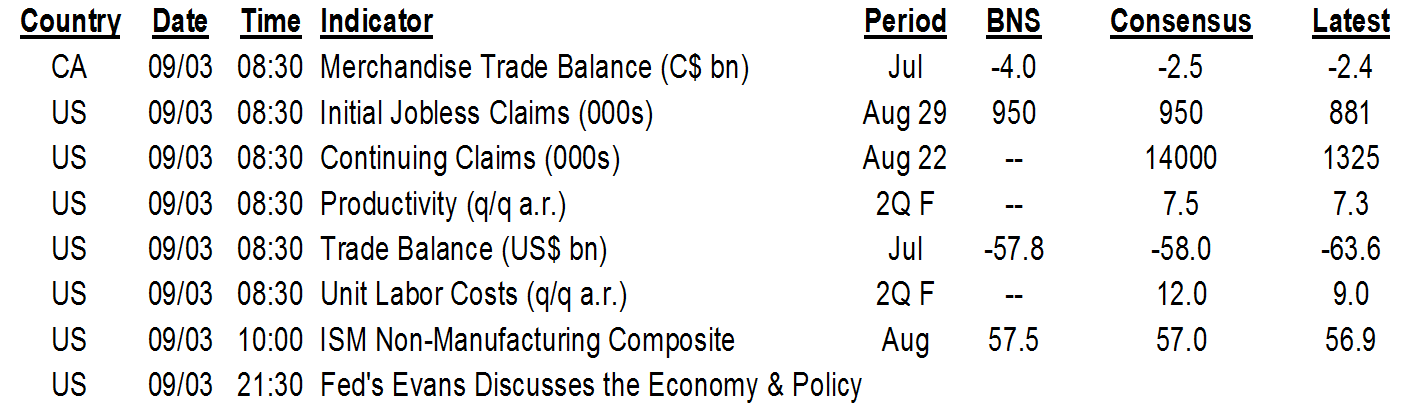
ON DECK FOR THURSDAY, SEPTEMBER 3
KEY POINTS:
- Markets passing time ahead of nonfarm
- An evaluation of Trump’s polling
- US claims drop again…
- ...and a methodological change likely doesn’t explain it away
- US ISM-services slipped a touch
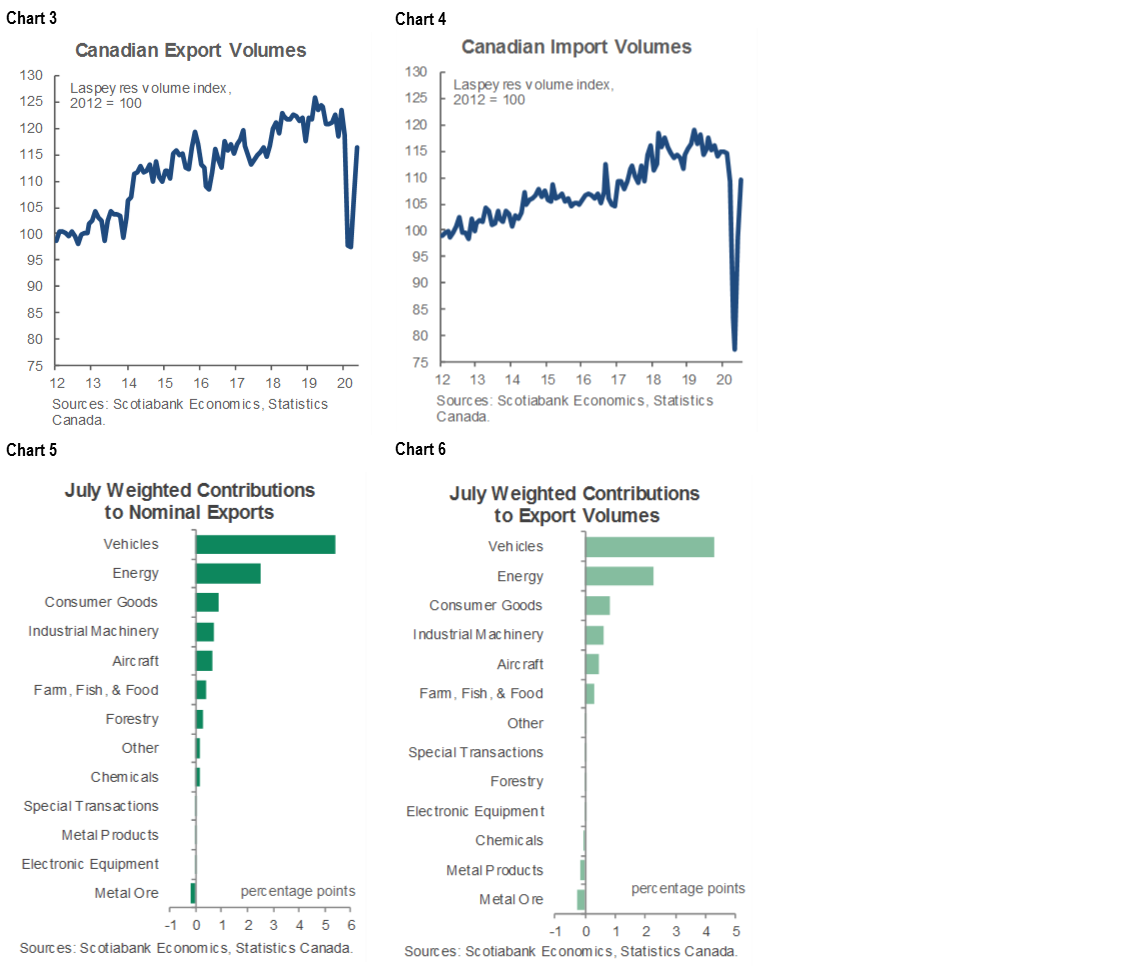
- Canadian exports and imports go ‘V’
- US trade deficit widens more than expected…
- …as services surpluses are revised lower
INTERNATIONAL
Risk-on sentiment is mostly focused upon European equities and driven by a) catch-up to yesterday afternoon’s US rally on suspect CDC headlines, b) growing speculation the ECB may add to stimulus ahead of next week’s meeting, and c) France added stimulus measures that were anticipated for some time including some tax cuts and wage subsidies plus spending on the environment. US equity futures are less impressed as they consolidate yesterday’s gain and have an eye on some data teasers today ahead of nonfarm tomorrow. Bouncing around in the background are virus vaccine headlines with very rushed clinical trial results from around the world about to flood the markets over the weeks and months ahead. You first, I say. Nothing personal and I’m certainly no anti-vaxxer type. It’s just that I fully intend to go out of this world with the same number of limbs that I had coming into it, no more and no less.
- European equities are up by between ¼% (London, Milan) and 1% – 1½% (Paris, Madrid). Asian equities were mixed as Tokyo rallied 1% and Seoul was up by 1.3%, but HK fell ½% and mainland China was off by ½% to ¾%. US equities are slipping with the S&P500 down by over 1% so far after yesterday’s gain and the TSX is only a hair’s width lower. Recall that a driver was the fishy headline that the CDC is asking states to be ready to roll-out vaccines by November 1st but that’s just a logistical preparatory step in advance of hypothetically delivering vaccinations.
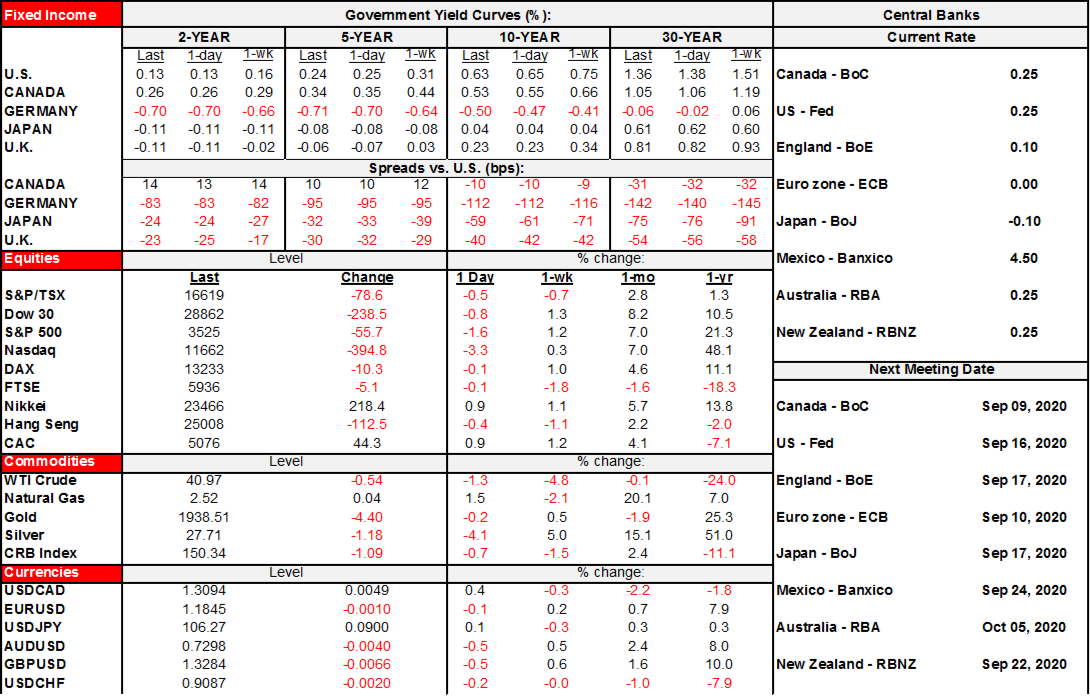
- Sovereign bond curves shifted to mild flatteners after US data this morning. US 10s and 30s are down by about 1bp with Canada performing similarly. Gilts are flat but EGB 10s and 30s are rallying by 1–3bps.
- Oil prices are off by about 1 ½% and gold is down by underw ½%.
- The USD is picking up some steam again. Most major and semi-major currency pairs are depreciating except for the Mexican peso, rand and Swiss franc that are gaining. The weakest tend to be the commodity oriented ones, but the euro and sterling are also down.
Overnight releases had little to offer and were mixed with the focus being upon PMIs that favoured China.
China’s private PMI composite improved to 55.1 (54.5 prior) to signal slight acceleration in growth after the state’s composite PMI climbed by less (54.5 from 54.1) at the start of the week. The private PMI is more skewed toward smaller producers in coastal export-oriented areas whereas the state’s is more skewed to SOEs.
The UK composite PMI was revised in the other direction and fell by over a point (59.1, 60.3 prior) as the services PMI was revised lower by 1.3 points. The revision still leaves intact a gain compared to the prior month and is higher than before the pandemic struck, but less so than originally estimated.
The composite Eurozone PMI was revised up to 51.9 from 51.6 as the services PMI was revised higher. Unlike the UK, the Eurozone composite PMI slipped in August compared to the prior month. Why? Germany’s gain was offset by weaker PMIs out of Spain and Italy that fell back into contraction. With France’s composite PMI still signalling marginal growth.
UNITED STATES
As fresh polls arrive daily, it may be worth noting two things. One is that individual polls are volatile so look at averages instead. Chart 1 shows that the average poll is resulting in identical results for Trump now as it indicated to the exact same point in the 2016 campaign.
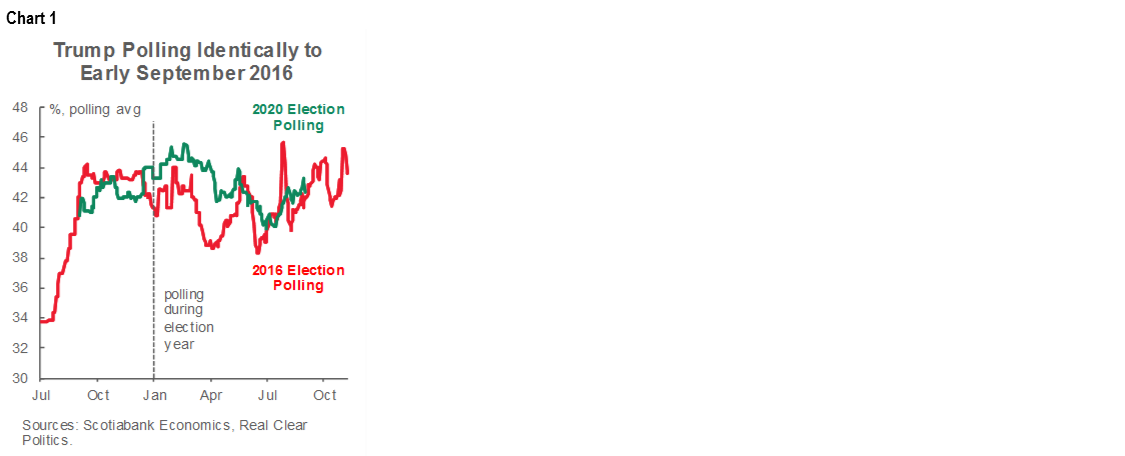
Polling the share of the popular vote is meaningless in the US, however, given its Electoral College system. As a reminder, Nate Silver's site (here) is running daily US election simulations again. Yes I know they got it wrong in 2016. Still, if you're going to follow guesses at who will win, then this approach is superior to the polling results we're getting by the day because 538's scenarios weight the projections to electoral college votes and run repeated simulations. 70 times out of 100 in repeated sampling they get a Biden win fwiw. It might be too early for Bill Clinton to be doing victory laps with sandbag jokes mind you and given the 2016 failure of both methodologies using popular vote shares and weighted projections.
US jobless claims fell to 881k (1.011 million prior, consensus 950k) but a change to the seasonal adjustment methodology clouds the interpretation of its significance by creating a break in the series. I’m not sure how significant that is, mind you, given that seasonally unadjusted claims have generally tracked adjusted claims and they too were running at 833k last week. It may be that the SA adjustments are just designed to narrow some of the modest deviations between the SA and NSA figures compared to history (chart 2). Regardless, we’re outside of the reference period for tomorrow’s nonfarm payrolls report so it doesn’t matter for the call. As for the next nonfarm report (September’s, one month from now), claims are only one driver and not a very useful one at that.

US ISM services slipped in line with consensus expectations from 58.1 to 56.9 in August (57.0 consensus). Recall that the ISM headline is a straight arithmetic average of new orders, production, employment and supplier deliveries. So, what drove the headline slippage was softer business activity/production (62.4 from 67.2) and softer new orders (56.8 from 67.7) but offsetting these in part were gains in employment (47.9 from 42.1) and supplier deliveries (60.5 from 55.2).
The US all-in trade deficit widened by more than expected to -US$63.6 billion in July (-$58B consensus). It wasn’t a surprise to revisions for the advance estimate of the goods balance that drove this as the goods balance was revised to be only slightly wider at -US$80.9 billion compared to last week’s advance figure of -US$79.3 billion. Instead, the normally fairly stable services surplus landed lower than expected and was revised lower stretching back throughout the pandemic. Instead of a services surplus of US$21.5 billion in June, for example, it’s now a surplus of US$18.2 billion. That services surplus fell by almost another billion in July.
CANADA
Canada’s trade deficit improved through a combination of revisions and a July tally that was in line with the consensus estimate despite the fact that the starting point was revised to be so different. Instead of a monthly deficit of C$3.2 billion in June, the revision chopped that number in half.
Regardless, it’s the v-shaped recovery in exports and imports that is the focus here (charts 3, 4). Export volumes were up by 8.6% m/m and import volumes were up by 11.2% m/m. Quarterly tracking of export volumes is pointing toward a 64% annualized jump in Q3 after a 51% annualized drop in Q2. Quarterly tracking of import volumes is point toward a 169% annualized increase in Q3 after a 66% annualized plunge in Q2. The drivers of the monthly change in export and import volumes are broken down in weighted terms in charts 5 and 6.
DISCLAIMER
This report has been prepared by Scotiabank Economics as a resource for the clients of Scotiabank. Opinions, estimates and projections contained herein are our own as of the date hereof and are subject to change without notice. The information and opinions contained herein have been compiled or arrived at from sources believed reliable but no representation or warranty, express or implied, is made as to their accuracy or completeness. Neither Scotiabank nor any of its officers, directors, partners, employees or affiliates accepts any liability whatsoever for any direct or consequential loss arising from any use of this report or its contents.
These reports are provided to you for informational purposes only. This report is not, and is not constructed as, an offer to sell or solicitation of any offer to buy any financial instrument, nor shall this report be construed as an opinion as to whether you should enter into any swap or trading strategy involving a swap or any other transaction. The information contained in this report is not intended to be, and does not constitute, a recommendation of a swap or trading strategy involving a swap within the meaning of U.S. Commodity Futures Trading Commission Regulation 23.434 and Appendix A thereto. This material is not intended to be individually tailored to your needs or characteristics and should not be viewed as a “call to action” or suggestion that you enter into a swap or trading strategy involving a swap or any other transaction. Scotiabank may engage in transactions in a manner inconsistent with the views discussed this report and may have positions, or be in the process of acquiring or disposing of positions, referred to in this report.
Scotiabank, its affiliates and any of their respective officers, directors and employees may from time to time take positions in currencies, act as managers, co-managers or underwriters of a public offering or act as principals or agents, deal in, own or act as market makers or advisors, brokers or commercial and/or investment bankers in relation to securities or related derivatives. As a result of these actions, Scotiabank may receive remuneration. All Scotiabank products and services are subject to the terms of applicable agreements and local regulations. Officers, directors and employees of Scotiabank and its affiliates may serve as directors of corporations.
Any securities discussed in this report may not be suitable for all investors. Scotiabank recommends that investors independently evaluate any issuer and security discussed in this report, and consult with any advisors they deem necessary prior to making any investment.
This report and all information, opinions and conclusions contained in it are protected by copyright. This information may not be reproduced without the prior express written consent of Scotiabank.
™ Trademark of The Bank of Nova Scotia. Used under license, where applicable.
Scotiabank, together with “Global Banking and Markets”, is a marketing name for the global corporate and investment banking and capital markets businesses of The Bank of Nova Scotia and certain of its affiliates in the countries where they operate, including, Scotiabanc Inc.; Citadel Hill Advisors L.L.C.; The Bank of Nova Scotia Trust Company of New York; Scotiabank Europe plc; Scotiabank (Ireland) Limited; Scotiabank Inverlat S.A., Institución de Banca Múltiple, Scotia Inverlat Casa de Bolsa S.A. de C.V., Scotia Inverlat Derivados S.A. de C.V. – all members of the Scotiabank group and authorized users of the Scotiabank mark. The Bank of Nova Scotia is incorporated in Canada with limited liability and is authorised and regulated by the Office of the Superintendent of Financial Institutions Canada. The Bank of Nova Scotia is authorised by the UK Prudential Regulation Authority and is subject to regulation by the UK Financial Conduct Authority and limited regulation by the UK Prudential Regulation Authority. Details about the extent of The Bank of Nova Scotia's regulation by the UK Prudential Regulation Authority are available from us on request. Scotiabank Europe plc is authorised by the UK Prudential Regulation Authority and regulated by the UK Financial Conduct Authority and the UK Prudential Regulation Authority.
Scotiabank Inverlat, S.A., Scotia Inverlat Casa de Bolsa, S.A. de C.V., and Scotia Derivados, S.A. de C.V., are each authorized and regulated by the Mexican financial authorities.
Not all products and services are offered in all jurisdictions. Services described are available in jurisdictions where permitted by law.