CANADA HOUSING MARKET: BACK TO THE PEAK WE GO
SUMMARY
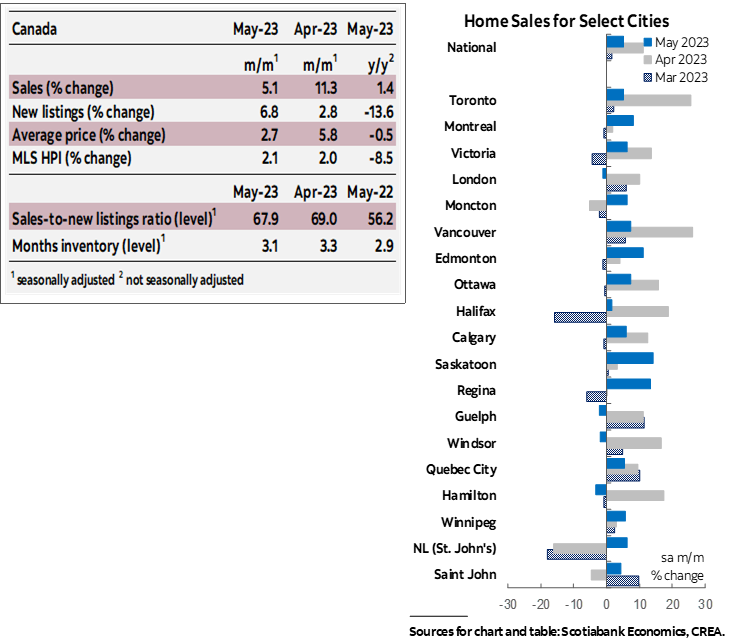
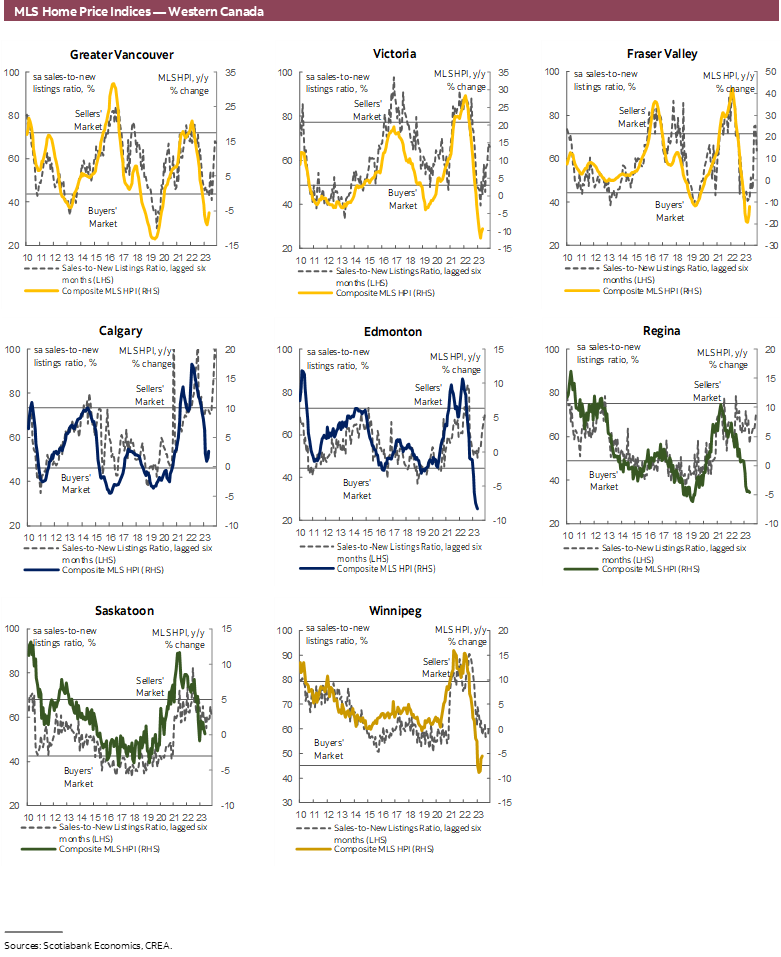
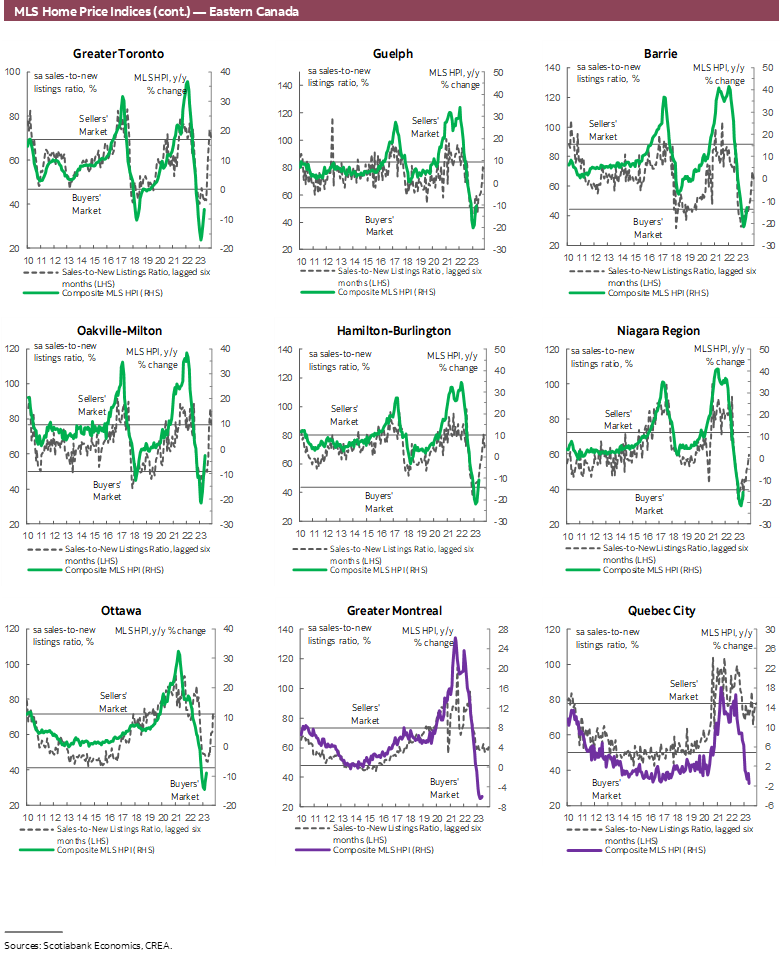
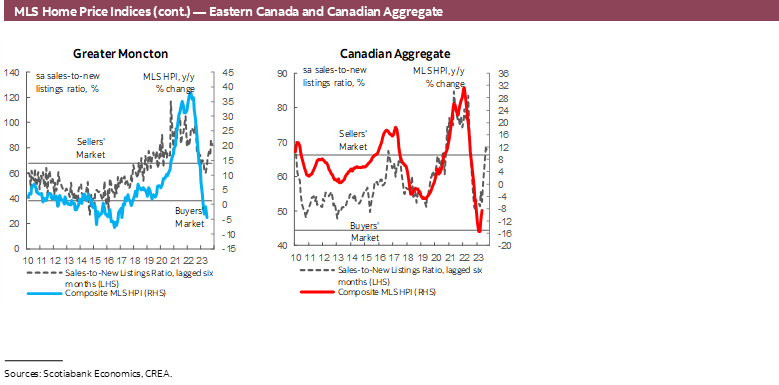
Canadian home sales increased again in May, rising by 5.1% (sa m/m), accompanied by a slightly larger increase of 6.8% in listings. This left the sales-to-new listings ratio, an indicator of how tight the market is, relatively unchanged from April when it had reached 69%, reflecting a sharp and rapid tightening in market conditions following a period of normalization near its long-term average of 55%, down from record highs during the pandemic. The ratio stands at 67.9% as of May, a level that implies the national housing market is in sellers’ territory, which it returned to in April after a few months’ reprieve in the balanced territory range. Months of inventory also continued reversing the improvements from its record lows since the fall of 2021, declining for the fourth month in a row and reaching 3.1 months—almost two months below its long-term average.
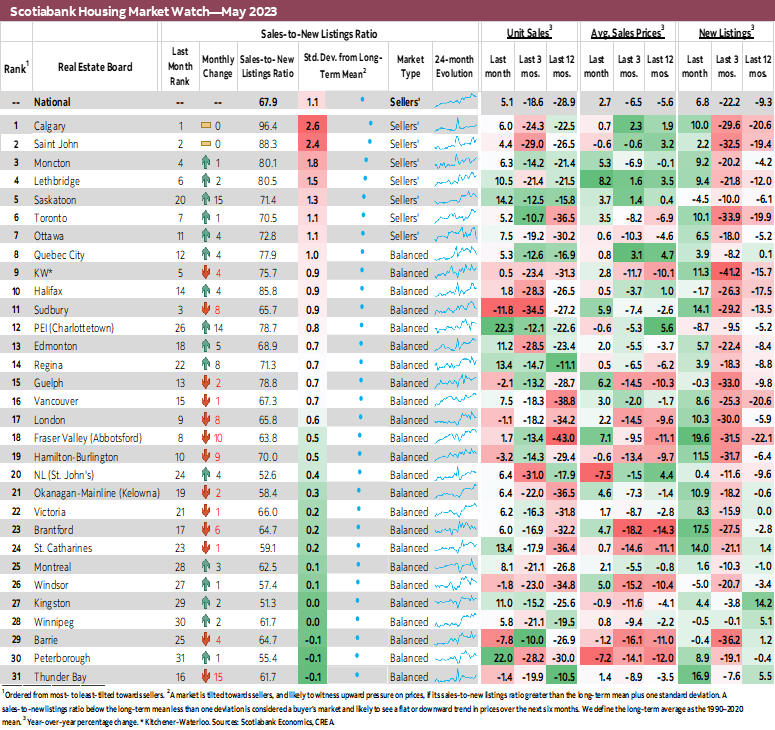
The increases in sales and listings were fairly widespread across the local markets we track. Sales and listings increased in 24 of the 31 local markets we track, with 20 of these markets seeing both increase at the same time—indicating immediate absorption of new supply arriving to the market given pent-up demand. While it did little to ease pressures at the national level, the increase in listings this month did return some markets to balanced territory, with now only 7 markets in sellers’ territory, compared to 12 in March.
Prices, as measured by the MLS Home Price Index (HPI), increased by 2.1% (sa m/m) in May. This would be the second significant monthly increase in a row following 12 months of declines, with March’s increase revised down to a small decline, from 0.6% to -0.2%, and April’s increase revised up from 1.6% to 2%. Two consecutive increases of 2% in the HPI are not to be taken lightly! May’s increase was again led by single-family homes (2.6%), while the townhome and apartment segments both appreciated by 1.5%. Apartments saw the most acceleration in monthly price gains, having ticked up from 0.8% in April. With this month’s results, the MLS HPI is drifting further from its pre-pandemic levels, now sitting at 36% above, reducing the correction from its February 2022 peak to only 12% (the trough reached in March 2023 was 15% below the peak).
IMPLICATIONS
As expected, the recent strength in Canada’s housing market continued through May. National home sales in May extended the longest stretch of consecutive increases since the housing market began its correction stage in February 2022, starting with small upticks in February and March of this year, followed by a staggering double-digit increase in April. This coincided with a similar, slightly larger, increase in listings, which did little to offset previous declines and bring more balance to the market. The result was a second monthly increase in the MLS Home Price Index (HPI) of magnitudes seen during the height of the housing market rally.
We have been expecting a stabilization in housing activity and an eventual uptick in demand and prices, driven by pent-up demand and strong immigration combined with limited supply. However, the magnitude and speed in which this seems to be happening surpass our previous expectations. While this points to resiliency and strong household finances, it also poses additional challenges for the Bank of Canada as it tries to slow down the economy and bring inflation back to its 2% target.
Indeed, the continued strength in May, which was evident leading up to the Bank of Canada’s decision last week given early data releases from the country’s major real estate markets (see here), suggested housing-related activity may stop being the drag on growth it had been for much of last year. This, among other things, called for the hike that we saw last week—the impact of which on the housing market is too soon to observe in the data.
At least part of the recent strength in the housing market has been driven by buyers who came back to the market once rates stabilized and given earlier market pricing of cuts which translated into a reduction in fixed rates. These buyers had amassed larger down payments during the slowdown, and were therefore equipped to join the market once signs of the end of the correction emerged, encouraged by the widespread conviction at the time that the Bank is done hiking and cuts are imminent. By hiking last week, the Bank raised borrowing costs, directly through higher variable mortgage rates and indirectly via communications leading up to the decision where we’ve seen market pricing and therefore fixed rates go up. The Bank also signalled that the pause may be over by leaving the door open for further hikes, which would help thwart the speculative activity that has been counting on rates stabilizing and declining sooner than what is now clearly the case. Combined, this would both help slow down the reheating in the housing market, which is necessary in this inflation fighting environment as the Bank can ill afford to have the most rate sensitive part of the economy (housing) roar back when they are trying to slow growth and bring inflation back to target, and help dampen housing affordability and stability concerns.
This matters since without a concurrent meaningful increase in supply, continued strength on the demand side would reintroduce imbalances to the market and show up as meaningful increases in prices instead, further delaying the needed improvement in housing affordability conditions. Despite May’s increase, new listings were still 18% below their 2000–2019 average for the month of May, while the sales increases of the last 4 months brought them in line with the 10-year average for the month.
DISCLAIMER
This report has been prepared by Scotiabank Economics as a resource for the clients of Scotiabank. Opinions, estimates and projections contained herein are our own as of the date hereof and are subject to change without notice. The information and opinions contained herein have been compiled or arrived at from sources believed reliable but no representation or warranty, express or implied, is made as to their accuracy or completeness. Neither Scotiabank nor any of its officers, directors, partners, employees or affiliates accepts any liability whatsoever for any direct or consequential loss arising from any use of this report or its contents.
These reports are provided to you for informational purposes only. This report is not, and is not constructed as, an offer to sell or solicitation of any offer to buy any financial instrument, nor shall this report be construed as an opinion as to whether you should enter into any swap or trading strategy involving a swap or any other transaction. The information contained in this report is not intended to be, and does not constitute, a recommendation of a swap or trading strategy involving a swap within the meaning of U.S. Commodity Futures Trading Commission Regulation 23.434 and Appendix A thereto. This material is not intended to be individually tailored to your needs or characteristics and should not be viewed as a “call to action” or suggestion that you enter into a swap or trading strategy involving a swap or any other transaction. Scotiabank may engage in transactions in a manner inconsistent with the views discussed this report and may have positions, or be in the process of acquiring or disposing of positions, referred to in this report.
Scotiabank, its affiliates and any of their respective officers, directors and employees may from time to time take positions in currencies, act as managers, co-managers or underwriters of a public offering or act as principals or agents, deal in, own or act as market makers or advisors, brokers or commercial and/or investment bankers in relation to securities or related derivatives. As a result of these actions, Scotiabank may receive remuneration. All Scotiabank products and services are subject to the terms of applicable agreements and local regulations. Officers, directors and employees of Scotiabank and its affiliates may serve as directors of corporations.
Any securities discussed in this report may not be suitable for all investors. Scotiabank recommends that investors independently evaluate any issuer and security discussed in this report, and consult with any advisors they deem necessary prior to making any investment.
This report and all information, opinions and conclusions contained in it are protected by copyright. This information may not be reproduced without the prior express written consent of Scotiabank.
™ Trademark of The Bank of Nova Scotia. Used under license, where applicable.
Scotiabank, together with “Global Banking and Markets”, is a marketing name for the global corporate and investment banking and capital markets businesses of The Bank of Nova Scotia and certain of its affiliates in the countries where they operate, including; Scotiabank Europe plc; Scotiabank (Ireland) Designated Activity Company; Scotiabank Inverlat S.A., Institución de Banca Múltiple, Grupo Financiero Scotiabank Inverlat, Scotia Inverlat Casa de Bolsa, S.A. de C.V., Grupo Financiero Scotiabank Inverlat, Scotia Inverlat Derivados S.A. de C.V. – all members of the Scotiabank group and authorized users of the Scotiabank mark. The Bank of Nova Scotia is incorporated in Canada with limited liability and is authorised and regulated by the Office of the Superintendent of Financial Institutions Canada. The Bank of Nova Scotia is authorized by the UK Prudential Regulation Authority and is subject to regulation by the UK Financial Conduct Authority and limited regulation by the UK Prudential Regulation Authority. Details about the extent of The Bank of Nova Scotia's regulation by the UK Prudential Regulation Authority are available from us on request. Scotiabank Europe plc is authorized by the UK Prudential Regulation Authority and regulated by the UK Financial Conduct Authority and the UK Prudential Regulation Authority.
Scotiabank Inverlat, S.A., Scotia Inverlat Casa de Bolsa, S.A. de C.V, Grupo Financiero Scotiabank Inverlat, and Scotia Inverlat Derivados, S.A. de C.V., are each authorized and regulated by the Mexican financial authorities.
Not all products and services are offered in all jurisdictions. Services described are available in jurisdictions where permitted by law.