CANADA HOUSING MARKET: SHORT-TERM PAIN, LONG-TERM GAIN?
SUMMARY
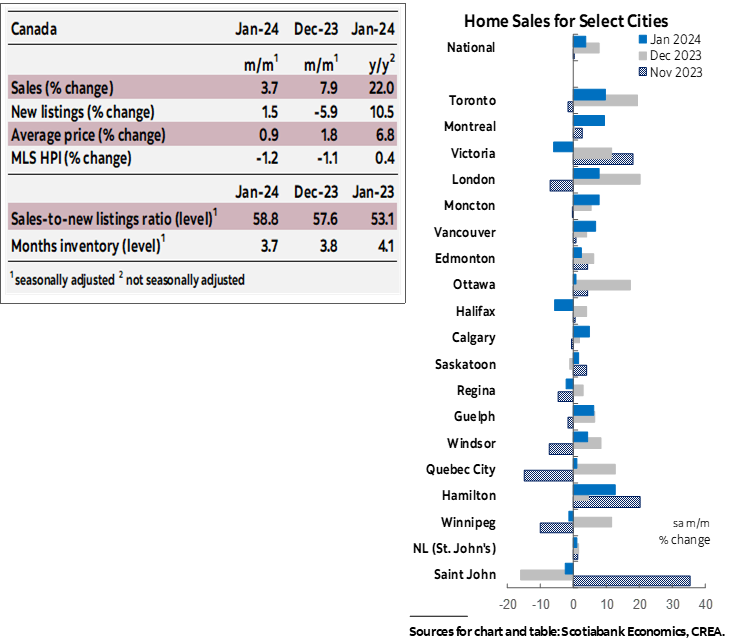
Canadian home sales increased by 3.7% (sa m/m) in January. New listings followed suit, increasing by a smaller 1.5%. The larger increase in sales following last month’s jump has further tightened the sales-to-new listings ratio, an indicator of how tight the market is, to 58.8%, pushing it further above its long-term average of 55% after having been below during the 3 months before December. Still, the national market remained in balanced territory relative to historical standards. There were 3.7 months of inventory—down from November’s peak of 4.1 and over a month below its long-term average of around five months.
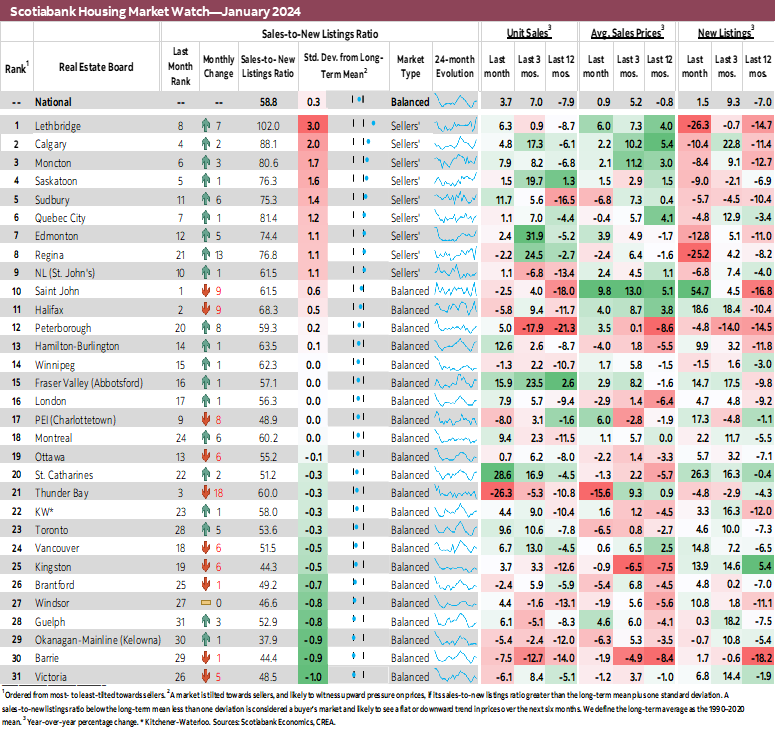
Sales increased in two thirds of the 31 local markets we track. St. Catharines led the increases with 28.6% (sa m/m), followed by Ontario markets including Toronto, as well as Fraser Valley and Montreal (15.9% and 9.4%). This more than offset a 26% decline in Thunder Bay and south of 10% declines in the remaining 9 markets. January’s level of sales was 1.48% below the 2010–19 average level observed for this month, more in line with historical averages relative to previous months.
Listings increased in over half (18) of the local markets we track, 12 of those witnessed sales increases also. The number of newly listed properties increased by 54.7% in Saint John followed by 26.3% (sa m/m) in St. Catharines and smaller double-digit increases in Halifax, Charlottetown, Vancouver, Fraser Valley, Kingston and Windsor. This puts January’s level of listings around 7% below the 2010–19 average level observed for this month. Given the movements in sales and listings, 22 markets were in balanced territory in January relative to 25 in December, while 9 were in sellers’ territory relative to 4 in December. Guelph and Kelowna which were in buyers' territory in December moved to balanced in January.
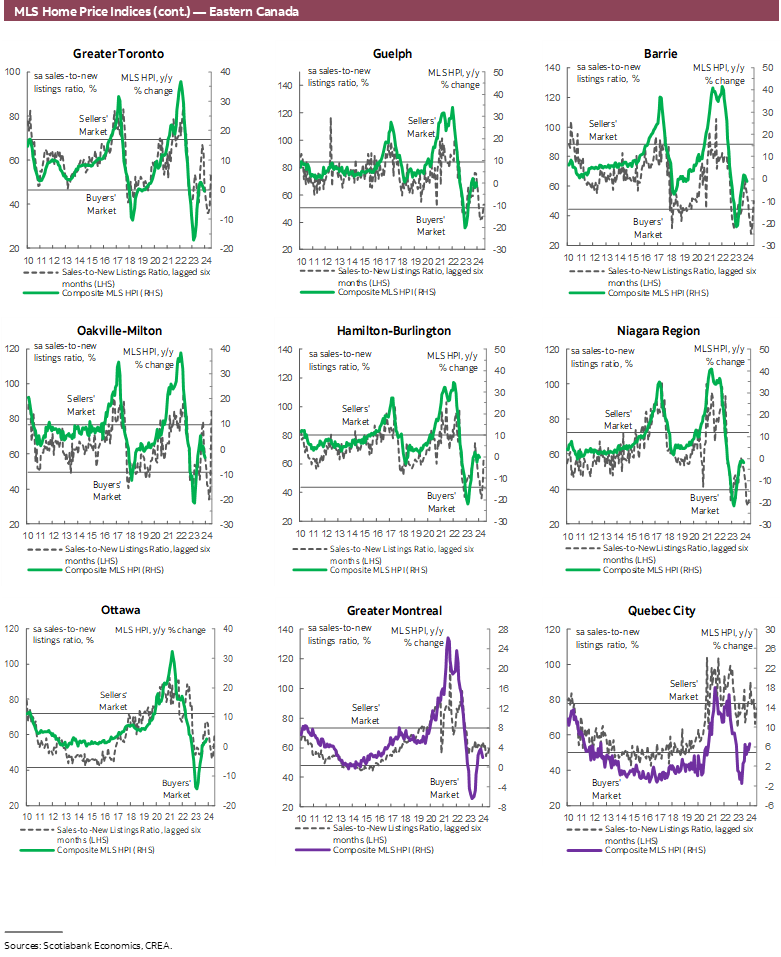
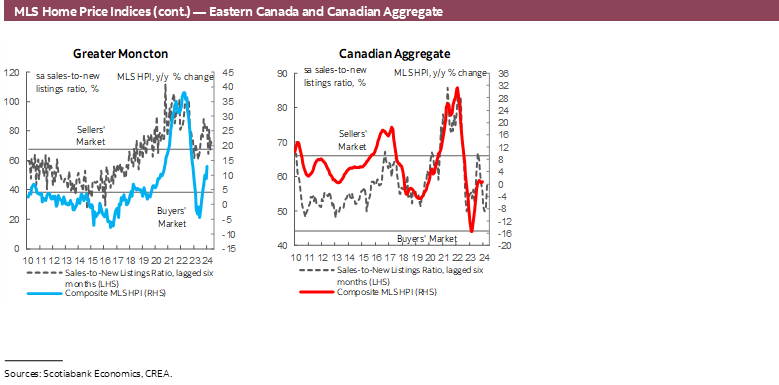
Prices, as measured by the MLS Home Price Index (HPI), fell by 1.2% (sa m/m) in January—in line with the declines of the previous two months. January’s monthly decline was led by townhouses (-1.3%), followed by single-family homes (-1.1%) and apartments (-0.8%).
IMPLICATIONS
The housing market has seen a surge in sales in recent months, even though the Bank of Canada has not yet started cutting its policy rate or even signalled that a cut is imminent as many have been expecting. This surge in activity is sooner than we expected, particularly as it well precedes the spring season which is typically a hot season for the housing market.
So what’s the reason behind the surge? Good as anyone’s guess! But here is mine: notwithstanding strong population growth and pent-up demand after months of subdued activity, as well as a still-healthy labour market and balance sheets and strong wage growth, the surge partly reflects buyers’ views on the housing market and policy rate outlook.
We have viewed the weakness in the housing market in the second half of 2023 as largely driven by would-be buyers awaiting more clarity and the rate cuts they widely expected 2024 to bring. We expected this to result in the release of pent-up demand before the BoC begins cutting (admittedly though, not this much before!) as buyers try to time a purchase to capture lower fixed rates and the lowest house price possible before an uptick of demand in response to rate cuts pushes prices back up.
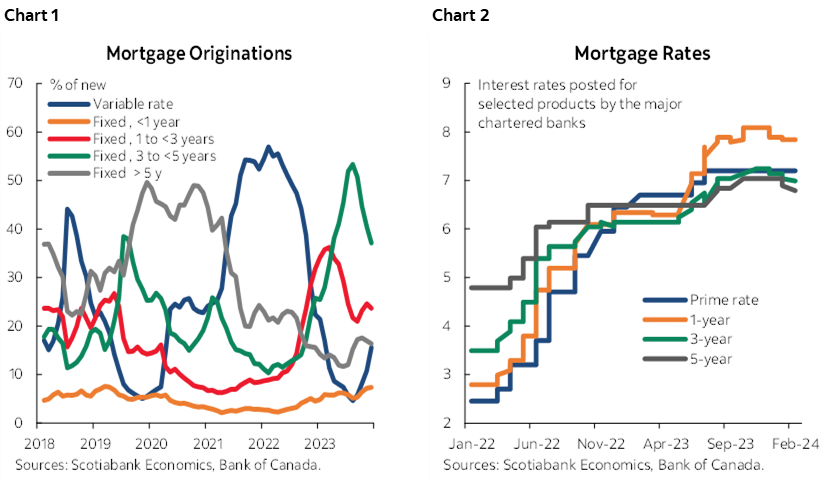
However, what seems to have brought this process forward is buyers’ willingness to put up with some short-term pain for long-term gain. Buyers are pricing in a sure increase in house prices once cuts begin and are therefore choosing variable mortgages now, betting that the cuts will be significant enough to offset the higher initial payments and reduce the overall cost of the mortgage over the long-term, versus the alternative of waiting for rates to drop and buying at significantly higher prices. We can indeed see that the share of variable mortgage originations has been on the rise lately (chart 1), the only type of mortgage with an associated rate (prime rate) that has not yet budged down (chart 2).
Given the widespread expectation, of everyone from the BoC to CREA to most economics shops, that rate cuts will eventually lead to an uptick in activity and prices, this is a reasonable bet on the part of buyers. In addition, the self-fulfilling nature of housing market cycles, whereby signs of an increase in activity and prices entice more activity as buyers rush back to the market before prices go up any further, could very much lead to this process taking hold.
Even though prices continued to decline, the housing market impacts inflation via stronger economic growth as it boosts activity in many other related sectors in the economy. Plus, we know from previous cycles that price increases typically lag upticks in sales. In addition, strong wage gains alongside declining productivity, and recent acceleration in underlying inflation measures, all act as upside risks to the inflation outlook. This led us to push our forecast of the first BoC cut into later this year with fewer cuts, and there remains a risk of having even later and fewer cuts this year. This would of course have wide-reaching implications in an already-stalling economy, impacting households’ ability to make house purchases. These are all factors to watch as we think about the housing market in the short and medium term.
DISCLAIMER
This report has been prepared by Scotiabank Economics as a resource for the clients of Scotiabank. Opinions, estimates and projections contained herein are our own as of the date hereof and are subject to change without notice. The information and opinions contained herein have been compiled or arrived at from sources believed reliable but no representation or warranty, express or implied, is made as to their accuracy or completeness. Neither Scotiabank nor any of its officers, directors, partners, employees or affiliates accepts any liability whatsoever for any direct or consequential loss arising from any use of this report or its contents.
These reports are provided to you for informational purposes only. This report is not, and is not constructed as, an offer to sell or solicitation of any offer to buy any financial instrument, nor shall this report be construed as an opinion as to whether you should enter into any swap or trading strategy involving a swap or any other transaction. The information contained in this report is not intended to be, and does not constitute, a recommendation of a swap or trading strategy involving a swap within the meaning of U.S. Commodity Futures Trading Commission Regulation 23.434 and Appendix A thereto. This material is not intended to be individually tailored to your needs or characteristics and should not be viewed as a “call to action” or suggestion that you enter into a swap or trading strategy involving a swap or any other transaction. Scotiabank may engage in transactions in a manner inconsistent with the views discussed this report and may have positions, or be in the process of acquiring or disposing of positions, referred to in this report.
Scotiabank, its affiliates and any of their respective officers, directors and employees may from time to time take positions in currencies, act as managers, co-managers or underwriters of a public offering or act as principals or agents, deal in, own or act as market makers or advisors, brokers or commercial and/or investment bankers in relation to securities or related derivatives. As a result of these actions, Scotiabank may receive remuneration. All Scotiabank products and services are subject to the terms of applicable agreements and local regulations. Officers, directors and employees of Scotiabank and its affiliates may serve as directors of corporations.
Any securities discussed in this report may not be suitable for all investors. Scotiabank recommends that investors independently evaluate any issuer and security discussed in this report, and consult with any advisors they deem necessary prior to making any investment.
This report and all information, opinions and conclusions contained in it are protected by copyright. This information may not be reproduced without the prior express written consent of Scotiabank.
™ Trademark of The Bank of Nova Scotia. Used under license, where applicable.
Scotiabank, together with “Global Banking and Markets”, is a marketing name for the global corporate and investment banking and capital markets businesses of The Bank of Nova Scotia and certain of its affiliates in the countries where they operate, including; Scotiabank Europe plc; Scotiabank (Ireland) Designated Activity Company; Scotiabank Inverlat S.A., Institución de Banca Múltiple, Grupo Financiero Scotiabank Inverlat, Scotia Inverlat Casa de Bolsa, S.A. de C.V., Grupo Financiero Scotiabank Inverlat, Scotia Inverlat Derivados S.A. de C.V. – all members of the Scotiabank group and authorized users of the Scotiabank mark. The Bank of Nova Scotia is incorporated in Canada with limited liability and is authorised and regulated by the Office of the Superintendent of Financial Institutions Canada. The Bank of Nova Scotia is authorized by the UK Prudential Regulation Authority and is subject to regulation by the UK Financial Conduct Authority and limited regulation by the UK Prudential Regulation Authority. Details about the extent of The Bank of Nova Scotia's regulation by the UK Prudential Regulation Authority are available from us on request. Scotiabank Europe plc is authorized by the UK Prudential Regulation Authority and regulated by the UK Financial Conduct Authority and the UK Prudential Regulation Authority.
Scotiabank Inverlat, S.A., Scotia Inverlat Casa de Bolsa, S.A. de C.V, Grupo Financiero Scotiabank Inverlat, and Scotia Inverlat Derivados, S.A. de C.V., are each authorized and regulated by the Mexican financial authorities.
Not all products and services are offered in all jurisdictions. Services described are available in jurisdictions where permitted by law.