CANADA HOUSING MARKET: CAUTION, UNAFFORDABILITY, RATE CUTS
SUMMARY
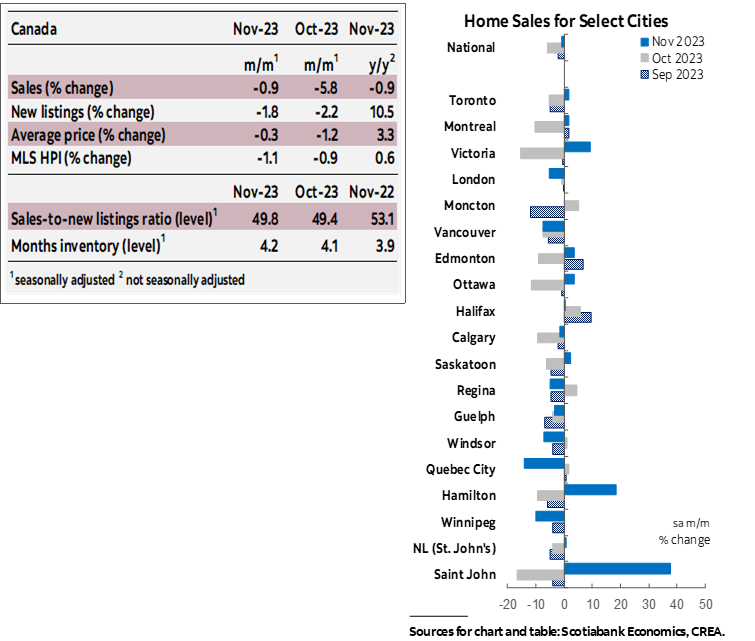
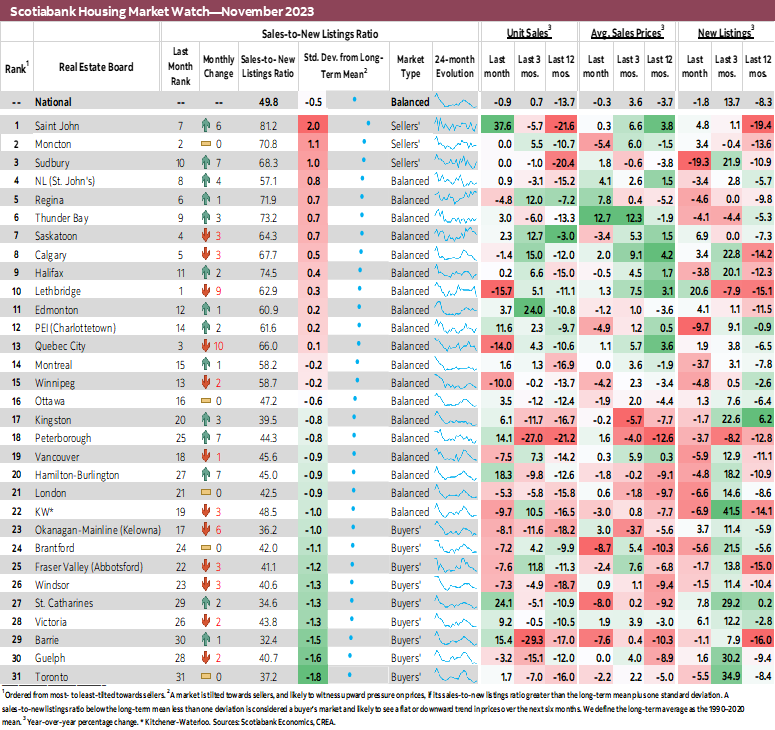
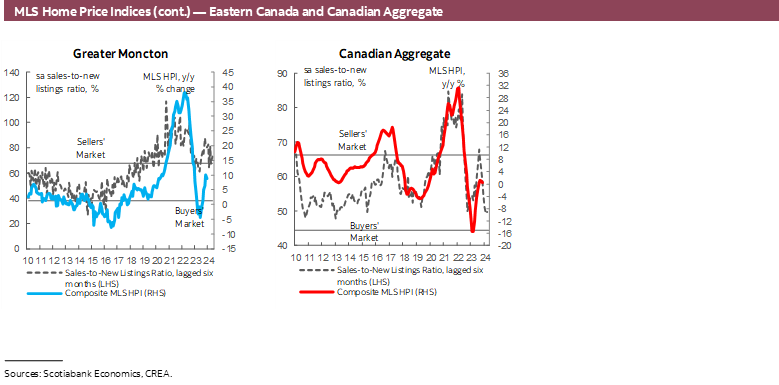
Canadian home sales in November edged down by 0.9% (sa m/m). New listings followed suit, falling by twice as much (1.8%). The larger listings decline relative to sales only slightly tightened the sales-to-new listings ratio, an indicator of how tight the market is, which remained at a 10-year low. The ratio now sits at 49.8% which is substantially below its recent April peak of 68.3% (not to mention its January 2022 peak of over 80%) and below its long-term average of 55.2%. This slight tightening nonetheless did tip the national market back into balanced territory. There were 4.2 months of inventory—up from this year’s low of 3.1 in May, but still below its long-term average of around five months. In Atlantic Canada, months of inventory is between 4–6 months below its long-term averages.
It was a fairly even split between markets where sales increased and where they didn’t. Sales increased in 16 of the 31 markets we track, were flat in 2, and declined in the remaining. Notable are double-digit increases of 14% and over in Ontario markets including Peterborough, Barrie, Hamilton-Burlington, and St. Catherines, the latter registering an increase of over 24%, while Saint John topped the month’s charts with an almost 38% increase. These were entirely offset by smaller declines (14% and under) in bigger markets, such as Quebec City, Winnipeg, Kitchener-Waterloo, Okanagan-Mainline, Fraser Valley, and Vancouver. November’s level of sales was 14% below the 2010–19 average level observed for this month.
On the other hand, listings’ declines were more widespread. The number of newly listed properties fell in almost two-thirds of the markets we track. Out of the 19 markets where listings declined, 11 were in Ontario—not surprising as this is the region that has so far led price declines as sales suffer from elevated prices, discouraging sellers from listing. Before a pull back in new listings in October and November, increases between May and September, with an average monthly increase of around 5%, had brought listings to levels consistent with observed long-term averages. Recent declines put November’s level of listings 2% below the 2010–19 average level observed for this month.
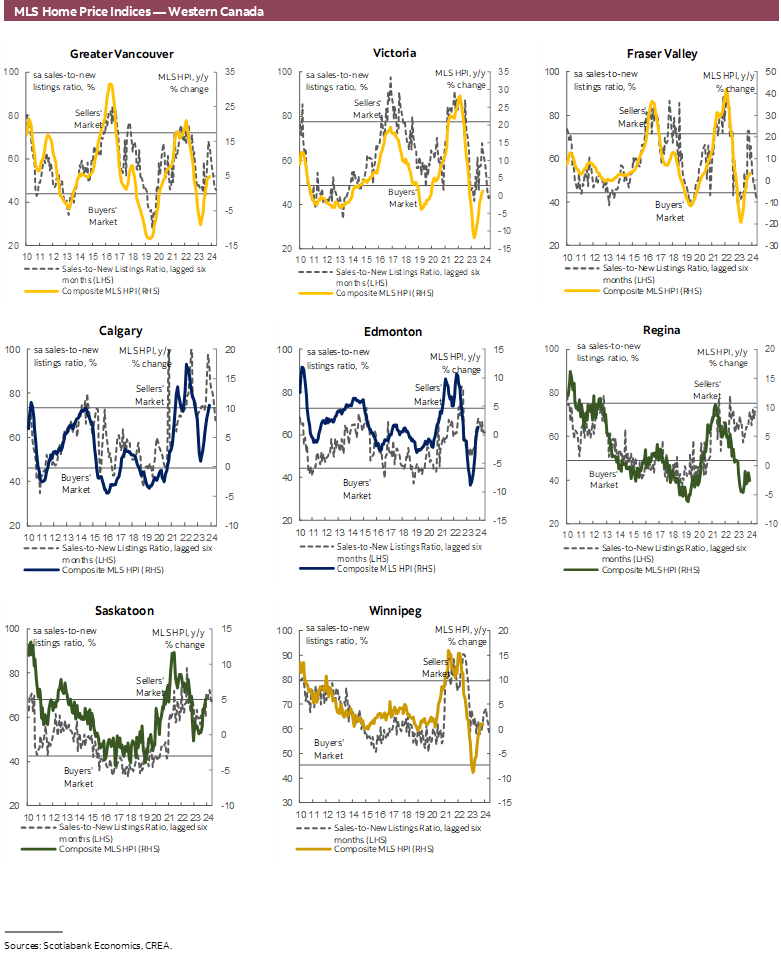
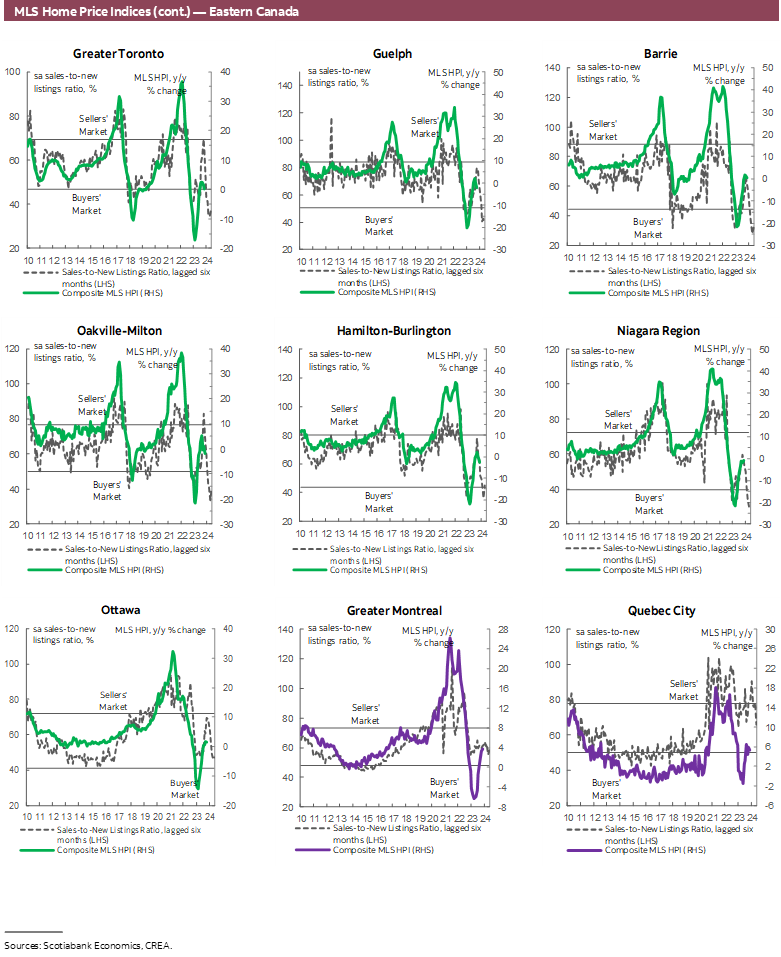
Prices, as measured by the MLS Home Price Index (HPI), fell by 1.1% (sa m/m) in November—the third and largest monthly decline in a row. There were regional differences however, whereby prices increased in over half of the local markets we track, which were offset by declines elsewhere. Despite these declines, prices remain well above their pre-pandemic levels across the board, with some markets, namely Calgary, Greater Moncton, Quebec City and Saskatoon, continuing to be above February 2022 levels, the month before the Bank of Canada started hiking, marking the start of a year-long correction in the housing market. November’s monthly decline was led by single-family homes (-1.2%) followed by townhomes (-0.9%) and apartments (-0.7%).
IMPLICATIONS
The story of Canada’s housing market over the past few months has been one of caution and unaffordability. Caution as uncertainty looms and potential buyers await more clarity on the direction of the economy and house prices. Unaffordability as high rates make it impossible for some buyers to qualify for a mortgage at today’s elevated home prices which still stand around 36% above pre-pandemic levels despite all the downward adjustments we’ve seen over the past two years. The outcome is a slow no-surprises housing market as many would-be buyers today look for next year and the rate cuts they expect it to bring. This points towards an eventual pick-up of demand and prices once the widely expected rate cutting cycle begins, or earlier. Tricky will be to manage a repeat of earlier this year when perceived certainty about the end of the hiking cycle lit up the housing market too soon for comfort, in turn driving additional hikes in the summer.
DISCLAIMER
This report has been prepared by Scotiabank Economics as a resource for the clients of Scotiabank. Opinions, estimates and projections contained herein are our own as of the date hereof and are subject to change without notice. The information and opinions contained herein have been compiled or arrived at from sources believed reliable but no representation or warranty, express or implied, is made as to their accuracy or completeness. Neither Scotiabank nor any of its officers, directors, partners, employees or affiliates accepts any liability whatsoever for any direct or consequential loss arising from any use of this report or its contents.
These reports are provided to you for informational purposes only. This report is not, and is not constructed as, an offer to sell or solicitation of any offer to buy any financial instrument, nor shall this report be construed as an opinion as to whether you should enter into any swap or trading strategy involving a swap or any other transaction. The information contained in this report is not intended to be, and does not constitute, a recommendation of a swap or trading strategy involving a swap within the meaning of U.S. Commodity Futures Trading Commission Regulation 23.434 and Appendix A thereto. This material is not intended to be individually tailored to your needs or characteristics and should not be viewed as a “call to action” or suggestion that you enter into a swap or trading strategy involving a swap or any other transaction. Scotiabank may engage in transactions in a manner inconsistent with the views discussed this report and may have positions, or be in the process of acquiring or disposing of positions, referred to in this report.
Scotiabank, its affiliates and any of their respective officers, directors and employees may from time to time take positions in currencies, act as managers, co-managers or underwriters of a public offering or act as principals or agents, deal in, own or act as market makers or advisors, brokers or commercial and/or investment bankers in relation to securities or related derivatives. As a result of these actions, Scotiabank may receive remuneration. All Scotiabank products and services are subject to the terms of applicable agreements and local regulations. Officers, directors and employees of Scotiabank and its affiliates may serve as directors of corporations.
Any securities discussed in this report may not be suitable for all investors. Scotiabank recommends that investors independently evaluate any issuer and security discussed in this report, and consult with any advisors they deem necessary prior to making any investment.
This report and all information, opinions and conclusions contained in it are protected by copyright. This information may not be reproduced without the prior express written consent of Scotiabank.
™ Trademark of The Bank of Nova Scotia. Used under license, where applicable.
Scotiabank, together with “Global Banking and Markets”, is a marketing name for the global corporate and investment banking and capital markets businesses of The Bank of Nova Scotia and certain of its affiliates in the countries where they operate, including; Scotiabank Europe plc; Scotiabank (Ireland) Designated Activity Company; Scotiabank Inverlat S.A., Institución de Banca Múltiple, Grupo Financiero Scotiabank Inverlat, Scotia Inverlat Casa de Bolsa, S.A. de C.V., Grupo Financiero Scotiabank Inverlat, Scotia Inverlat Derivados S.A. de C.V. – all members of the Scotiabank group and authorized users of the Scotiabank mark. The Bank of Nova Scotia is incorporated in Canada with limited liability and is authorised and regulated by the Office of the Superintendent of Financial Institutions Canada. The Bank of Nova Scotia is authorized by the UK Prudential Regulation Authority and is subject to regulation by the UK Financial Conduct Authority and limited regulation by the UK Prudential Regulation Authority. Details about the extent of The Bank of Nova Scotia's regulation by the UK Prudential Regulation Authority are available from us on request. Scotiabank Europe plc is authorized by the UK Prudential Regulation Authority and regulated by the UK Financial Conduct Authority and the UK Prudential Regulation Authority.
Scotiabank Inverlat, S.A., Scotia Inverlat Casa de Bolsa, S.A. de C.V, Grupo Financiero Scotiabank Inverlat, and Scotia Inverlat Derivados, S.A. de C.V., are each authorized and regulated by the Mexican financial authorities.
Not all products and services are offered in all jurisdictions. Services described are available in jurisdictions where permitted by law.