CANADA HOUSING MARKET: WAIT AND SEE, AGAIN
SUMMARY
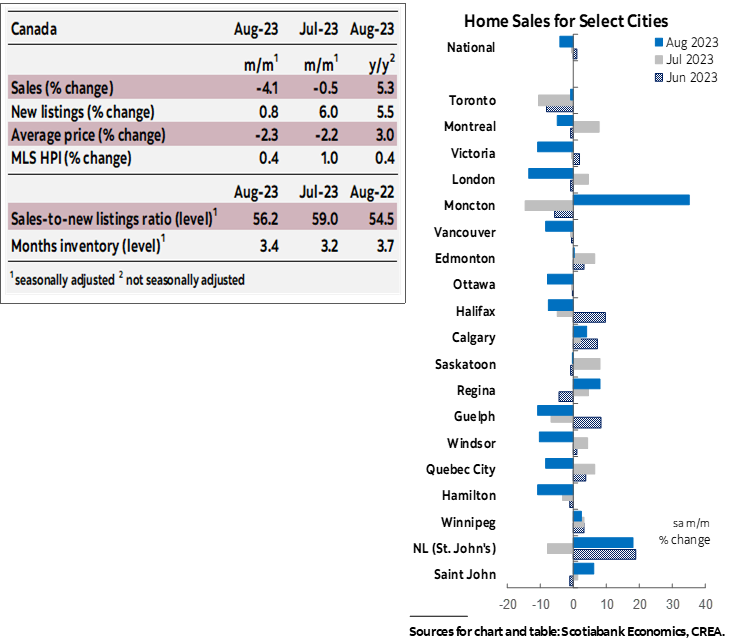
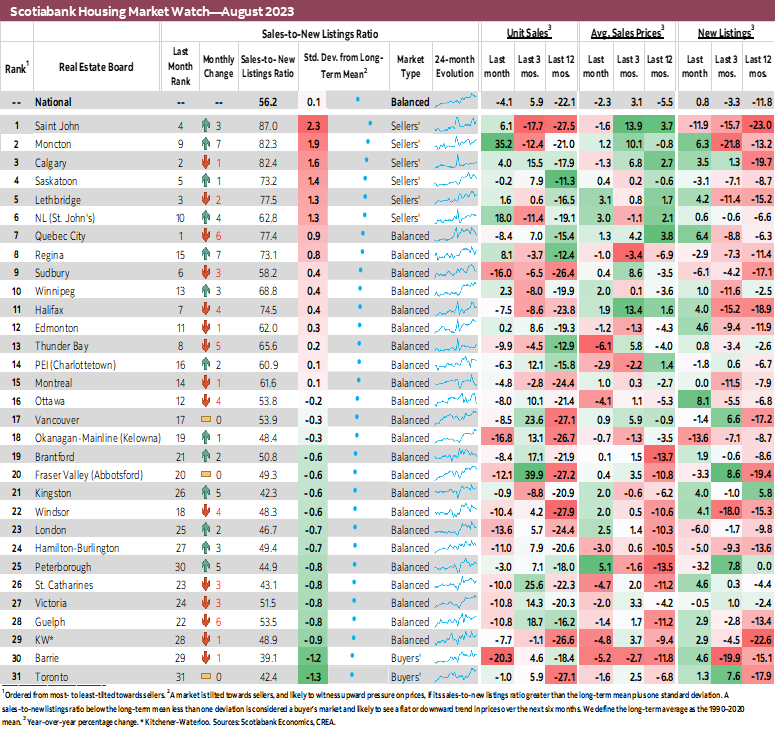
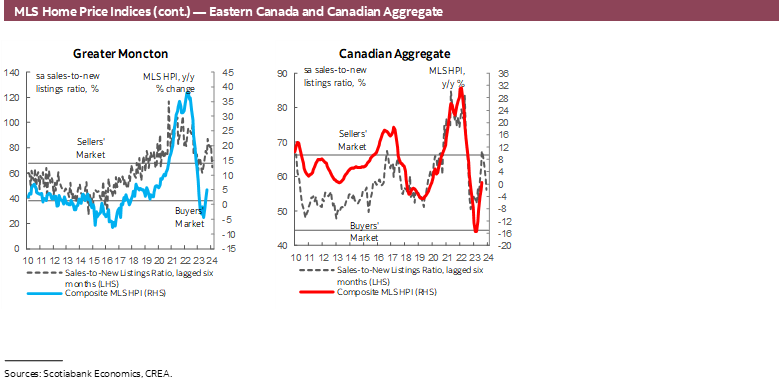
Canadian home sales fell in August by 4.1% (sa m/m) while listings slightly edged up by 0.8%. This further eased the sales-to-new listings ratio, an indicator of how tight the market is, as sales retrenched and listings maintained previous months’ gains. The ratio eased from its recent April peak of 68.3% and now stands at 56.2% which is in line with its long-term average of 55.2% and indicating a balanced national market, at least relative to historical averages and deviations. Months of inventory increased to 3.4 months—up from 3.2 in July, but still around a month and a half below its long-term average of around five months.
Notwithstanding some regional differences, more of the local markets we track experienced declines than not. On the other hand, there was a fairly even split between markets where listings increased and where they declined. Sales declined in 23 of the 31 markets we track, whereby increases in major markets in New Brunswick, Newfoundland and Labrador, Saskatchewan and Alberta were offset by broad-based declines in other provinces, mainly Ontario and British Columbia. On the other hand, listings increased in 18 of the 31 local markets we track, which was almost entirely offset by declines in the remaining markets. The small resulting up-tick in August’s new listings, however, followed larger increases in the previous months. This catch-up in listings as sales activity retreated further eased market conditions, with Barrie now joining Toronto in buyers’ territory. Six of our markets were in sellers’ territory in August, all of which experienced sales increases in August.
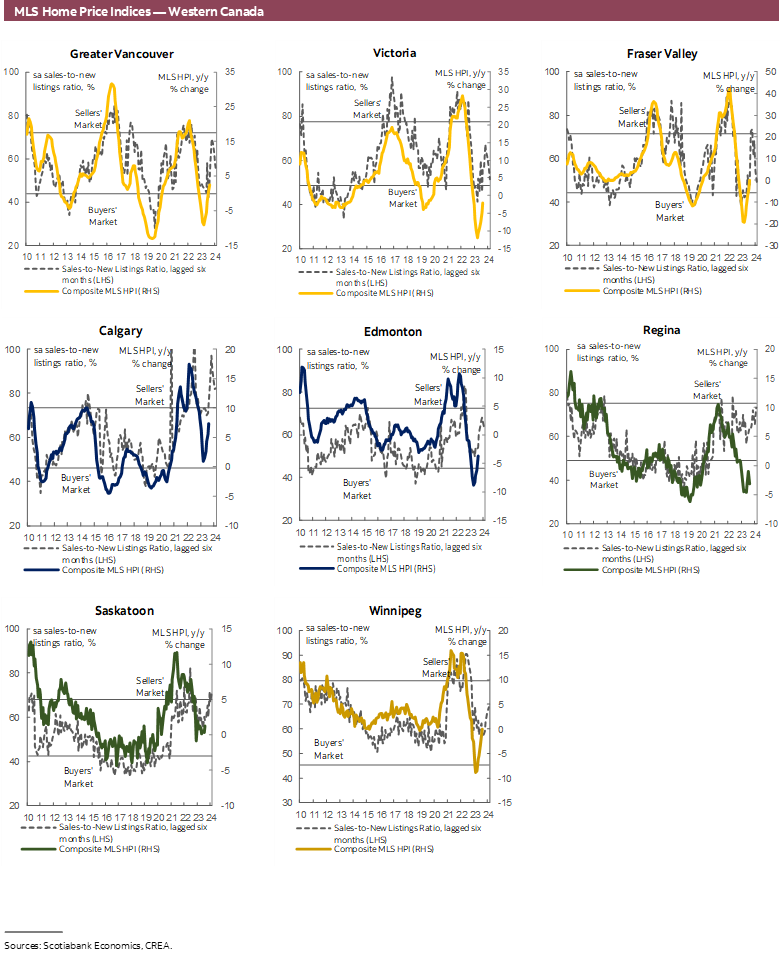
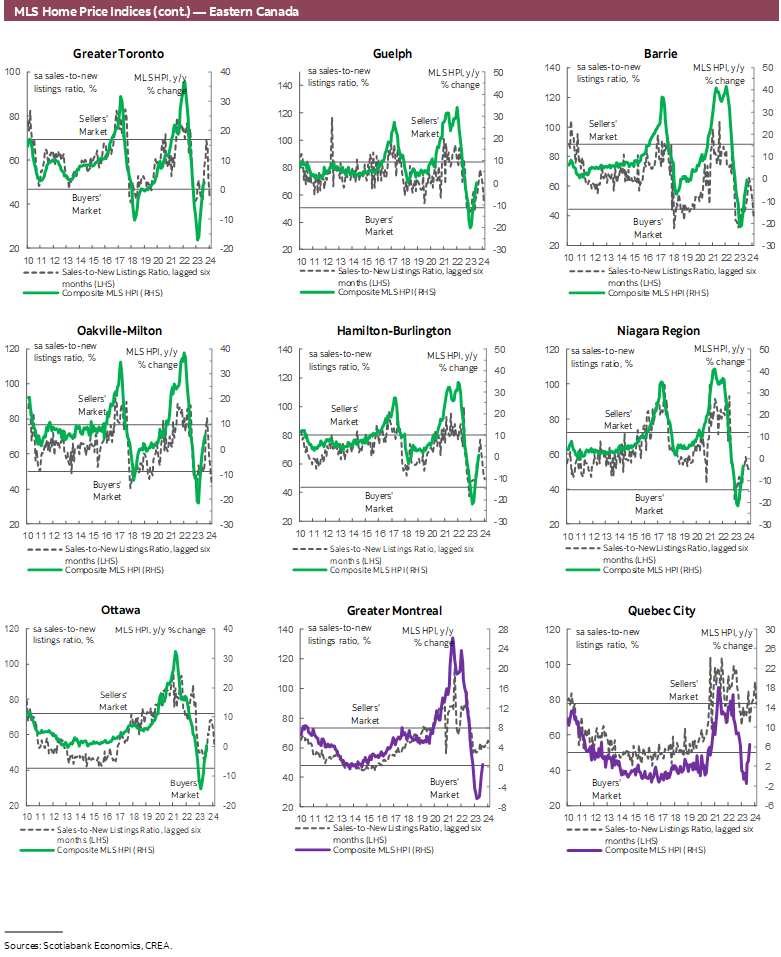
Prices, as measured by the MLS Home Price Index (HPI), edged up by 0.4% (sa m/m) in August—a smaller monthly increase compared to the last 4 months. This would be the fifth monthly increase in a row following over a year of declines in response to higher interest rates and economic conditions, and the first year-over-year increase (0.3% y/y) since September 2022. August’s monthly increase was led by townhomes and apartments (1% and 0.9%), with a 0.3% gain in the single-family homes. With this month’s results, the MLS HPI continues to drift further from its pre-pandemic levels, now sitting at 40% above, clawing back some of the price reduction we’ve seen during the correction. After peaking in February 2022, prices declined over the 12 months, reaching a trough by March 2023 which was 15% below peak levels. The period between February 2022 and March 2023 was described as a correction from unsustainable and unaffordable highs. With the past few months’ increases, prices are now only 9% below the February 2022 peak.
IMPLICATIONS
National home sales slid in August. Sales had been slowing for the last couple of months relative to the start of the year, which was characterized by a resurgence of rally-like activity driven largely by the widespread conviction at the time that the Bank of Canada was done its tightening cycle and cuts were imminent. This, amongst other things, was partly behind the BoC’s two summer hikes and more hawkish tone on the path of future policy rates.
A couple of thoughts on August’s relatively large decline. First of all, this is the first full month after the July hike which followed the June hike. Sure, they were only 25 bp each, which at the margin wouldn’t do much in a market that had already priced out many potential buyers. However, it could be that the impact of the consecutive hikes was delayed as some mortgage rate holds on previously lower rates expired, making the impact show up more clearly in August data. Further, and as discussed in previous reports, the uncertainty effect created by the BoC actions continues to be the most likely factor behind the slowdown in activity. We are back into wait-and-see territory, where buyers are awaiting more information and certainty on the future path of rates, inflation, and economic activity. Are more hikes coming? Are cuts coming sooner? Will I lose my job? Will home prices follow the slowdown in sales? These are amongst the many uncertainties currently keeping potential purchases on hold.
DISCLAIMER
This report has been prepared by Scotiabank Economics as a resource for the clients of Scotiabank. Opinions, estimates and projections contained herein are our own as of the date hereof and are subject to change without notice. The information and opinions contained herein have been compiled or arrived at from sources believed reliable but no representation or warranty, express or implied, is made as to their accuracy or completeness. Neither Scotiabank nor any of its officers, directors, partners, employees or affiliates accepts any liability whatsoever for any direct or consequential loss arising from any use of this report or its contents.
These reports are provided to you for informational purposes only. This report is not, and is not constructed as, an offer to sell or solicitation of any offer to buy any financial instrument, nor shall this report be construed as an opinion as to whether you should enter into any swap or trading strategy involving a swap or any other transaction. The information contained in this report is not intended to be, and does not constitute, a recommendation of a swap or trading strategy involving a swap within the meaning of U.S. Commodity Futures Trading Commission Regulation 23.434 and Appendix A thereto. This material is not intended to be individually tailored to your needs or characteristics and should not be viewed as a “call to action” or suggestion that you enter into a swap or trading strategy involving a swap or any other transaction. Scotiabank may engage in transactions in a manner inconsistent with the views discussed this report and may have positions, or be in the process of acquiring or disposing of positions, referred to in this report.
Scotiabank, its affiliates and any of their respective officers, directors and employees may from time to time take positions in currencies, act as managers, co-managers or underwriters of a public offering or act as principals or agents, deal in, own or act as market makers or advisors, brokers or commercial and/or investment bankers in relation to securities or related derivatives. As a result of these actions, Scotiabank may receive remuneration. All Scotiabank products and services are subject to the terms of applicable agreements and local regulations. Officers, directors and employees of Scotiabank and its affiliates may serve as directors of corporations.
Any securities discussed in this report may not be suitable for all investors. Scotiabank recommends that investors independently evaluate any issuer and security discussed in this report, and consult with any advisors they deem necessary prior to making any investment.
This report and all information, opinions and conclusions contained in it are protected by copyright. This information may not be reproduced without the prior express written consent of Scotiabank.
™ Trademark of The Bank of Nova Scotia. Used under license, where applicable.
Scotiabank, together with “Global Banking and Markets”, is a marketing name for the global corporate and investment banking and capital markets businesses of The Bank of Nova Scotia and certain of its affiliates in the countries where they operate, including; Scotiabank Europe plc; Scotiabank (Ireland) Designated Activity Company; Scotiabank Inverlat S.A., Institución de Banca Múltiple, Grupo Financiero Scotiabank Inverlat, Scotia Inverlat Casa de Bolsa, S.A. de C.V., Grupo Financiero Scotiabank Inverlat, Scotia Inverlat Derivados S.A. de C.V. – all members of the Scotiabank group and authorized users of the Scotiabank mark. The Bank of Nova Scotia is incorporated in Canada with limited liability and is authorised and regulated by the Office of the Superintendent of Financial Institutions Canada. The Bank of Nova Scotia is authorized by the UK Prudential Regulation Authority and is subject to regulation by the UK Financial Conduct Authority and limited regulation by the UK Prudential Regulation Authority. Details about the extent of The Bank of Nova Scotia's regulation by the UK Prudential Regulation Authority are available from us on request. Scotiabank Europe plc is authorized by the UK Prudential Regulation Authority and regulated by the UK Financial Conduct Authority and the UK Prudential Regulation Authority.
Scotiabank Inverlat, S.A., Scotia Inverlat Casa de Bolsa, S.A. de C.V, Grupo Financiero Scotiabank Inverlat, and Scotia Inverlat Derivados, S.A. de C.V., are each authorized and regulated by the Mexican financial authorities.
Not all products and services are offered in all jurisdictions. Services described are available in jurisdictions where permitted by law.