CANADA HOUSING MARKET: NEW MONTH, SAME UNCERTAINTY
SUMMARY
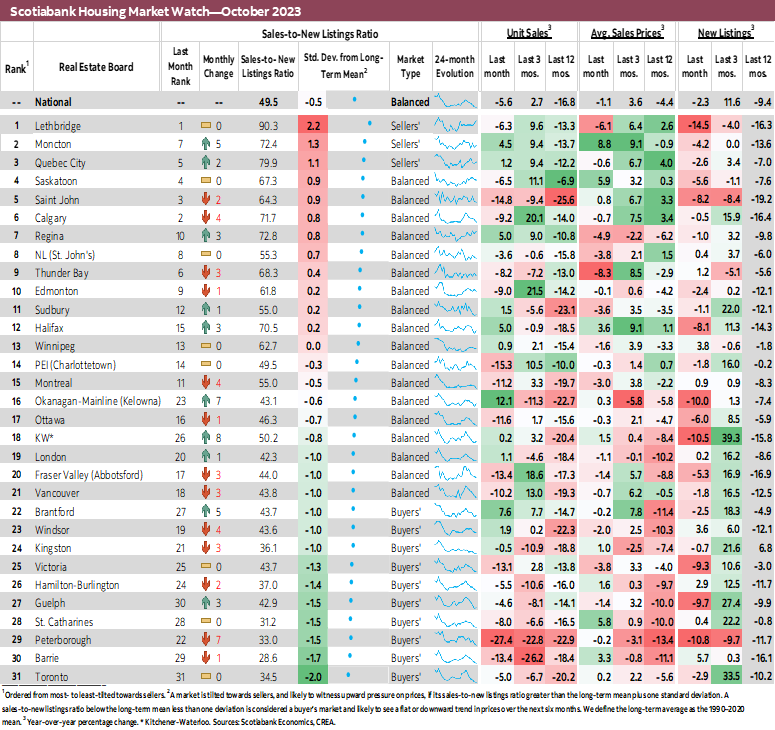
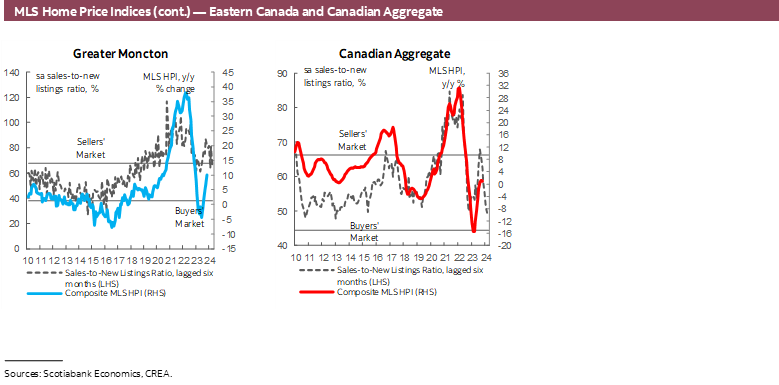
Canadian home sales fell in October by 5.6% (sa m/m). Listings followed suit, falling by 2.3%. The larger sales decline relative to listings further eased the sales-to-new listings ratio, an indicator of how tight the market is, to a 10-year low. The ratio now sits at 49.5% which is substantially below its recent April peak of 68.3% (not to mention its January 2022 peak of over 80%) and a notch below its long-term average of 55.2%. This has tipped the national market into buyers’ territory, at least relative to historical deviations. There were 4.1 months of inventory—up from this year’s low of 3.1 in May, but still below its long-term average of around five months.
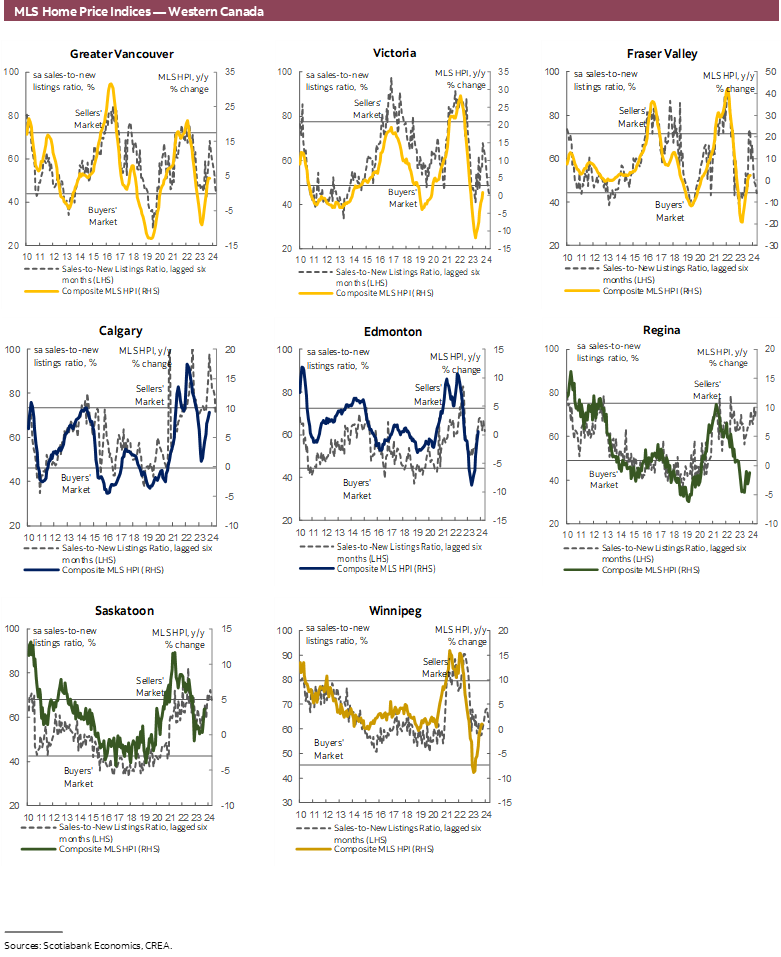
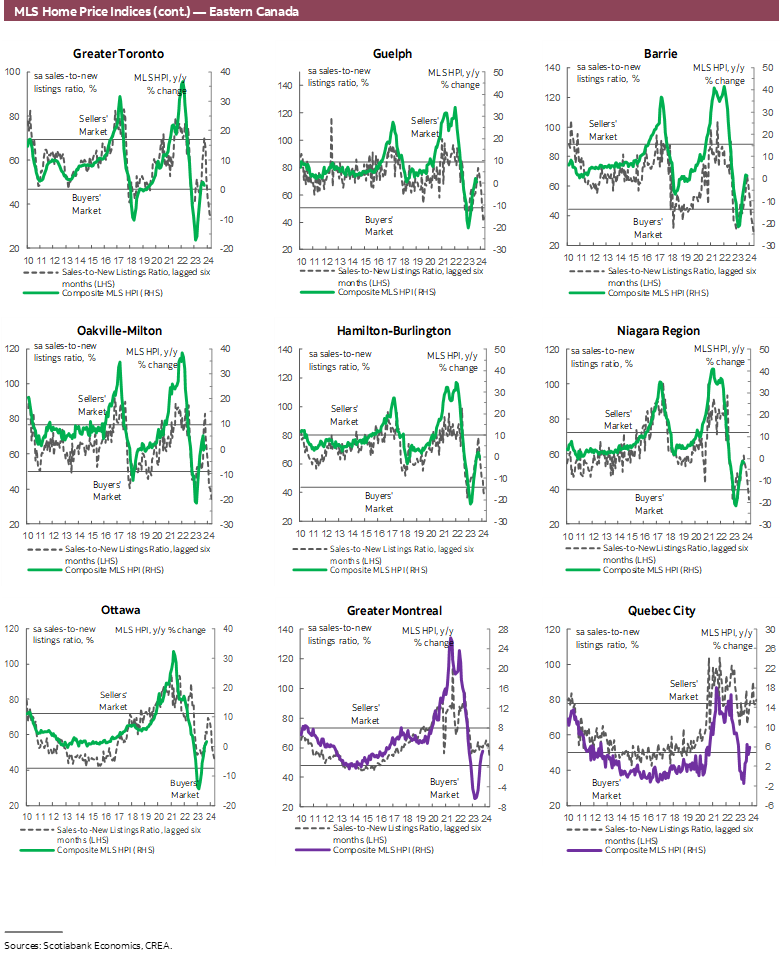
Two-thirds of the local markets we track experienced sales and listings declines in October. Sales fell in 20 of the 31 markets we track, with declines of 10% or more in Vancouver, Montreal, Ottawa, Victoria, Fraser Valley, Barrie, Saint John and Charlottetown, topped with an almost 30% decline in Peterborough. On the other hand, declines north of 10% in listings were limited to 4 markets: Okanagan-Mainline, Kitchener-Waterloo, Peterborough, and Lethbridge, the latter experiencing the largest drop of around 14%. Despite October’s decline in listings, the previous increases between May and September, with an average monthly increase of around 5%, has brought listings to levels consistent with observed long-term averages. October’s level of listings was parallel to the 2010–19 average level observed for this month, while October’s level of sales sat 12% below the 2010–19 average level for the month.
Prices, as measured by the MLS Home Price Index (HPI), edged down by 0.8% (sa m/m) in October—the second monthly decline in a row. There were regional differences however, whereby prices increased in almost half of the local markets we track, which were offset by declines elsewhere. Despite these declines, prices remain well above their pre-pandemic levels across the board, with some markets, namely Calgary, Greater Moncton, Quebec City and Saskatoon, continuing to be above February 2022 levels, the month before the Bank of Canada started hiking, marking the start of a year-long correction in the housing market. At the national level, prices are now only 11% below the February 2022 peak, and around 38% above pre-pandemic levels. September’s monthly decline was led by single-family homes (-1.0%) followed by townhomes (-0.5%), while apartments were relatively unchanged (0.1%).
IMPLICATIONS
National home sales continued their downward trend in November, recording their third monthly decline in a row and pulling prices down with them for a second month. The story remains one of increased borrowing costs along with heightened uncertainty about future outcomes of inflation, interest rates, and the economy. This has been particularly exacerbated recently in light of sovereign yield volatility and geopolitical tensions which further muddy the outlook. This has pushed many buyers to the sidelines as they await more clarity.
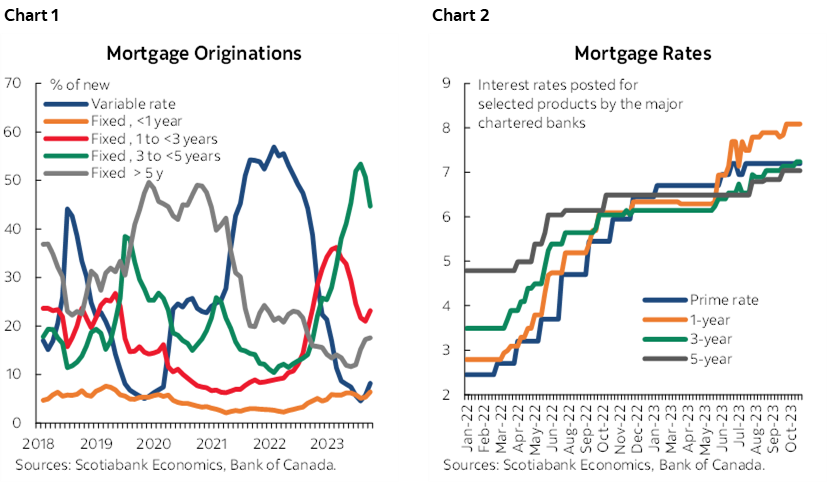
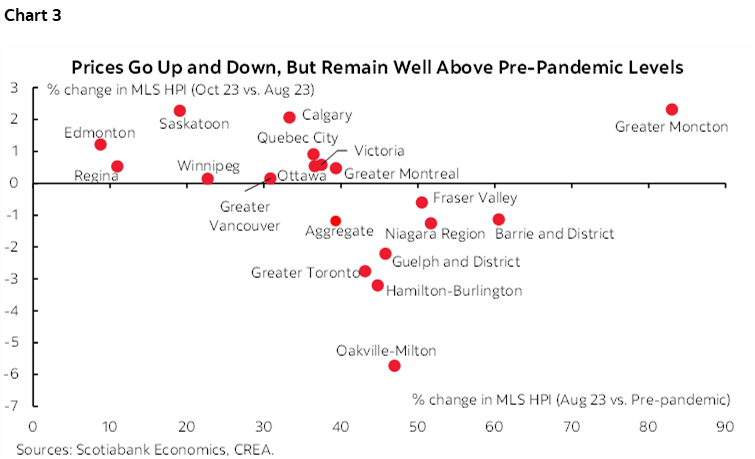
Since the Government of Canada bond yields act as benchmarks for fixed rate mortgages with corresponding terms, movements in yields whether up or down directly impact the cost of mortgage borrowing. Chart 1 shows that fixed rate mortgages with terms between 3 and 5 years now account for the highest share of new mortgages, and those with terms between 1 and 3 years the second highest. This makes sense, a compromise between the previously most popular option, the 5-year term fixed rate mortgage, which would be locking in today’s high rates for 5 years without capturing expected incoming rate cuts, and the variable rate and less than 1-year fixed rate mortgages, which would not provide ease of mind in today’s highly volatile uncertain environment. Despite coming off recent peaks, yields on the Government of Canada bonds with maturity between 3 and 5 years were on average around 10–14 bps higher in October than in September. This translated into a 10–20 bps increase in the posted rate for conventional 3-year and 5-year mortgages, not to mention a 16 bps increase in the posted rate for 1-year mortgages (chart 2). While these increases are likely not large enough to make or break a purchase decision, they point to the uncertainty faced by buyers who may worry that rates still have some way to go before stabilizing and eventually normalizing back down.
Another thing to remember is that the housing market tends to exacerbate moves in each direction whenever the market turns a corner. A perceived trend of slowing demand and declining prices would only encourage more of both as buyers may hold off for prices to decline further and therefore add to the slowdown in demand at the same time that sellers might rush back into the market to secure sale prices before further declines. The opposite is true—a perceived trend of an uptick in demand and increasing prices might encourage buyers to rush back into the market before prices go up further and in turn add to demand and price pressures.
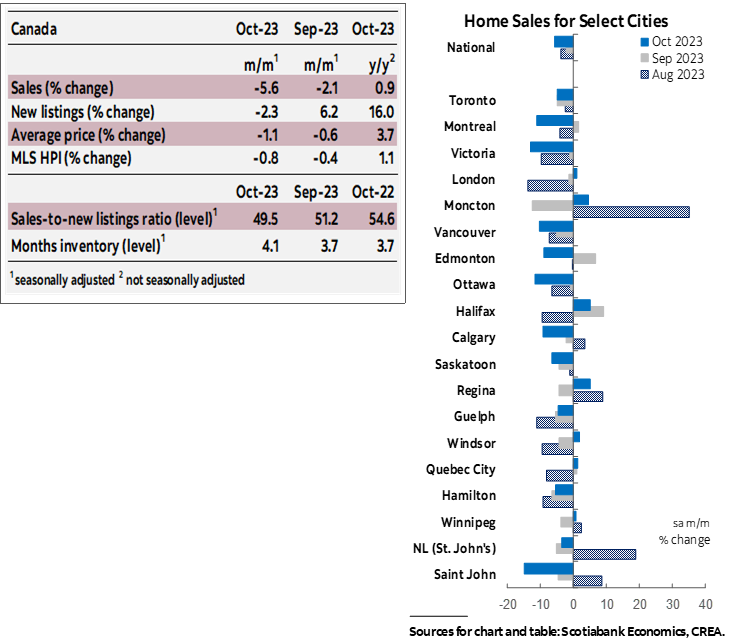
These are just a couple of many factors impacting housing market outcomes to watch over the next few months as heightened uncertainty persists. It is worth closing with a bit of a zoomed-out perspective on where prices are today. In previous reports, we discussed the nature of price adjustments and monthly price volatility. Prices can go up and down in any particular month, driven by many factors, and focusing on short-term price movements may distract from the larger picture, which is that prices remain quite elevated relative to 3 years ago despite all the patches of declines we’ve seen since then. Also, it is typically the case that price movements within these elevated (and, unaffordable) ranges tend to be more noticeable in regions where the increases since pre-pandemic were most pronounced (and, unsustainable).
Chart 3 plots, for each market, the change in prices since August against August’s prices relative to pre-pandemic levels. With the exception of Moncton, we can see that prices in September and October declined in markets where August’s prices remained 40% or more above pre-pandemic levels despite last year’s correction. We also see that these 2 months’ price declines have so far been mainly concentrated in Ontario markets, with BC markets slowly joining the pack— 2 provinces that saw the most price appreciation since the pandemic started.
DISCLAIMER
This report has been prepared by Scotiabank Economics as a resource for the clients of Scotiabank. Opinions, estimates and projections contained herein are our own as of the date hereof and are subject to change without notice. The information and opinions contained herein have been compiled or arrived at from sources believed reliable but no representation or warranty, express or implied, is made as to their accuracy or completeness. Neither Scotiabank nor any of its officers, directors, partners, employees or affiliates accepts any liability whatsoever for any direct or consequential loss arising from any use of this report or its contents.
These reports are provided to you for informational purposes only. This report is not, and is not constructed as, an offer to sell or solicitation of any offer to buy any financial instrument, nor shall this report be construed as an opinion as to whether you should enter into any swap or trading strategy involving a swap or any other transaction. The information contained in this report is not intended to be, and does not constitute, a recommendation of a swap or trading strategy involving a swap within the meaning of U.S. Commodity Futures Trading Commission Regulation 23.434 and Appendix A thereto. This material is not intended to be individually tailored to your needs or characteristics and should not be viewed as a “call to action” or suggestion that you enter into a swap or trading strategy involving a swap or any other transaction. Scotiabank may engage in transactions in a manner inconsistent with the views discussed this report and may have positions, or be in the process of acquiring or disposing of positions, referred to in this report.
Scotiabank, its affiliates and any of their respective officers, directors and employees may from time to time take positions in currencies, act as managers, co-managers or underwriters of a public offering or act as principals or agents, deal in, own or act as market makers or advisors, brokers or commercial and/or investment bankers in relation to securities or related derivatives. As a result of these actions, Scotiabank may receive remuneration. All Scotiabank products and services are subject to the terms of applicable agreements and local regulations. Officers, directors and employees of Scotiabank and its affiliates may serve as directors of corporations.
Any securities discussed in this report may not be suitable for all investors. Scotiabank recommends that investors independently evaluate any issuer and security discussed in this report, and consult with any advisors they deem necessary prior to making any investment.
This report and all information, opinions and conclusions contained in it are protected by copyright. This information may not be reproduced without the prior express written consent of Scotiabank.
™ Trademark of The Bank of Nova Scotia. Used under license, where applicable.
Scotiabank, together with “Global Banking and Markets”, is a marketing name for the global corporate and investment banking and capital markets businesses of The Bank of Nova Scotia and certain of its affiliates in the countries where they operate, including; Scotiabank Europe plc; Scotiabank (Ireland) Designated Activity Company; Scotiabank Inverlat S.A., Institución de Banca Múltiple, Grupo Financiero Scotiabank Inverlat, Scotia Inverlat Casa de Bolsa, S.A. de C.V., Grupo Financiero Scotiabank Inverlat, Scotia Inverlat Derivados S.A. de C.V. – all members of the Scotiabank group and authorized users of the Scotiabank mark. The Bank of Nova Scotia is incorporated in Canada with limited liability and is authorised and regulated by the Office of the Superintendent of Financial Institutions Canada. The Bank of Nova Scotia is authorized by the UK Prudential Regulation Authority and is subject to regulation by the UK Financial Conduct Authority and limited regulation by the UK Prudential Regulation Authority. Details about the extent of The Bank of Nova Scotia's regulation by the UK Prudential Regulation Authority are available from us on request. Scotiabank Europe plc is authorized by the UK Prudential Regulation Authority and regulated by the UK Financial Conduct Authority and the UK Prudential Regulation Authority.
Scotiabank Inverlat, S.A., Scotia Inverlat Casa de Bolsa, S.A. de C.V, Grupo Financiero Scotiabank Inverlat, and Scotia Inverlat Derivados, S.A. de C.V., are each authorized and regulated by the Mexican financial authorities.
Not all products and services are offered in all jurisdictions. Services described are available in jurisdictions where permitted by law.