CANADA HOUSING MARKET: DEFYING GRAVITY
SUMMARY
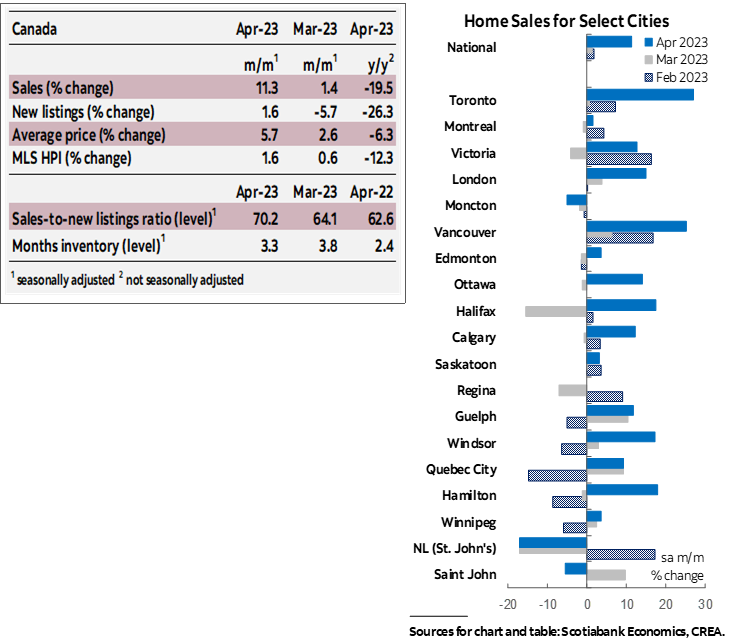
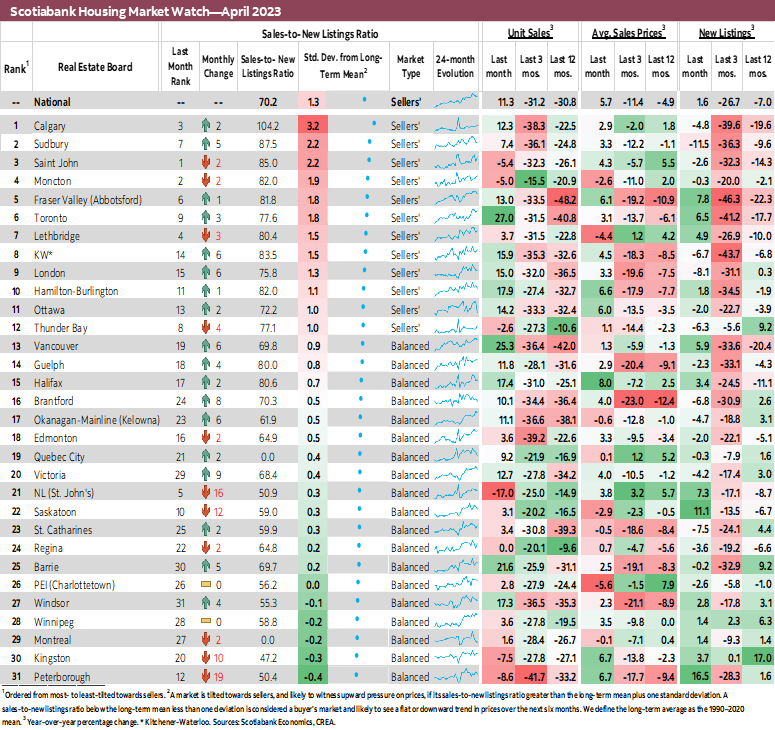
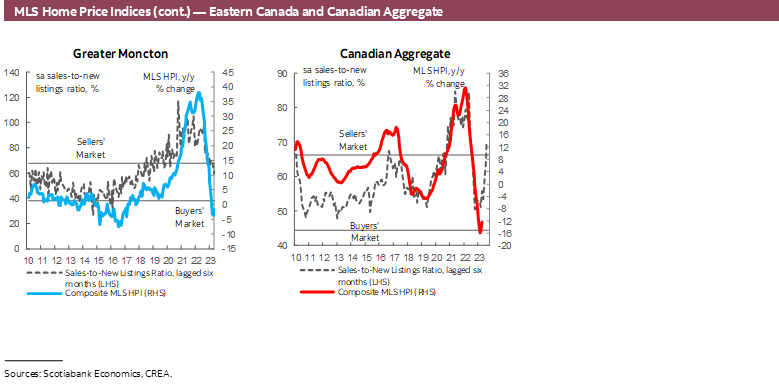
Canadian home sales rose by an astonishing 11.3% (sa m/m) in April, accompanied by only a 1.6% increase in listings. This would be the third, and largest, consecutive increase in sales combined with only a small increase in listings after two consecutive months of significantly large declines. This shot up the sales-to-new listings ratio, an indicator of how tight the market is, to 70.2%, up from 64.1% last month. This reflects a sharp and rapid tightening in market conditions since this ratio normalized down to levels close to its long-term average of 55% from record high levels during the pandemic. This has officially returned the national housing market into sellers’ territory. Similarly, months of inventory continued reversing the improvements from its record lows since the fall of 2021, declining for the third month in a row and reaching 3.3 months in April—over a month and a half below its long-term average.
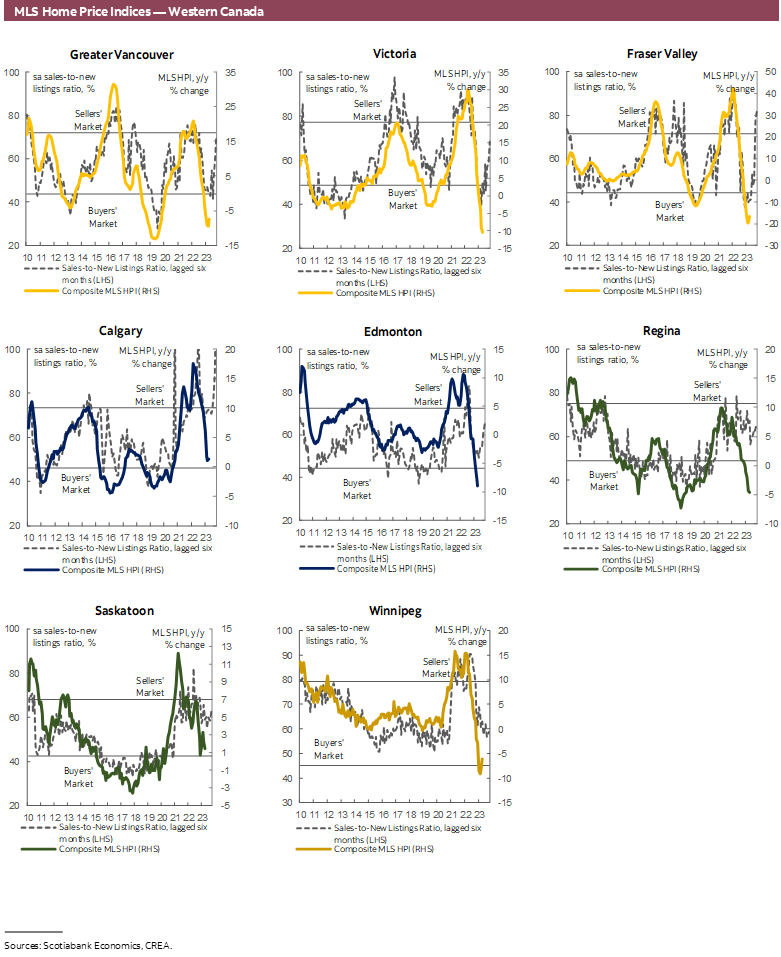
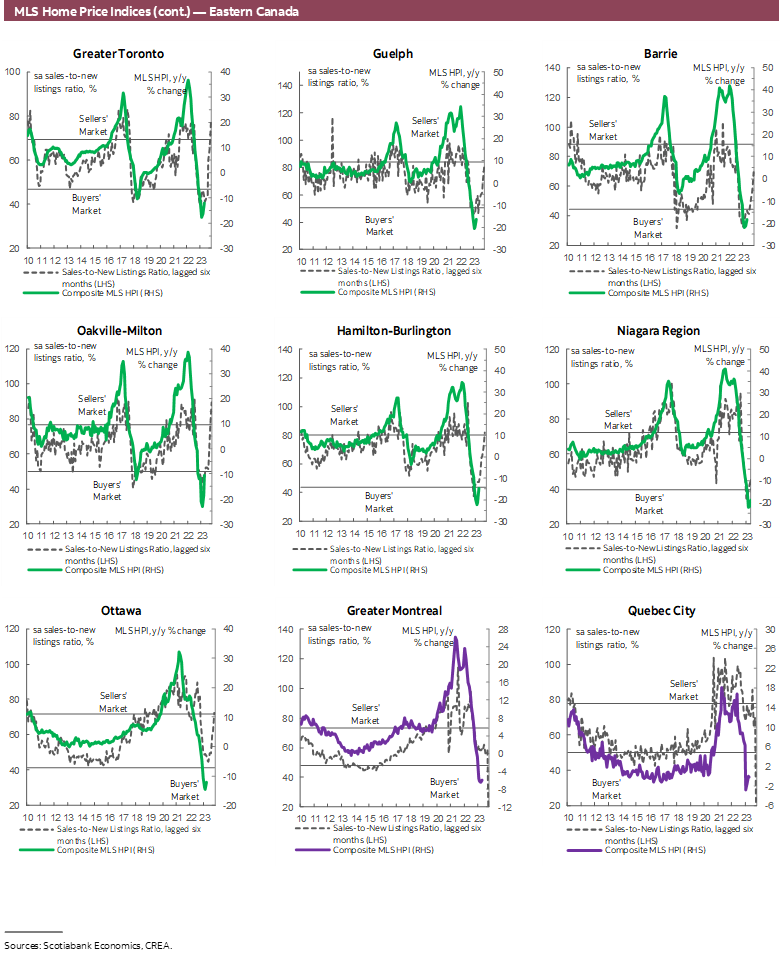
The increase in sales was fairly widespread across the local markets we track, while the increase in listings was limited to fewer markets. Sales increased in 24 of the 31 local markets we track, with particularly significant increases in Ontario markets, led by Toronto at a 27% monthly increase, and BC. Barrie and Vancouver joined Toronto with over 20% increases, while 10 other Ontario and BC markets, in addition to Calgary and Halifax, recorded monthly increases of over 10%. On the other hand, listings increased in only 13 of local markets, with sales increases occurring in 10 of those markets—pointing to additional supply being absorbed immediately by pent-up demand. There are now 12 markets in sellers’ territory, compared to 7 in March.
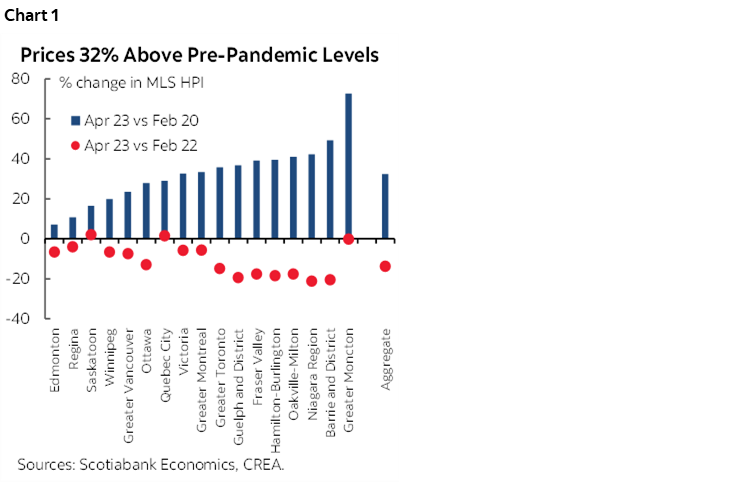
Prices, as measured by the MLS Home Price Index (HPI), increased by 1.6% (sa m/m) in April. This would be the second monthly increase in a row following 11 months of declines, with March’s increase revised up from 0.2% to 0.6%. April’s increase was led by single family homes (1.9%), particularly the larger two-storey segment (2.3%). Apartments, having been the only stand out in March, joined other segments in recording price gains in April, albeit by a smaller 0.5%, while townhomes increased by 1.3%. With this month’s results, the MLS HPI is drifting further from its pre-pandemic levels, now sitting at 32% above, reducing the correction from its March 2022 peak to only 14%.
IMPLICATIONS
It’s a tricky time to write about the housing market, just like anything else in the economy nowadays—good news is bad news and bad news is good, with net impact on sentiments, prices, rates, and the economy unclear.
National home sales recorded a staggering double-digit increase in April following two smaller monthly increases in February and March. This is the longest stretch of consecutive increases since the housing market began its correction stage in February 2022, further strengthening conviction that the housing market correction may be prematurely over. This coincided with a relatively negligible increase in listings after two months of larger declines and resulted in a rapid retightening in market conditions and a second monthly increase in the MLS HPI.
We have been expecting a stabilization in housing activity and an eventual uptick in demand and prices, driven by pent-up demand and strong immigration combined with limited supply, however the magnitude and speed in which this seems to be happening surpass our previous expectations. While this points to resiliency and strong household finances, it also poses additional challenges for the Bank of Canada as it tries to slow down the economy and bring inflation back to its 2% target.
With each monthly increase, the likelihood that the correction is over increases. As buyers see signs of an increase in activity and prices, they are enticed to rush back to the market before prices go up any further, in turn adding more pressure on activity and prices. This is partly behind April’s strong results following two months of signs of an uptick in demand. Some buyers that have been on the sidelines as rates increased and prices declined may have amassed sufficient savings for a down payment and were ready to jump back into the market upon signs of a dip being reached. Without a concurrent meaningful increase in supply, this would reintroduce imbalances to the market and reverse some of the improvements we have seen over the past year towards a more balanced and sustainable market and conditions, further delaying the needed improvement in housing affordability conditions. And while April’s double-digit increase in sales might point to more pressure ahead, it should be put in perspective whereby the increase is coming off the heels of an unusually low level of activity in comparison to historical averages. With the increases of the last 3 months, April’s level of sales was still 6% below the month’s 2000–2019 average, while April’s level of listings was 26% below the month’s long-term average. Additional improvements on the listings side of the market may facilitate additional sales activity as new inventory is absorbed.
Given the historically low levels of affordability at the still-elevated level of prices (chart 1) and high interest rates, it seems that the housing market is defying gravity, driven by pent-up demand and strong immigration and population growth, with the retightening in conditions as the sales-to-listing ratio rises rapidly and the decline in fixed-rate mortgage rates adding to incoming price pressures.
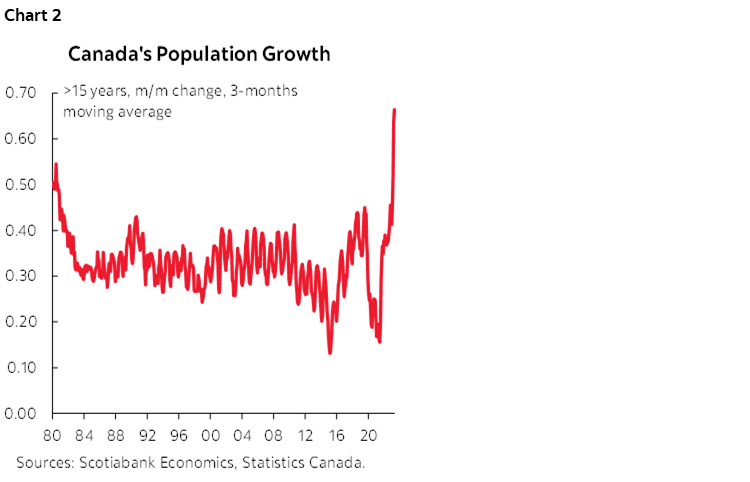
Population dynamics will continue playing a key role in determining housing market outcomes. We are currently experiencing the most rapid pace of population growth in 50 years (chart 2). The federal government continues to set higher immigration targets with an increasing commitment towards more economic immigration, which translates onto higher population growth and demand. While this would alleviate some of the labour shortages in the construction sector and overall economy, in a market in which supply lags demand, this points to continued pressures on prices and affordability.
DISCLAIMER
This report has been prepared by Scotiabank Economics as a resource for the clients of Scotiabank. Opinions, estimates and projections contained herein are our own as of the date hereof and are subject to change without notice. The information and opinions contained herein have been compiled or arrived at from sources believed reliable but no representation or warranty, express or implied, is made as to their accuracy or completeness. Neither Scotiabank nor any of its officers, directors, partners, employees or affiliates accepts any liability whatsoever for any direct or consequential loss arising from any use of this report or its contents.
These reports are provided to you for informational purposes only. This report is not, and is not constructed as, an offer to sell or solicitation of any offer to buy any financial instrument, nor shall this report be construed as an opinion as to whether you should enter into any swap or trading strategy involving a swap or any other transaction. The information contained in this report is not intended to be, and does not constitute, a recommendation of a swap or trading strategy involving a swap within the meaning of U.S. Commodity Futures Trading Commission Regulation 23.434 and Appendix A thereto. This material is not intended to be individually tailored to your needs or characteristics and should not be viewed as a “call to action” or suggestion that you enter into a swap or trading strategy involving a swap or any other transaction. Scotiabank may engage in transactions in a manner inconsistent with the views discussed this report and may have positions, or be in the process of acquiring or disposing of positions, referred to in this report.
Scotiabank, its affiliates and any of their respective officers, directors and employees may from time to time take positions in currencies, act as managers, co-managers or underwriters of a public offering or act as principals or agents, deal in, own or act as market makers or advisors, brokers or commercial and/or investment bankers in relation to securities or related derivatives. As a result of these actions, Scotiabank may receive remuneration. All Scotiabank products and services are subject to the terms of applicable agreements and local regulations. Officers, directors and employees of Scotiabank and its affiliates may serve as directors of corporations.
Any securities discussed in this report may not be suitable for all investors. Scotiabank recommends that investors independently evaluate any issuer and security discussed in this report, and consult with any advisors they deem necessary prior to making any investment.
This report and all information, opinions and conclusions contained in it are protected by copyright. This information may not be reproduced without the prior express written consent of Scotiabank.
™ Trademark of The Bank of Nova Scotia. Used under license, where applicable.
Scotiabank, together with “Global Banking and Markets”, is a marketing name for the global corporate and investment banking and capital markets businesses of The Bank of Nova Scotia and certain of its affiliates in the countries where they operate, including; Scotiabank Europe plc; Scotiabank (Ireland) Designated Activity Company; Scotiabank Inverlat S.A., Institución de Banca Múltiple, Grupo Financiero Scotiabank Inverlat, Scotia Inverlat Casa de Bolsa, S.A. de C.V., Grupo Financiero Scotiabank Inverlat, Scotia Inverlat Derivados S.A. de C.V. – all members of the Scotiabank group and authorized users of the Scotiabank mark. The Bank of Nova Scotia is incorporated in Canada with limited liability and is authorised and regulated by the Office of the Superintendent of Financial Institutions Canada. The Bank of Nova Scotia is authorized by the UK Prudential Regulation Authority and is subject to regulation by the UK Financial Conduct Authority and limited regulation by the UK Prudential Regulation Authority. Details about the extent of The Bank of Nova Scotia's regulation by the UK Prudential Regulation Authority are available from us on request. Scotiabank Europe plc is authorized by the UK Prudential Regulation Authority and regulated by the UK Financial Conduct Authority and the UK Prudential Regulation Authority.
Scotiabank Inverlat, S.A., Scotia Inverlat Casa de Bolsa, S.A. de C.V, Grupo Financiero Scotiabank Inverlat, and Scotia Inverlat Derivados, S.A. de C.V., are each authorized and regulated by the Mexican financial authorities.
Not all products and services are offered in all jurisdictions. Services described are available in jurisdictions where permitted by law.