CANADA HOUSING MARKET: HOUSING MARKET REALITY CHECK
SUMMARY
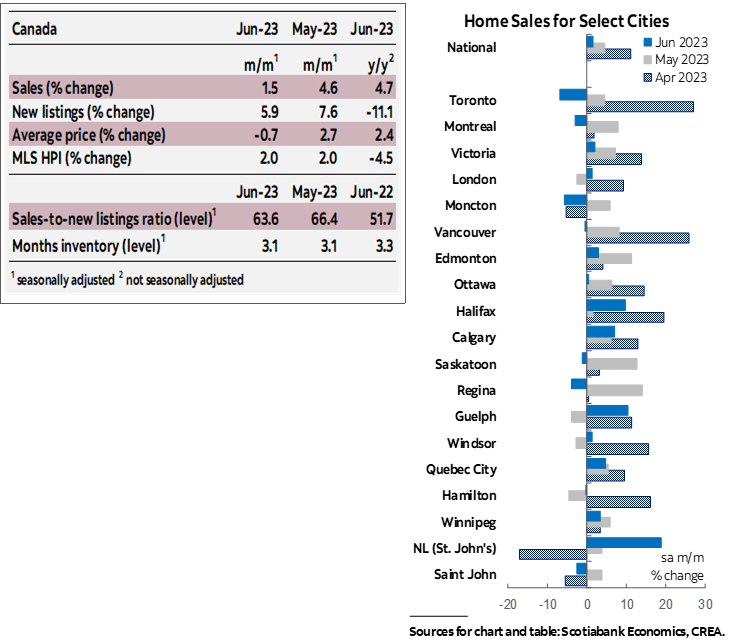
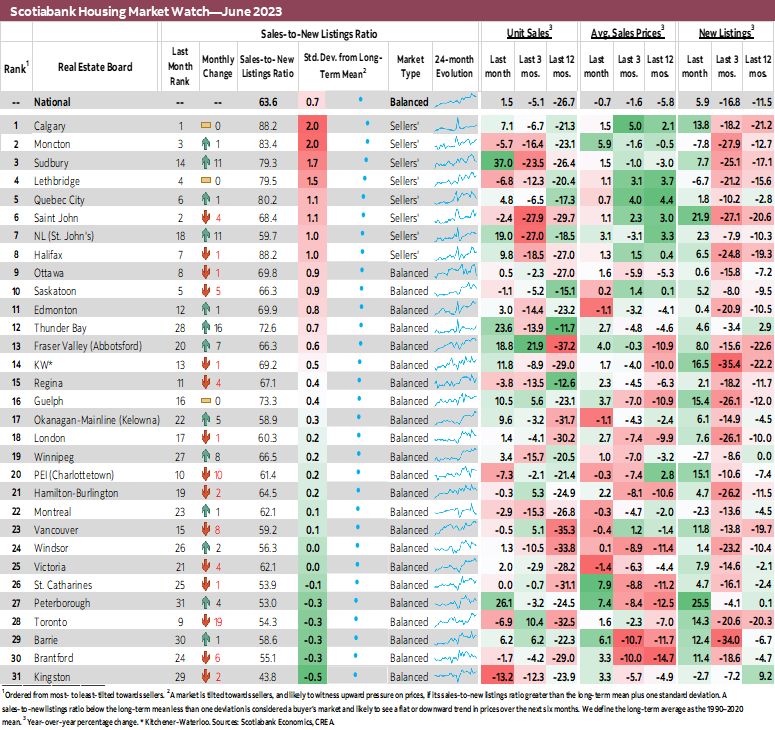
Canadian home sales increased by 1.5% (sa m/m) in June, a slower pace than the previous two months. Listings surpassed sales for the second month in a row, increasing by 5.9%. This brought a welcome easing in the sales-to-new listings ratio, an indicator of how tight the market is. The ratio stands at 63.6% as of May, down from its recent April peak of 68.3%, but still above its long-term average of 55.2%. This puts the national housing market back in balanced territory after returning to sellers’ territory in April. Months of inventory were unchanged at 3.1 months—almost two months below its long-term average, a reversal of the improvements from its record lows since the fall of 2021.
The increase in sales reflected more regional differences than last month while the increase in listings was fairly widespread across the local markets we track. Pullbacks in sales in some of Canada’s major markets, including Toronto and Vancouver, partly offset staggering increases north of 19% and up to 40% in Fraser Valley, St. John's, Thunder Bay, Peterborough and Sudbury. On the other hand, listings increased in 26 of the 31 local markets we track. In fact, of the 18 markets that saw sales increase in June, 17 had listings increase as well—indicating immediate absorption of new supply arriving to the market given pent-up demand. Despite the increase in listings, 8 markets were in sellers’ territory in June compared to 7 in May.
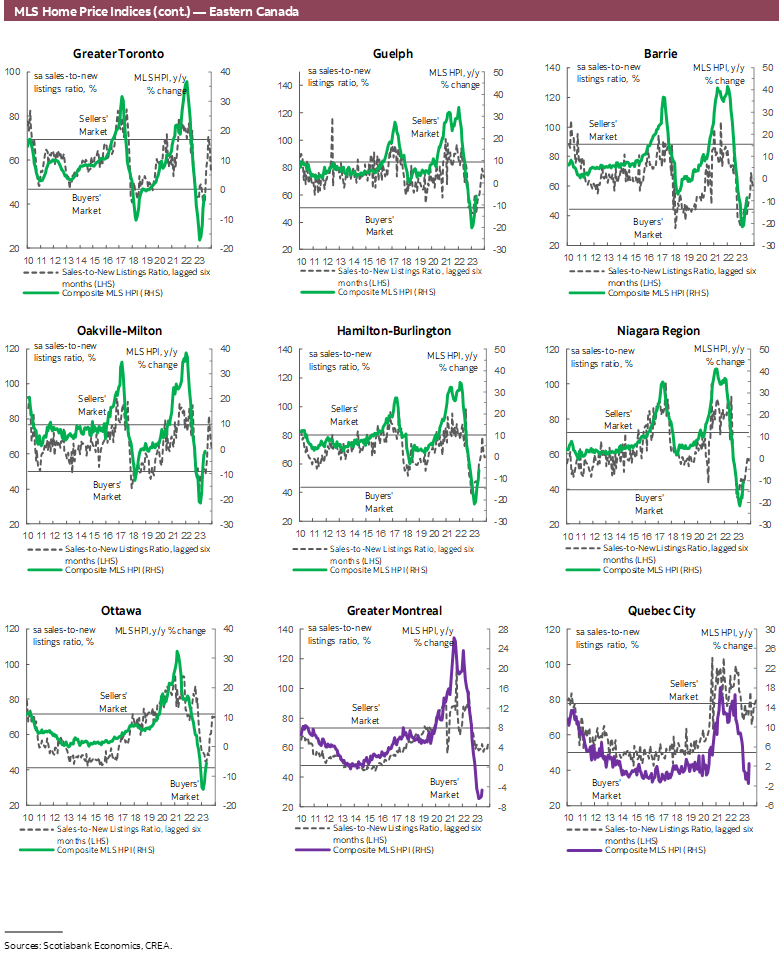
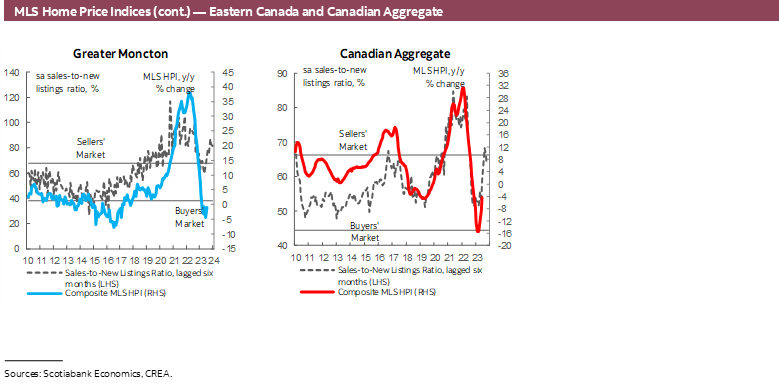
Prices, as measured by the MLS Home Price Index (HPI), increased by 2% (sa m/m) in June, same as May and April. This would be the third significant monthly increase in a row following a year of declines in response to higher interest rates and economic conditions. Apartments saw the most acceleration in monthly price gains—the HPI for the segment increased by 2.3% (sa m/m), up from 1.5% in May, a pace not seen since March 2022 at the cusp of the market before the BoC started hiking. As a result, June’s increase was led by apartments, followed by single-family homes (2.2%), and townhomes (1.9%). Worth noting that the townhomes segment also represented an acceleration of 0.3 pps relative to May, while the single-family homes segment decelerated by 0.3 pps. This could explain why the average sales price measure, the total dollar value of the sales divided by the total number of units sold in a single month, declined in June, as more sales shifted to smaller cheaper units. The HPI, which controls the composition of sales, is a more reliable measure of underlying price movements. With this month’s results, the MLS HPI is drifting further from its pre-pandemic levels, now sitting at 38% above, reducing the correction from its February 2022 peak to only 10.4% (the trough reached in March 2023 was 15% below the peak).
IMPLICATIONS
As expected, the Bank of Canada’s June hike while leaving the door open for another in July had the intended consequence of slowing down the resurgence of rally-like activity in the housing market, at least for the month of June.
Sales still increased for the month, but by a slower pace than in May and April, when sales recorded a staggering double-digit increase, following smaller gains in February and March. These gains all occurred while listings significantly retreated before starting to play catch up in the last two months, outpacing the gains in sales. Even as they did, however, tight market conditions persisted given previous declines in the face of a pickup in activity, paving the way for continued price pressures.
As discussed last month, at least part of the recent strength in the housing market had been driven by buyers who had amassed larger down payments during the slowdown and were ready to jump back into the market once rates stabilized, encouraged by the widespread conviction at the time that the BoC is done hiking and cuts are imminent, and given earlier market pricing of cuts which translated into a reduction in fixed rates.
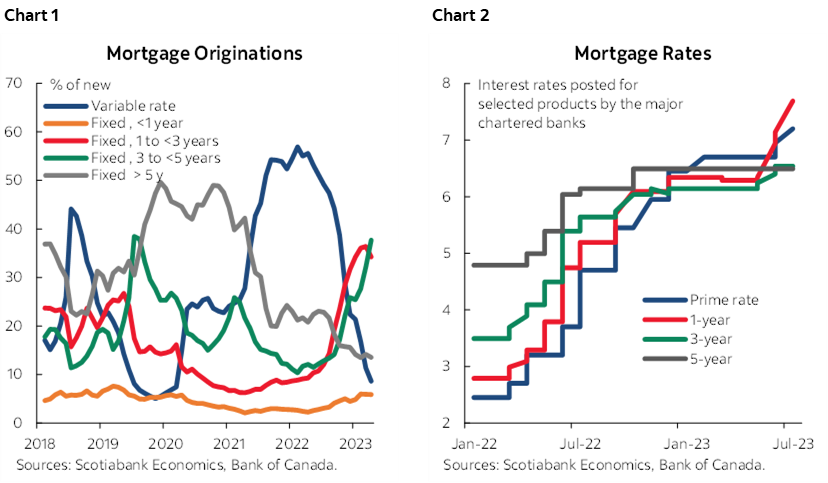
June’s hike occurred in the first week of the month, so it had time to influence buyers’ decisions and the month’s results via higher borrowing costs. While variable rates increased directly with the prime rate, variable rate mortgages account for the smallest share of mortgage originations today after peaking early last year. The bigger impact seems to be coming from the increase in short-term fixed rates, which increased in June due to the direct impact of a higher policy rate but also due to the BoC’s hawkish communications that left the door open for a July hike while pushing on imminent rate cuts. Short-term fixed mortgage products have been gaining popularity as of late reflecting a shift in buyers’ preference towards more certainty in uncertain times (charts 1 and 2).
This uncertainty effect, in any case, is likely the biggest driver of the pull back in housing sales activity in June. At the end of the day, the June hike was relatively marginal. Those who could afford at May rates might have been able to stomach the June increase as buyers at the margin have already been priced out. But by signalling that the pause may be over and leaving the door open for further hikes, uncertainty about future outcomes of rates, inflation, and economic activity likely dawned on potential buyers, while also helping thwart speculative activity—the latter more sensitive to the change in narrative as it implies higher borrowing costs for longer and lower profitability.
The combined effects have produced the expected and desired outcome of taming a rally in a market that had little capacity to accommodate it and for a central bank that could ill afford to have the most rate sensitive part of the economy roar back when it is trying to slow growth and bring inflation back to target. Of course, they also meant that more Canadians who already have to grapple with higher prices had to also endure higher mortgage payments and borrowing costs, and others had to postpone or let go of their home ownerships plans. But this is a situation that is likely to arise regardless of rate hikes as long as no meaningful progress is made to increase the housing stock to accommodate current and incoming demand. The resulting imbalance and tightness in market conditions would produce the same impact of inflating home prices and therefore mortgage payments and reducing affordability for first-time home buyers.
DISCLAIMER
This report has been prepared by Scotiabank Economics as a resource for the clients of Scotiabank. Opinions, estimates and projections contained herein are our own as of the date hereof and are subject to change without notice. The information and opinions contained herein have been compiled or arrived at from sources believed reliable but no representation or warranty, express or implied, is made as to their accuracy or completeness. Neither Scotiabank nor any of its officers, directors, partners, employees or affiliates accepts any liability whatsoever for any direct or consequential loss arising from any use of this report or its contents.
These reports are provided to you for informational purposes only. This report is not, and is not constructed as, an offer to sell or solicitation of any offer to buy any financial instrument, nor shall this report be construed as an opinion as to whether you should enter into any swap or trading strategy involving a swap or any other transaction. The information contained in this report is not intended to be, and does not constitute, a recommendation of a swap or trading strategy involving a swap within the meaning of U.S. Commodity Futures Trading Commission Regulation 23.434 and Appendix A thereto. This material is not intended to be individually tailored to your needs or characteristics and should not be viewed as a “call to action” or suggestion that you enter into a swap or trading strategy involving a swap or any other transaction. Scotiabank may engage in transactions in a manner inconsistent with the views discussed this report and may have positions, or be in the process of acquiring or disposing of positions, referred to in this report.
Scotiabank, its affiliates and any of their respective officers, directors and employees may from time to time take positions in currencies, act as managers, co-managers or underwriters of a public offering or act as principals or agents, deal in, own or act as market makers or advisors, brokers or commercial and/or investment bankers in relation to securities or related derivatives. As a result of these actions, Scotiabank may receive remuneration. All Scotiabank products and services are subject to the terms of applicable agreements and local regulations. Officers, directors and employees of Scotiabank and its affiliates may serve as directors of corporations.
Any securities discussed in this report may not be suitable for all investors. Scotiabank recommends that investors independently evaluate any issuer and security discussed in this report, and consult with any advisors they deem necessary prior to making any investment.
This report and all information, opinions and conclusions contained in it are protected by copyright. This information may not be reproduced without the prior express written consent of Scotiabank.
™ Trademark of The Bank of Nova Scotia. Used under license, where applicable.
Scotiabank, together with “Global Banking and Markets”, is a marketing name for the global corporate and investment banking and capital markets businesses of The Bank of Nova Scotia and certain of its affiliates in the countries where they operate, including; Scotiabank Europe plc; Scotiabank (Ireland) Designated Activity Company; Scotiabank Inverlat S.A., Institución de Banca Múltiple, Grupo Financiero Scotiabank Inverlat, Scotia Inverlat Casa de Bolsa, S.A. de C.V., Grupo Financiero Scotiabank Inverlat, Scotia Inverlat Derivados S.A. de C.V. – all members of the Scotiabank group and authorized users of the Scotiabank mark. The Bank of Nova Scotia is incorporated in Canada with limited liability and is authorised and regulated by the Office of the Superintendent of Financial Institutions Canada. The Bank of Nova Scotia is authorized by the UK Prudential Regulation Authority and is subject to regulation by the UK Financial Conduct Authority and limited regulation by the UK Prudential Regulation Authority. Details about the extent of The Bank of Nova Scotia's regulation by the UK Prudential Regulation Authority are available from us on request. Scotiabank Europe plc is authorized by the UK Prudential Regulation Authority and regulated by the UK Financial Conduct Authority and the UK Prudential Regulation Authority.
Scotiabank Inverlat, S.A., Scotia Inverlat Casa de Bolsa, S.A. de C.V, Grupo Financiero Scotiabank Inverlat, and Scotia Inverlat Derivados, S.A. de C.V., are each authorized and regulated by the Mexican financial authorities.
Not all products and services are offered in all jurisdictions. Services described are available in jurisdictions where permitted by law.