CANADA HOUSING MARKET: THE FLOOR IS TRAMPOLINE
SUMMARY
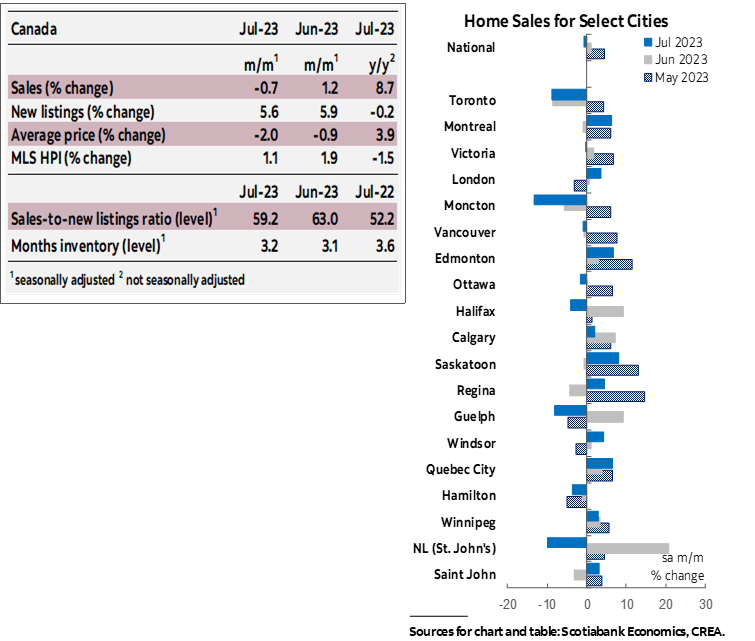
Canadian home sales slightly edged down in July by 0.7% (sa m/m) while listings recorded another monthly gain of 5.6%. This eased the sales-to-new listings ratio, an indicator of how tight the market, for the second month in a row. The ratio stands at 59.2% as of July, down from 63% in June and below its recent April peak of 68.3%, but still above its long-term average of 55.2%. Still, it is a level that indicates the national housing market is still in balanced territory, having returned to sellers’ territory in April. Months of inventory increased to 3.2 months—a slight improvement from June (3.1 months) but still almost two months below its long-term average of around five months.
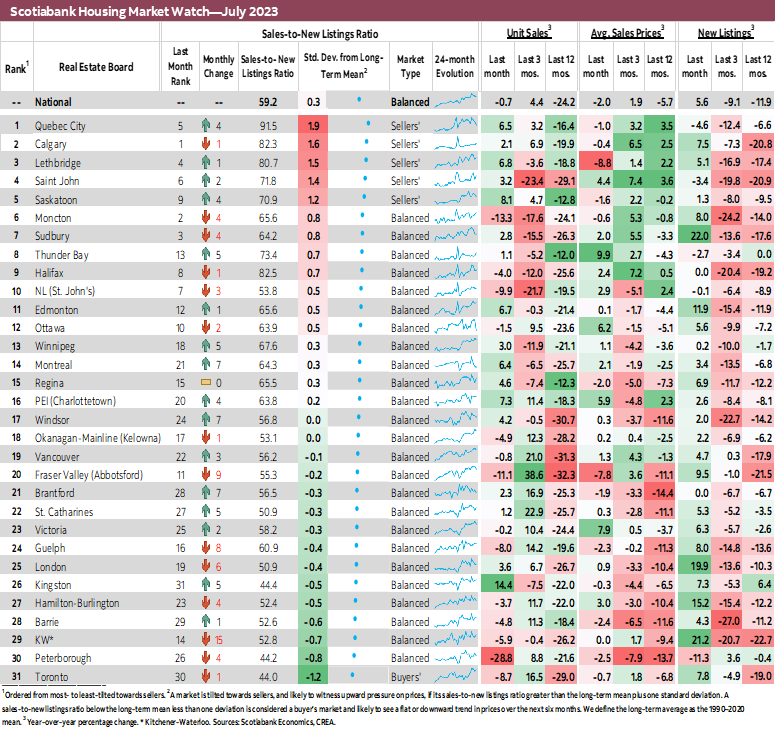
The national decline in sales reflected some regional differences while the increase in listings was fairly widespread across the local markets we track. While there was a fairly even split between markets where sales increased and where sales declined (17 vs 14), an almost 30% decline in Peterborough seems to have tipped the scale toward a slight national decline. On the other hand, listings increased in 24 of the 31 local markets we track. As in last month, of the 17 markets that saw sales increase in June, 13 had listings increase as well—indicating immediate absorption of new supply arriving to the market given pent-up demand. The increase in listings concurrent with a stalling in sales activity put more markets in balanced territory relative to June—only 4 markets were in sellers’ territory (compared to 8 in June) with Toronto being the only market entering buyers’ territory.
Prices, as measured by the MLS Home Price Index (HPI), increased by 1.1% (sa m/m) in July—a smaller, but still significant, monthly increase compared to the last 3 months. This would be the fourth significant monthly increase in a row following over a year of declines in response to higher interest rates and economic conditions. July’s increase was led by single-family homes (1.3%), followed by apartments and townhomes (1.0%). With this month’s results, the MLS HPI continues to drift further from its pre-pandemic levels, now sitting at 39% above, reducing the correction from its February 2022 peak to only 10% (the trough reached in March 2023 was 15% below the peak).
IMPLICATIONS
Home sales were relatively unchanged in July, recording less than a one percent decline compared to June. June itself had displayed a slower pace of sales increases relative to the start of the year, which was characterized by a premature resurgence of rally-like activity driven largely by the widespread conviction at the time that the Bank of Canada was done its tightening cycle and cuts were imminent. This resurgence had in some part fueled the BoC’s June’s decision to resume its tightening cycle and adopt a more hawkish tone on the path of future policy rates as it undermined the BoC’s efforts to slow down economic activity and bring inflation back to 2% target.
As discussed in last month’s report (see here), the two recent hikes by the BoC and the change in tone pushed variable and fixed rates up, increasing the cost of borrowing and slowing demand through that channel. However, we continue to believe that the bigger driver of the slowdown in housing activity in recent months is the uncertainty effect created by the BoC actions. By signalling that a pause is not a guarantee of an end, uncertainty about future outcomes of rates, inflation, and economic activity likely dawned on potential buyers, while also helping thwart speculative activity—the latter more sensitive to the change in narrative as it implies higher borrowing costs for longer and lower profitability.
Taking a step back from month-to-month comparisons, the number of sales transactions in July was exactly aligned with the 2000–19 average observed for the month, indicating a return to a more sustainable level of housing activity, which makes a stable level of activity between July and June make even more sense.
However, merely being aligned with what was considered a more sustainable long-term average relative to recent years does not mean all is well with Canada’s housing market as affordability remains out of reach for many first-time home buyers and supply continues to lag. In fact, home prices continued to increase in July, marking the fourth consecutive monthly increase (after the price correction that lasted for 13 months during the BoC tightening cycle) and reflecting fundamental imbalances in market conditions.
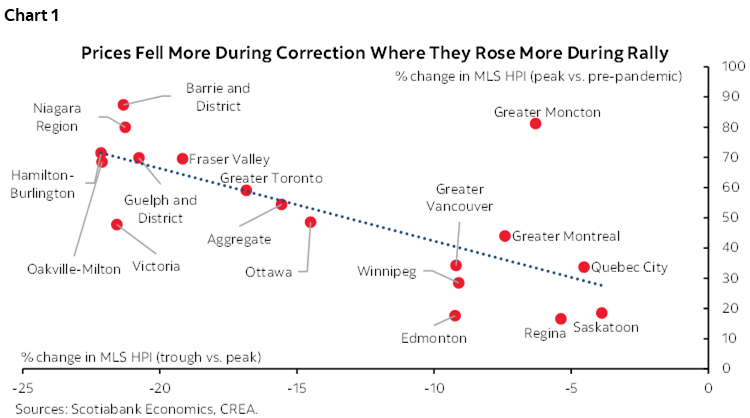
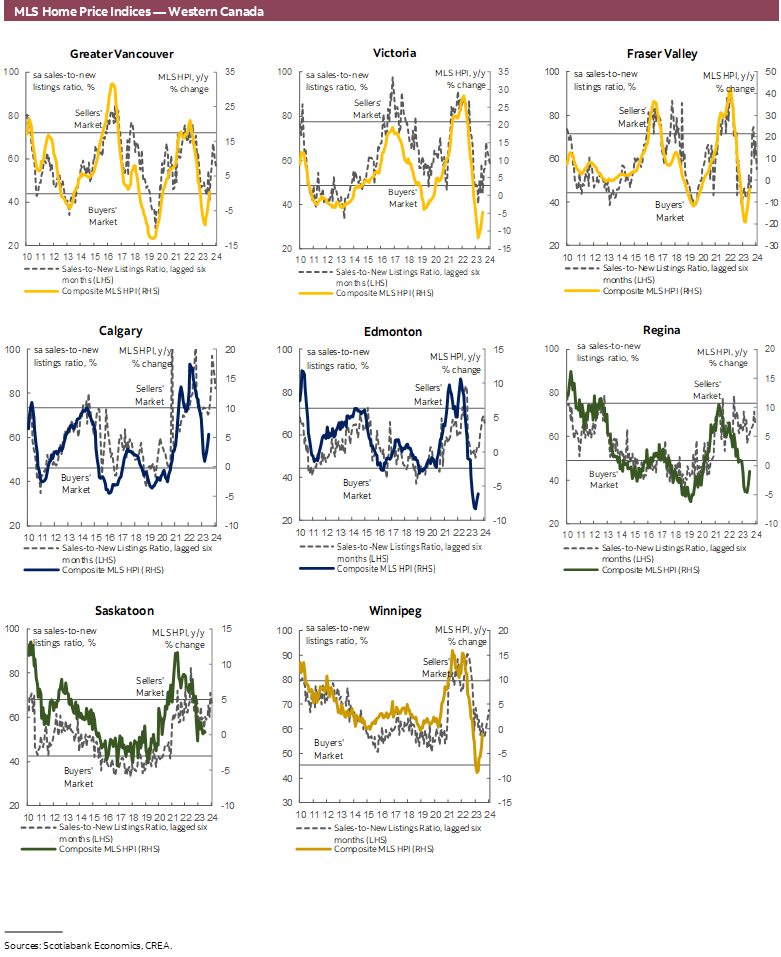
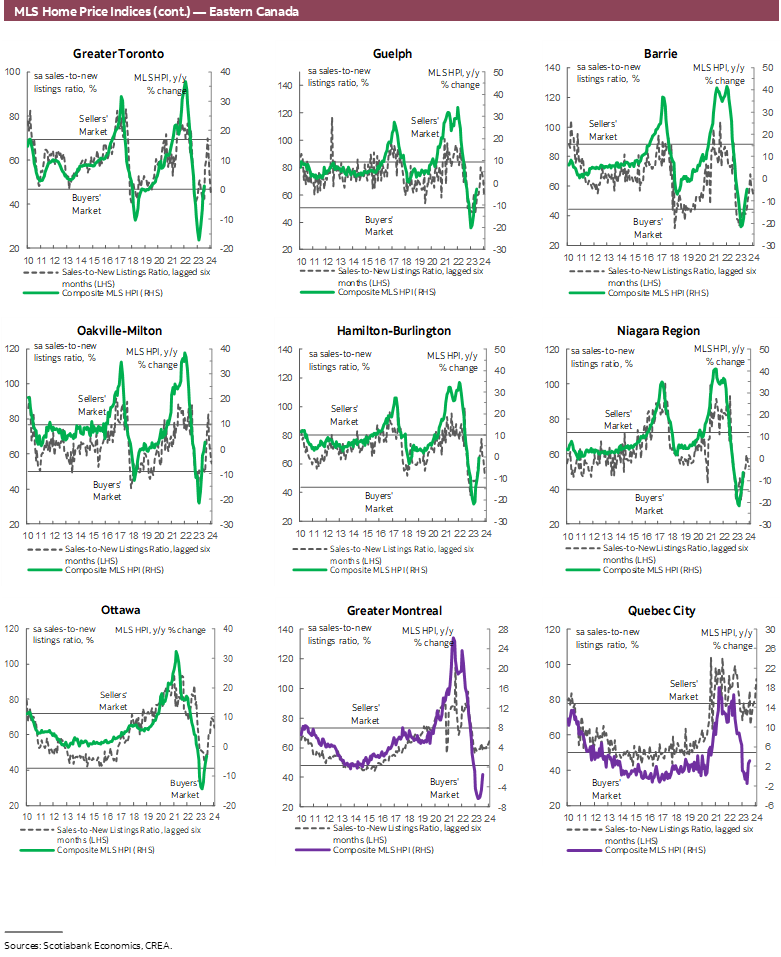
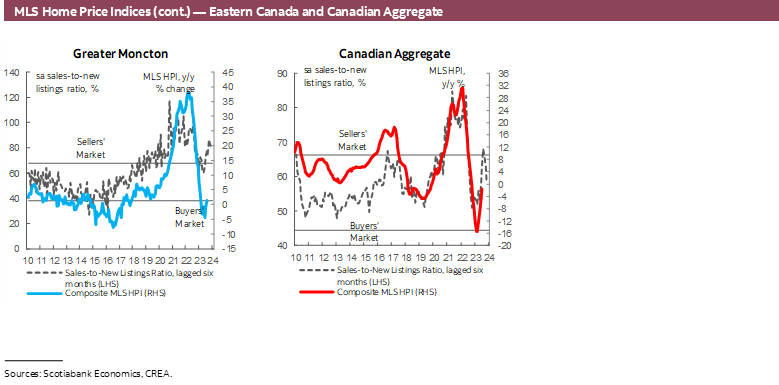
There are of course regional differences in these price movements. In the spirit of taking a step back, it’s good to remember that much of the price declines during those 13 months represented a claw-back of the unsustainable and unjustifiable increases during the preceding pandemic-era rally, hence the price “correction”. Recall that prices fell the most during the correction in cities where they had peaked the most during the rally. Chart 1 plots the change in prices during the housing rally on the vertical axis—the change between each city’s peak price, which occurred, for most cities, around the time the BoC started hiking in February 2022, and the pre-pandemic price (February 2020)—against the change in prices during the correction on the horizontal axis—the change between each city’s trough price, which was reached earlier this year before prices started increasing again and that city’s peak price. The exception here is Calgary, where, except for a couple of small declines mid-last year, prices have continued to increase in the face of rate hikes and other developments, and as such there is no peak and no trough. For this reason charts 1 and 2 do not include Calgary.
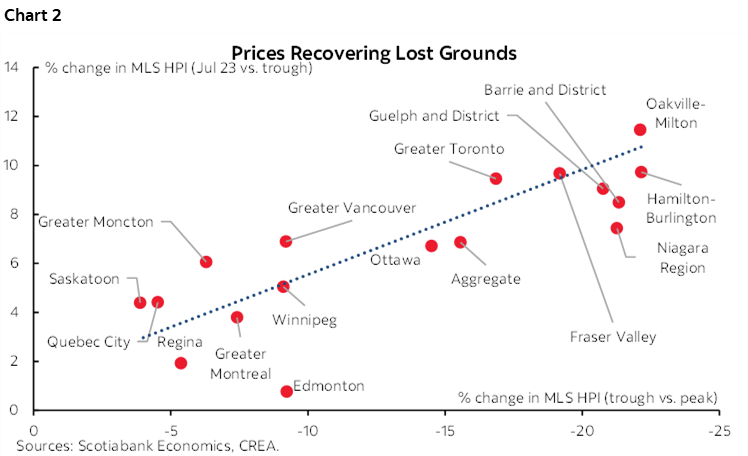
The increase in prices over the last 4 months seems to so far follow a similar logic, just in reverse. Chart 2 plots the change in prices during the correction again on the horizontal axis (values reversed) against the change in prices during the recent resurgence on the vertical axis—the change between each city’s July price and that city’s trough price. Prices are increasing more in regions where they had corrected towards their pre-pandemic levels more, representing a reversal of the much-needed improvement to affordability. Of course, price movements tend to lag sales activity, and indeed July’s increase was the smallest of the recent increases, so we might soon see an end to this pattern if sales continue to decline. However, we need a more proactive approach from all levels of government towards achieving more sustainable market conditions with concrete implications for prices and affordability rather than continue to be stuck in this pattern of what comes up must come down but the floor is a trampoline mounted too high for many Canadians to be able to reach and catch the jumping prices.
DISCLAIMER
This report has been prepared by Scotiabank Economics as a resource for the clients of Scotiabank. Opinions, estimates and projections contained herein are our own as of the date hereof and are subject to change without notice. The information and opinions contained herein have been compiled or arrived at from sources believed reliable but no representation or warranty, express or implied, is made as to their accuracy or completeness. Neither Scotiabank nor any of its officers, directors, partners, employees or affiliates accepts any liability whatsoever for any direct or consequential loss arising from any use of this report or its contents.
These reports are provided to you for informational purposes only. This report is not, and is not constructed as, an offer to sell or solicitation of any offer to buy any financial instrument, nor shall this report be construed as an opinion as to whether you should enter into any swap or trading strategy involving a swap or any other transaction. The information contained in this report is not intended to be, and does not constitute, a recommendation of a swap or trading strategy involving a swap within the meaning of U.S. Commodity Futures Trading Commission Regulation 23.434 and Appendix A thereto. This material is not intended to be individually tailored to your needs or characteristics and should not be viewed as a “call to action” or suggestion that you enter into a swap or trading strategy involving a swap or any other transaction. Scotiabank may engage in transactions in a manner inconsistent with the views discussed this report and may have positions, or be in the process of acquiring or disposing of positions, referred to in this report.
Scotiabank, its affiliates and any of their respective officers, directors and employees may from time to time take positions in currencies, act as managers, co-managers or underwriters of a public offering or act as principals or agents, deal in, own or act as market makers or advisors, brokers or commercial and/or investment bankers in relation to securities or related derivatives. As a result of these actions, Scotiabank may receive remuneration. All Scotiabank products and services are subject to the terms of applicable agreements and local regulations. Officers, directors and employees of Scotiabank and its affiliates may serve as directors of corporations.
Any securities discussed in this report may not be suitable for all investors. Scotiabank recommends that investors independently evaluate any issuer and security discussed in this report, and consult with any advisors they deem necessary prior to making any investment.
This report and all information, opinions and conclusions contained in it are protected by copyright. This information may not be reproduced without the prior express written consent of Scotiabank.
™ Trademark of The Bank of Nova Scotia. Used under license, where applicable.
Scotiabank, together with “Global Banking and Markets”, is a marketing name for the global corporate and investment banking and capital markets businesses of The Bank of Nova Scotia and certain of its affiliates in the countries where they operate, including; Scotiabank Europe plc; Scotiabank (Ireland) Designated Activity Company; Scotiabank Inverlat S.A., Institución de Banca Múltiple, Grupo Financiero Scotiabank Inverlat, Scotia Inverlat Casa de Bolsa, S.A. de C.V., Grupo Financiero Scotiabank Inverlat, Scotia Inverlat Derivados S.A. de C.V. – all members of the Scotiabank group and authorized users of the Scotiabank mark. The Bank of Nova Scotia is incorporated in Canada with limited liability and is authorised and regulated by the Office of the Superintendent of Financial Institutions Canada. The Bank of Nova Scotia is authorized by the UK Prudential Regulation Authority and is subject to regulation by the UK Financial Conduct Authority and limited regulation by the UK Prudential Regulation Authority. Details about the extent of The Bank of Nova Scotia's regulation by the UK Prudential Regulation Authority are available from us on request. Scotiabank Europe plc is authorized by the UK Prudential Regulation Authority and regulated by the UK Financial Conduct Authority and the UK Prudential Regulation Authority.
Scotiabank Inverlat, S.A., Scotia Inverlat Casa de Bolsa, S.A. de C.V, Grupo Financiero Scotiabank Inverlat, and Scotia Inverlat Derivados, S.A. de C.V., are each authorized and regulated by the Mexican financial authorities.
Not all products and services are offered in all jurisdictions. Services described are available in jurisdictions where permitted by law.