Next Week's Risk Dashboard
- Global inflation risk is rising again
- Soaring shipping costs to pass through to higher inflation
- Global wage pressures maintain upside risk to inflation
- Bank of Canada to hold, push back on cuts…
- …and possibly revisit QT plans
- Lagarde already set the script for the ECB
- BoJ unlikely to broach ending negative rates
- US GDP is set to beat the bears for a sixth time
- S/he who wins New Hampshire will probably be cursed
- Fed’s preferred PCE gauge could face coming upside risk
- Norges Bank is on an extended hold
- Bank Negara to keep an eye on the ringgit
- Turkey’s central bank is still fighting lira weakness
- US earnings season to pick up the pace
- PMIs to dominate other global readings
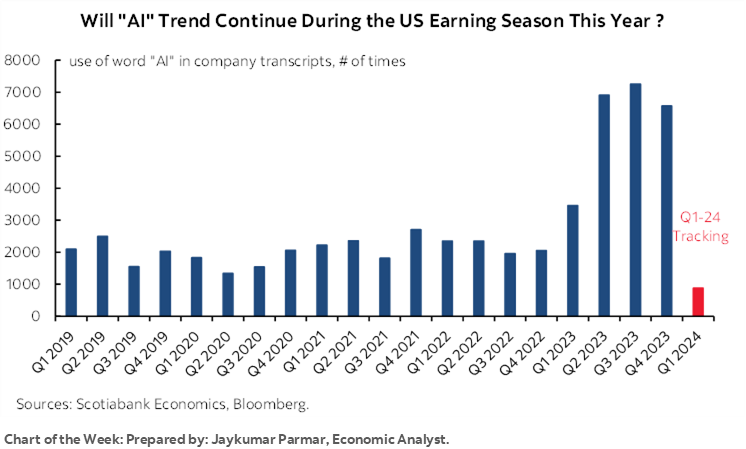
Chart of the Week
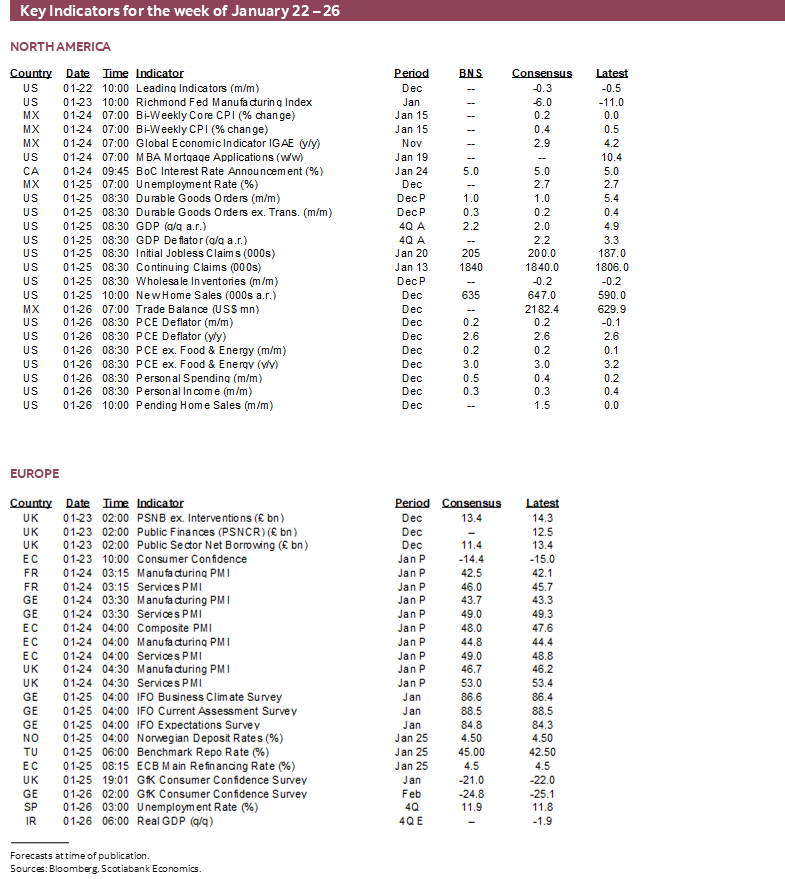
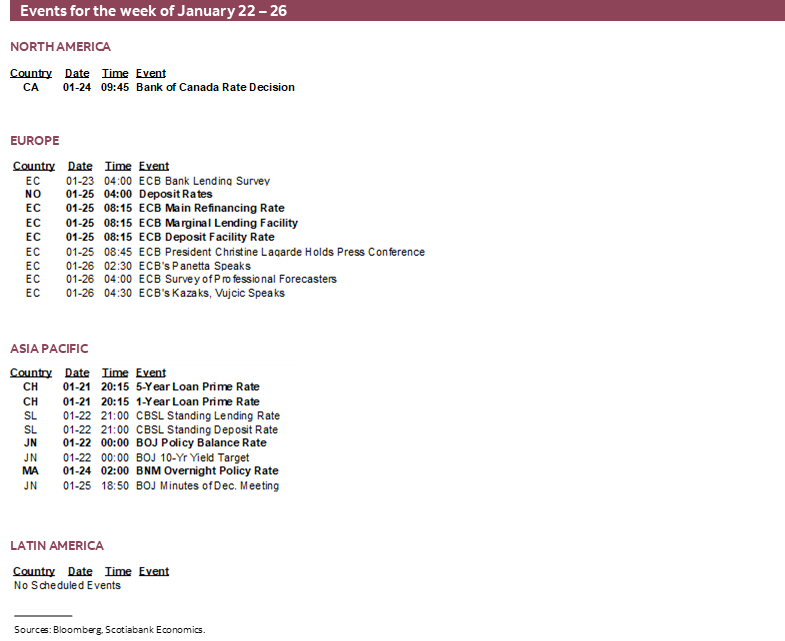
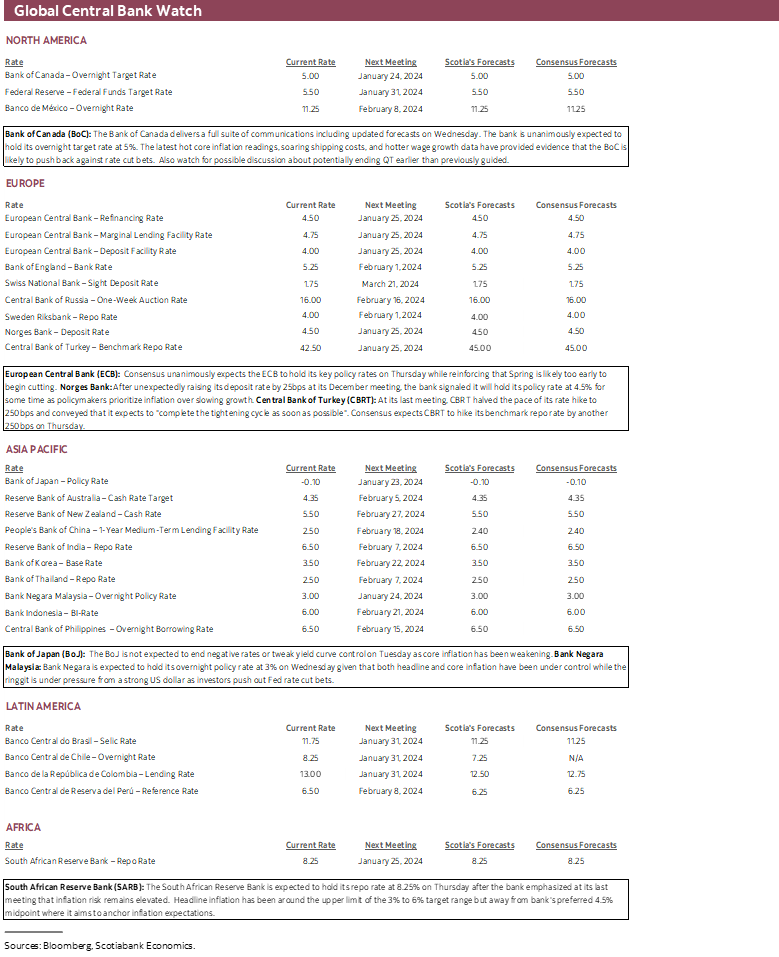
The coming week will bring out central bankers to begin delivering their freshest views and decisions for the new year. It has been a while since their last round of decisions before the holiday season in December. They are arguably being confronted by a new round of developments that inject further uncertainty into their plans.
Taking turns this week will be the Bank of Japan (Tuesday) followed by the Bank of Canada (Wednesday) and then the European Central Bank (Thursday). Also weighing in will be Bank Negara Malaysia (Wednesday), Norges Bank (Thursday), the South African Reserve Bank (Thursday) and of course everybody’s favourite, the Central Bank of Turkey (Thursday). The Federal Reserve will wait until the smoke has cleared when it weighs in the following week.
For most of them, the new information points toward renewed upside risk to inflation. A common theme across many of them is the renewed focus upon supply chain pressures that may reignite goods inflation. There are many manifestations of this, but the most readily quantifiable measure is shipping costs. I think some officials—like Fed Governor Waller’s recent remarks—have been too quick to dismiss what’s going on.
As chart 1 shows, shipping costs are surging across multiple global measures ranging from a global composite to regional variations. The Drewry World Container Index is one such global measure and it has soared by about 175% since November. Its rise pales in comparison to what happened during the pandemic, but it’s not insignificant just because its movement is so far less than the biggest history-busting disruption to supply chains ever witnessed during peacetime!
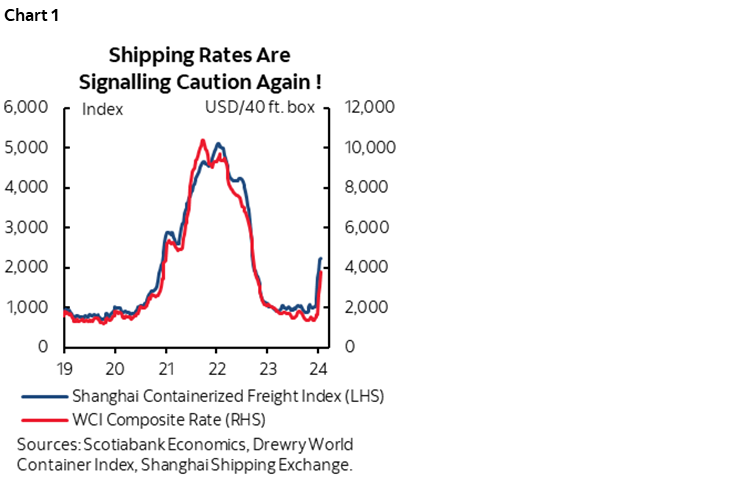
This IMF research paper that was done in early 2022 sought to estimate the passthrough effect of shipping costs into inflation across the world economy. They use a model of inflation that controls for other drivers such as output gaps, food and oil prices, industrial production, inflation expectations, and import shares of domestic consumption. I would encourage readers to review the whole study, but here’s what they had to say by way of punchlines:
“The results, based on a sample of 46 countries from February 1992 to December 2021, suggest that increases in global shipping costs have non-negligible, persistent, and statistically significant effect on domestic inflation. A one-standard-deviation (21.8 percentage points) increase in global shipping costs typically increases domestic headline inflation by 0.15 percentage point over 12 months. The effect increases gradually, peaks after 12 months, and reverts six months later. The response is similar for core inflation, but the magnitude of the effect is about one third of the effect on headline inflation. Responses for import and producer prices materialize much faster and are larger in magnitude.”
“These results help to understand better the dynamic effects of shipping costs on headline inflation. Following an increase in shipping costs, import prices rise strongly and quickly, and are quickly passed through to producer prices. The response of core inflation—which excludes food and energy—builds more slowly, and peaks 12 months after the shock. The impact on headline prices follows a similar pattern and tapers off after 12 months, when import and producer price inflation return to their pre-shock levels.”
The 175% rise in global shipping costs since November is about 8 times their one-standard-deviation (21.8%) increase behind the estimated effects upon inflation within a one-year horizon. A caution against going that high is that we wouldn’t want to overreact to a very recent surge that may or may not build upon itself and that may or may not be sustained. Further, the study used the Baltic Dry Goods measure of shipping costs which has not risen this year, but that underestimates the current type of surging shipping costs because by definition it focuses upon dry bulk commodities like grain, coal, iron ore and other commodities. The disruptions to shipping lanes in the Red Sea, the Panama Canal and risks facing Taiwan reflect a different type of east-west trade across more consumer and capital goods. That said, the WCI measure of shipping costs is highly correlated with the Baltic Dry measure used in the study throughout most of history.
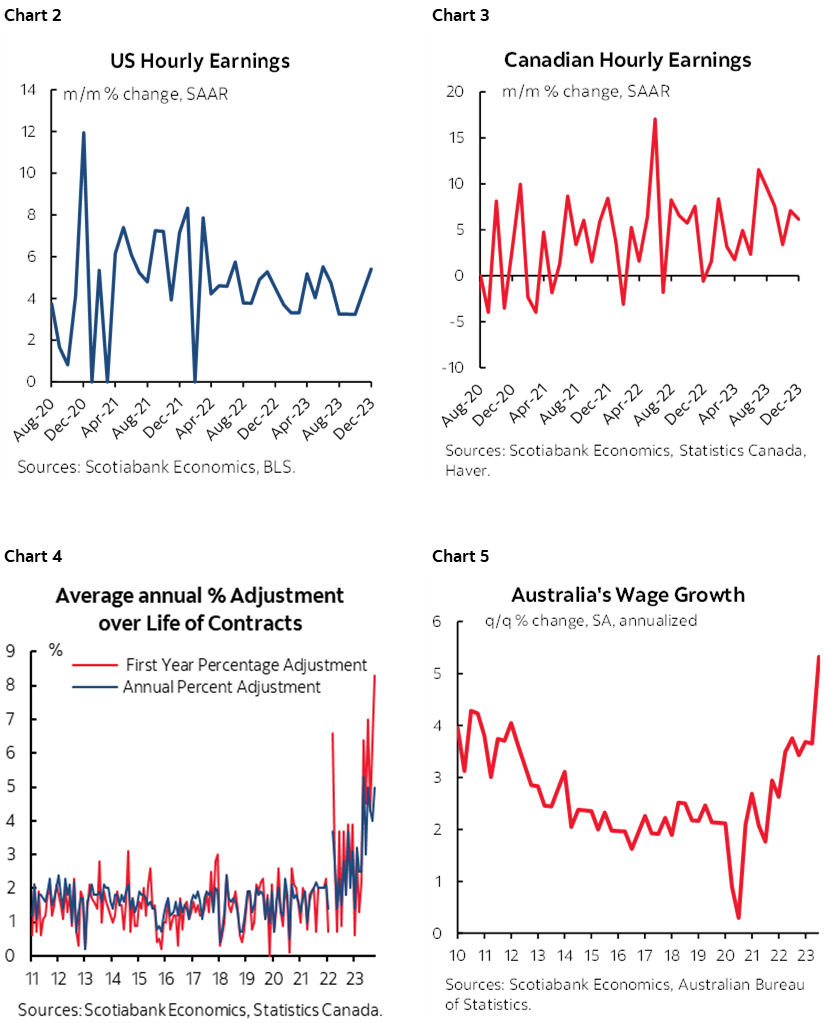
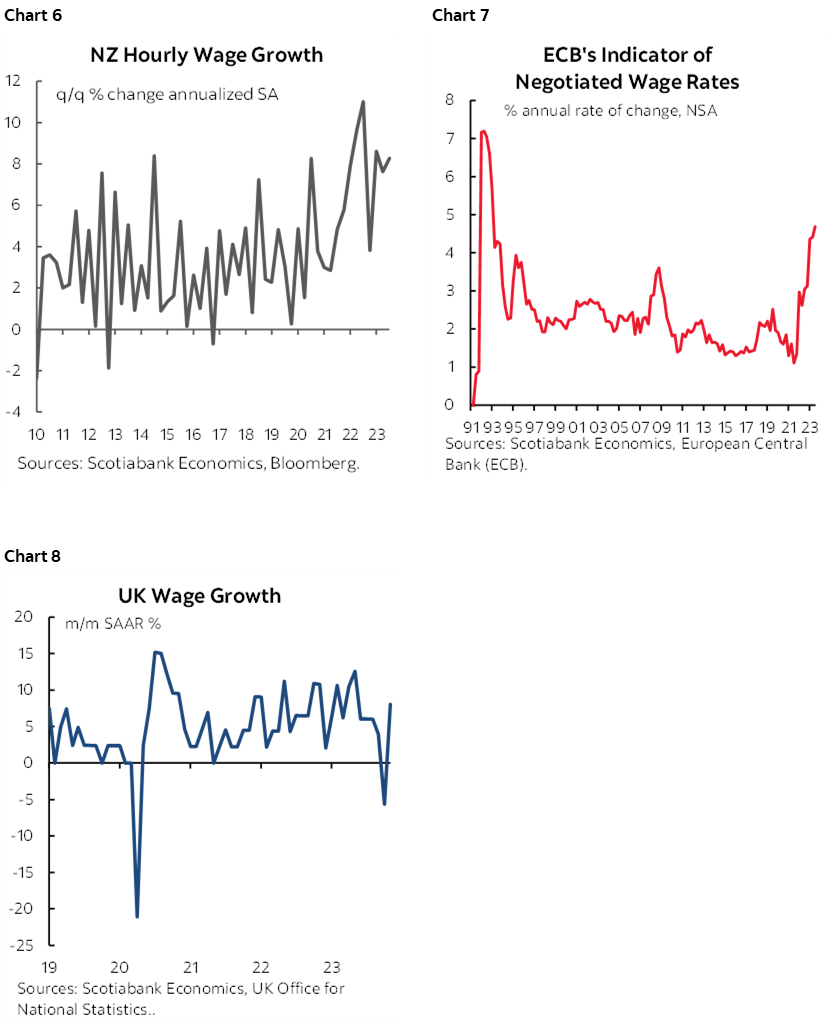
As explored below, there are other considerations weighing upon the outlook for central banks. US economic resilience is once again likely to push out expectations for economic slack to drive inflation lower when Q4 GDP lands this week. Canada is bearing witness to idiosyncratic inflation drivers and hard evidence of a recent reacceleration of underlying inflation. Wage growth is a common challenge across central banks (charts 2–8). It seems that this cycle is presenting a very different sort of systemic wage pressures than witness in a long time.
Amid a likely inflection point toward higher inflation risk to begin the new year, central banks at the management level will probably remain much more cautious and patient while evaluating inflation risk than markets have tended to be. They are likely to remain skeptical if not downright distrustful toward their staff’s model predictions versus a show-me-the-proof approach to requiring a very sustained period of low and stable inflation. Easing in advance of forecast softening of inflation relies upon vastly greater ability to forecast inflation than anything their staffers have demonstrated to date.
BANK OF CANADA—ACCELERATING CORE INFLATION RAISES A NEW TWIST
The Bank of Canada’s full suite of communications lands on Wednesday. The policy statement, the Monetary Policy Report including fresh forecasts, and the Governor’s opening remarks to be delivered at his press conference will all arrive at 9:45amET. They will be followed by a press conference held by Governor Macklem and SDG Rogers at 10:30amET that will start with the Governor reading his statement and then move to Q&A with the press.
No change is expected to the policy rate. Nothing is priced in markets and no one in consensus expects any change.
Inflation Setbacks
Forward guidance will be key to watch. Governor Macklem said during his pre-holiday speech on December 15th that “underlying inflationary pressures are easing in much of the economy.” The October MPR forecast Q4 total CPI at 3.3% y/y and actual inflation was 3.2%. On the surface, that looks like a slightly faster degree of progress toward lower inflation. Much of that progress, however, has been driven by lower gasoline prices and year-ago base effects.
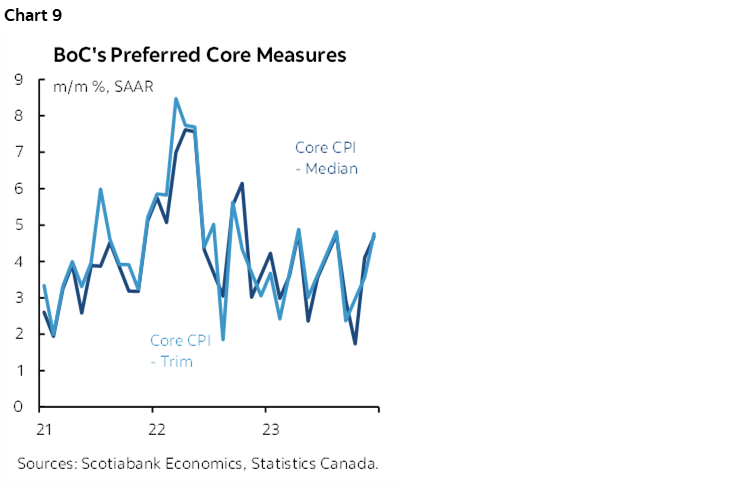
In reality, both trimmed mean CPI and weighted median CPI have accelerated over the past two months as shown in chart 9. Trimmed mean CPI was up by 3.6% m/m SAAR in November and another 4.8% in December. Weighted median CPI was up 4.1% in November and 4.7% in December. The BoC targets headline inflation of 2% over the medium-term but uses these gauges to assess whether they are on track toward achieving 2% because they weed out some of the more volatile components.
In light of this recent reacceleration of underlying inflation, the rise in global shipping costs, and the already present idiosyncratic drivers of Canadian inflation risk, I would be surprised to hear Macklem sounding incrementally more dovish. I think he’ll sound more cautious if anything and continue to intimate that markets are overly aggressive in pricing near-term rate cuts as he did in his pre-holiday speech when he said that they will want to see clear evidence through volatile readings that they are durably on track to 2% before easing:
“We can’t rule out bumps along the way” and “over coming months, you should expect to see some push and pull on inflation as the cooling economy reduces price pressures while other forces continue to exert upward pressure. That’s why further declines in inflation will likely be gradual. When it’s clear that inflation is on a sustained downward track, we can begin discussing lowering our policy interest rate.”
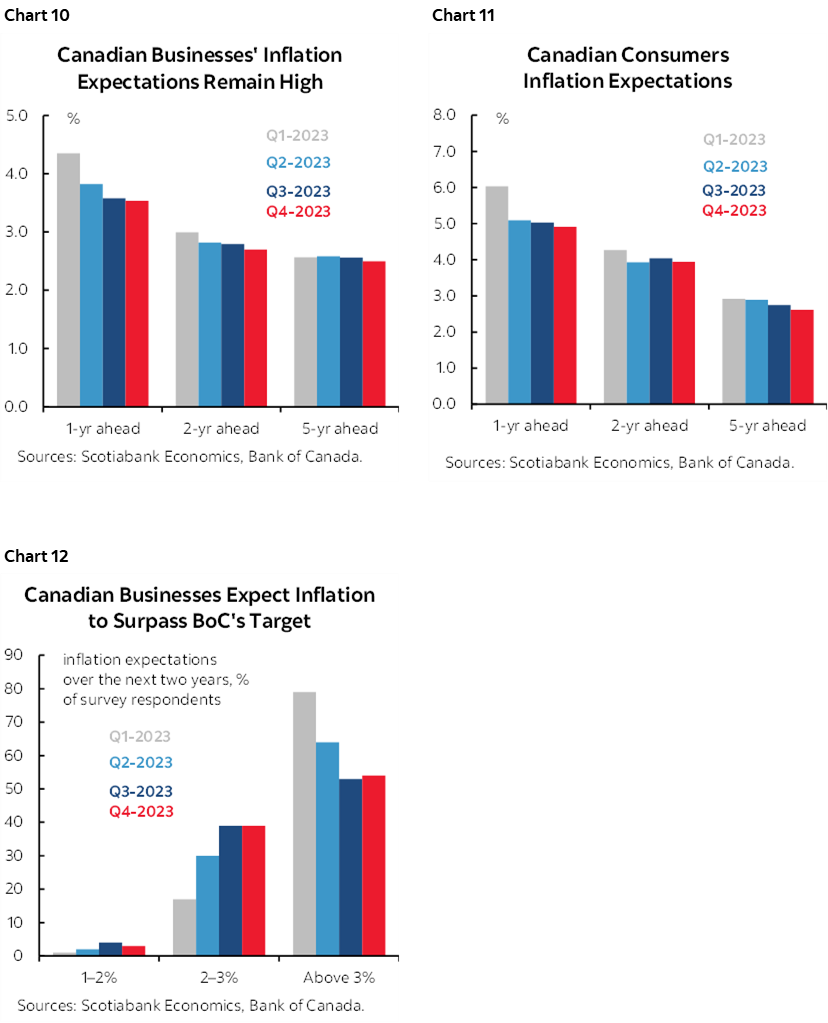
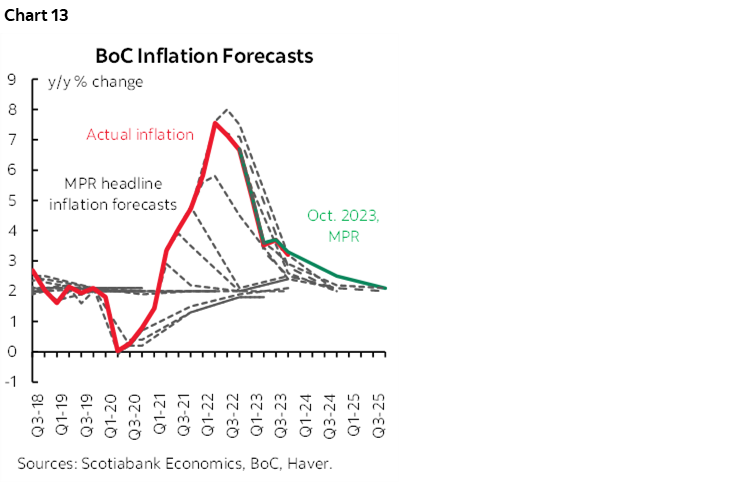
Well it’s not clear yet. It won’t be in 2–3 months either, and Macklem delivered those remarks before knowing about the fresh developments into the new year. At the same time, their freshest measures of inflation expectations remain sticky at elevated levels (chart 10–12). Wage growth is off the charts in the Labour Force Survey and in monthly wage settlements. That’s especially true relative to tumbling productivity. Immigration remains excessive relative to housing shortages. Fiscal policy continues to fight monetary policy. The US economy remains resilient. I’m not even a fan of the BoC’s guidance that they can cut before achieving 2% if it is forecast to occur given their track record at forecasting inflation (chart 13).
So cut by Spring you say? Not with that combination of developments while cutting into the Spring housing market would strongly risk reigniting the same imbalances all over again.
Clues on Balance Sheet Management?
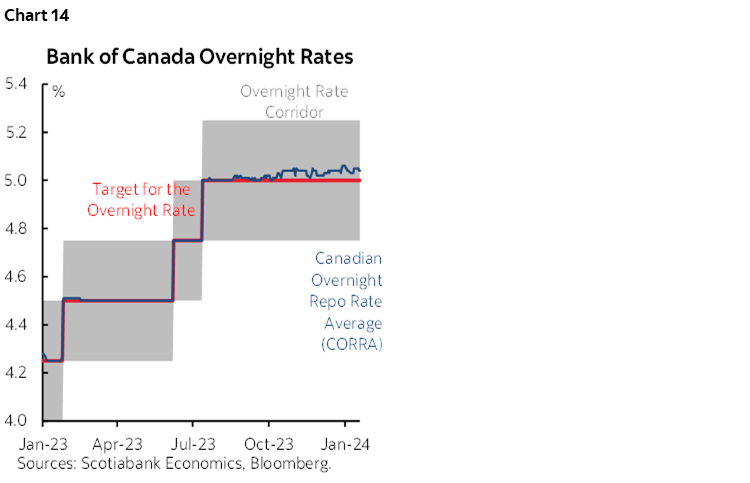
Where there might be bigger developments could be on balance sheet policy. I’ve written about the need to begin having a dialogue on when to curtail quantitative tightening since last Fall including a focus upon it in this piece back on December 1st. The Canadian Overnight Repo Rate Average (CORRA) continues to track 4–5bps above the BoC’s policy rate as it has been doing since late summer (chart 14).
In his speech last March, Deputy Governor Gravelle guided that the BoC was targeting settlement balances at $20–60 billion and that the pace of maturing bond holdings falling off the balance sheet and withdrawing liquidity from the system would achieve this goal toward the end of 2024 or early 2025. At that point, it was thought that balances would equal 1–2% of nominal GDP.
Gravelle did, however, say that these were uncertain targets and that the BoC would also be informed by market signals. I think the CORRA-O/N spread is just such a signal that they are pushing funding conditions to be too tight.
I do think the BoC will have to taper QT earlier than Gravelle said because:
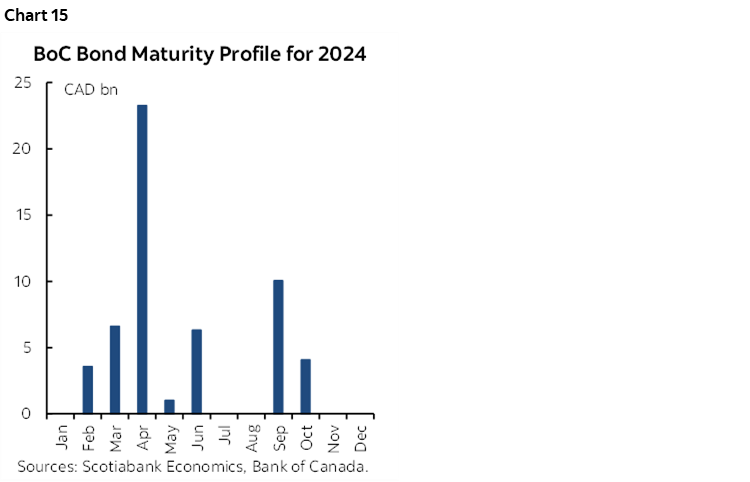
- Balances have sharply fallen from a peak of about $400 billion in early 2021 to about $113B now. That is rapidly approaching the BoC’s target.
- The maturity profile of the BoC’s GoC bond holdings has another $33.5 billion dropping off by April’s Fool’s day (chart 15). That may bring the BoC much closer to its target ranges for QT and with it greater pressure upon funding markets and more questions from market participants. It may be better for the BoC to provide guidance sooner rather than later.
- They probably went too lean in estimating how low they could push settlement balances (1–2% of NGDP) relative to the Fed (10–12%). Canada’s financial system is special (eg. more stable) but not that special. For example, abrupt turns in risk sentiment can hurt Canada by more than the US.
- external developments such as the Fed’s funding market pressures are spilling over into Canada and probably earlier than either central bank expected. The Fed is widely thought to be on track to start ending QT later this year.
- Government bond issuance is bigger for longer than what was probably imagined last March when the BoC laid out the QT goalposts. That’s true in both countries and with it go the funding market implications.
- In fairness to Gravelle, he did say that the $20–60B target for balances toward the end of 2024–25 was a bit of a spit balling exercise and that they would monitor market signals.
- Those market signals are warning them. Even with aggressive repo/liquidity injections so far this year, CORRA continues to trade modestly above the o/n rate. It would trade even higher if not for those injections.
- Repo isn’t a good substitute for tapering QT imo. It keeps markets guessing for how long the BoC will keep up repo operations, how much they may do, and under what terms.
- The cleaner solution is to address the root of the problem which is probably that QT is having adverse effects upon funding markets. It’s important for the BoC to be able to steer markets toward their policy rate and their credibility is at stake in that regard given where CORRA sits.
Given the uncertainties, I think it would be prudent to move toward a one-off reduction of the 100% roll-off rate of maturing bonds. They don’t have to pre-commit to the future path, but they should begin the process and retain flexibility in future. The longer CORRA is under pressure, the more likely they’ll have to do so.
If Macklem doesn’t proactively offer up something on this at the January press conference, then I wouldn’t be surprised if he’s asked to at least comment in the presser. If they are not open to adjusting QT, then they should explain their plans for the repo book in more transparent fashion. It’s a long path ahead in terms of repo injections if they keep relying upon that tool until the next meeting or the one after that.
There are three benefits/effects to adjusting QT:
- One is to restore order to funding markets and the BoC’s ability to enforce its target market.
- Two is that it would improve their flexibility on the overall policy framework in future. I personally think they would want to end QT—or be close to doing so—around the first cut. That would be symmetrical to the approach taken in the opposite direction when they shut down QE, very briefly engaged in full reinvestment, then went with 100% roll-off at about the same time they began hiking. Tiptoeing along that path starting soon could give them the benefit of offering policy consistency (ie: not cutting while withdrawing liquidity through QT).
- Last, there may be a rate equivalance effect. I don’t know what that is. But maybe ending QT has the equivalent effect of, say, a quarter-point reduction in the policy rate.
ECB—THE TABLE HAS ALREADY BEEN SET
President Lagarde already set the tone for what to expect in Thursday’s announcements and press conference. While attending Davos, she had this to say about market pricing for rate cuts:
“It is not helping our fight against inflation if the anticipation is such that they are way too high compared with what’s likely to happen.”
The emphasis should be placed upon ‘way too high’ expectations for nearer term easing. When asked directly about a summertime cut relative to earlier pricing she said “I would say it’s likely” while going on to stress that they are still data dependent.
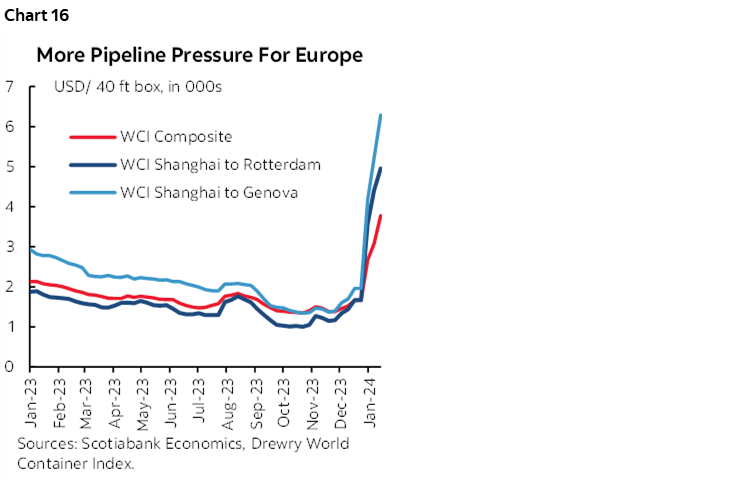
Also on their minds will be that measures of shipping costs to Europe are taking it particularly hard on the chin (chart 16).
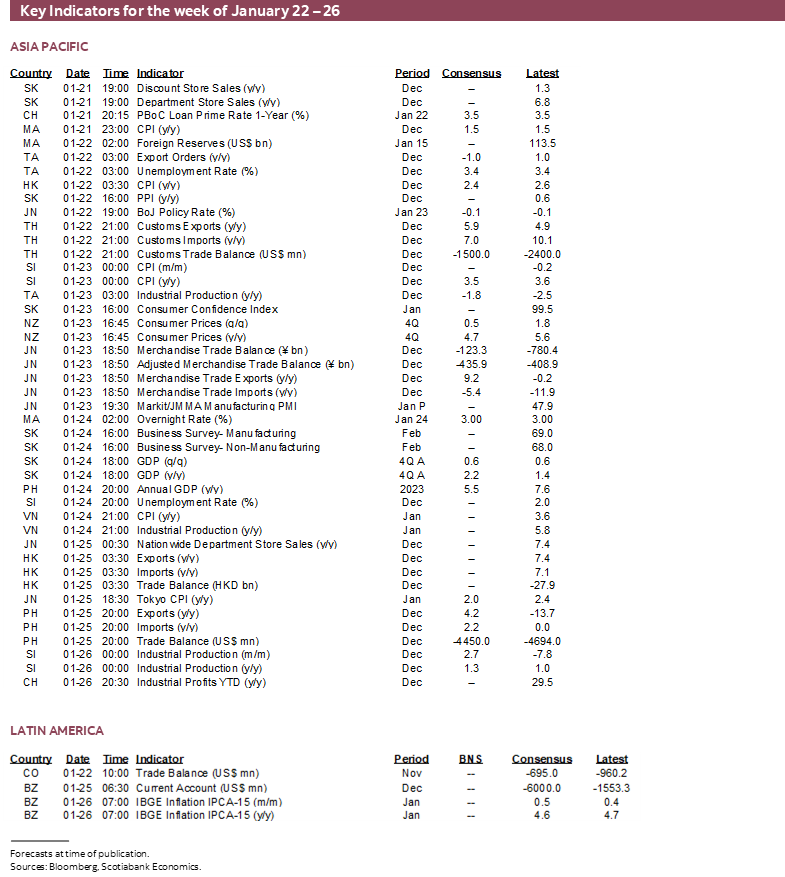
BANK OF JAPAN—WANING CORE MERITS CAUTION
With the usual caution that the BoJ seems to enjoy surprising markets, there is probably little reason to expect Governor Ueda to indicate a desire toward ending negative rates or tweaking yield curve control on Tuesday.
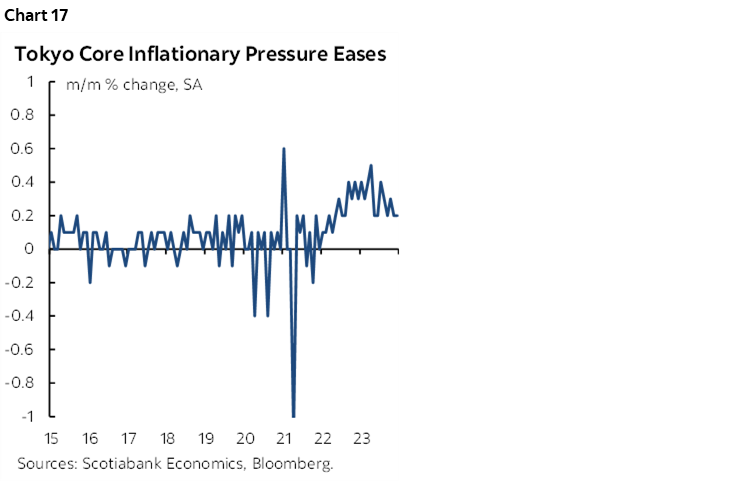
Core inflation has weakened compared to the acceleration that was unfolding over 2022H2 into early 2023 (chart 17). It may well be that the effects of prior increases in oil prices and prior yen depreciation have worked through the CPI basket as temporary effects, leaving soft underlying pressures in their wake. If Ueda did not have the confidence to lift off and out of negative rates when core inflation was higher, he’s unlikely to have it now.
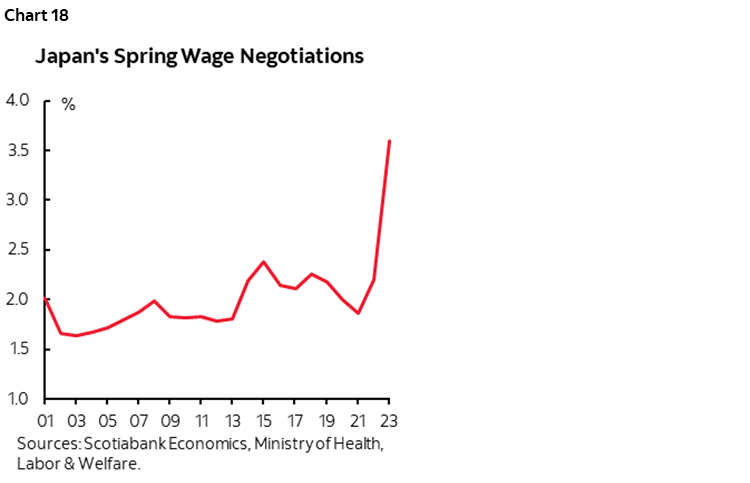
The next test for the BoJ is likely to be the Spring wage negotiations and whether they turn in the strongest back-to-back wage increases in decades (chart 18).
NORGES BANK—HOLDING PATTERN
Norway’s central bank is widely expected to stay on hold at a deposit rate of 4.5% on Thursday. After delivering a surprise 25bps hike in December, Norges said “the policy rate will likely be kept at that level for some time ahead.” More important may be forward guidance in the context of market pricing for the first rate cut by June. In its December statement, Norges said that it would probably leave its policy rate unchanged “until autumn 2024 before gradually moving down.” There will not be another forecast update with explicit forward rate guidance until March.
BANK NEGARA—RINGGIT DEPRECIATION RESTRAINS FLEXIBILITY
Malaysia’s central bank is widely expected to remain on hold at 3% again on Wednesday. Another rinflation update at the start of the week is likely to continue to show CPI running at about a 1 ½% y/y clip with core inflation at about 2%. Low inflation is one thing. Risking currency instability is another and that is likely to be the dominant consideration. The ringgit has been mildly depreciating since the beginning of the year relative to the USD as market pricing for Fed rate hikes has been pushed out. Like many other central banks, the ability to cut the policy rate may rise as Fed rate cuts draw nearer but for now the easing is occurring through the local currency.
SARB—CONTINUING TO HOLD
Consensus unanimously expects the South African Reserve Bank to hold its repo rate constant at 8.25% on Thursday. Another inflation report for December arrives the day before. At 5.2% y/y and 4.3% y/y for headline and core CPI respectively, inflation remains in the upper ranges of SARB’s 4.5% +/- 150bps inflation target range while global inflation risk may be pivoting higher.
CENTRAL BANK OF TURKEY—STILL FIGHTING THE LIRA
Turkey’s central bank is widely expected to deliver another hike on Thursday with consensus pegging the amount at +250bps. That would raise the one-week repo rate to 45%. The door remained open to another hike at the last meeting on December 21st when guidance was to “complete the tightening cycle as soon as possible.”
Ergo, it wasn’t complete at the time, but the downshifted pace of hiking to +2.5% at the December meeting compared to much larger hikes in prior meetings probably means that this week’s increase will be no larger than the prior one and perhaps smaller. So why has consensus not gone smaller? The lira has depreciated by another 3½% to the USD since the December hike and the central bank has been fighting currency-motivated import price pressures all along. Because of the uncertainty over the direction of the currency, the central bank may resist shutting the door on additional tightening.
US GDP—ECONOMIC RESILIENCE CONTINUES
Consensus appears to have underestimated momentum in the US economy for the sixth consecutive quarter. We’ll find out for sure on Thursday when Q4 GDP is released, although GDP may understate underlying strength in the US economy.
Chart 19 shows that consensus has lowballed prospects for the US economy in each of the past six quarters. Forecasters have come into each quarter over this period expecting either contractions or very soft growth, only to spend the whole quarter revising up their forecasts.
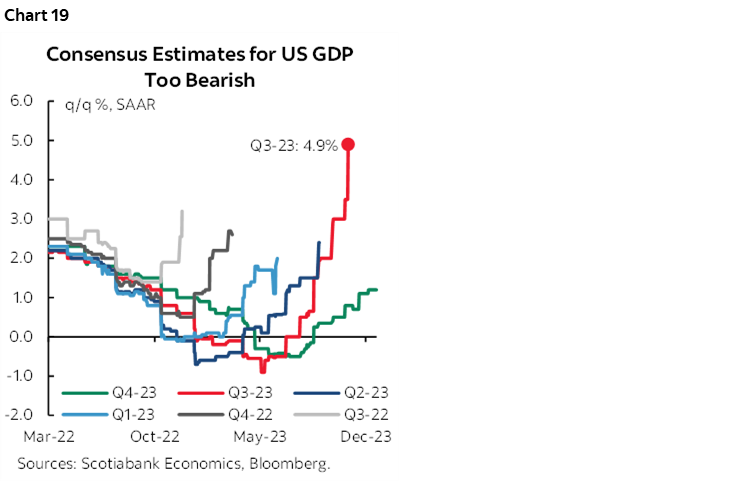
Q4 is no different. The economy probably grew by about 2¼% q/q SAAR which would be incredible after growing by just under 5% in Q3. Fed-speak has said that’s evidence of slowing and how policy is working. That may be an exaggeration. If this Q4 estimate is on the mark, then it signals an economy that is simply not taking any steps along the path toward opening up disinflationary slack as it continues to grow faster than estimates of the economy’s potential noninflationary speed limit.
By way of comparison, the Atlanta Federal Reserve and the New York Federal Reserve have issued ‘nowcast’ estimates of Q4 growth equaling 2.4% while the St. Louis Fed’s measure is 2%. Most estimates within consensus are clustered around a high-1% to low-2% reading.
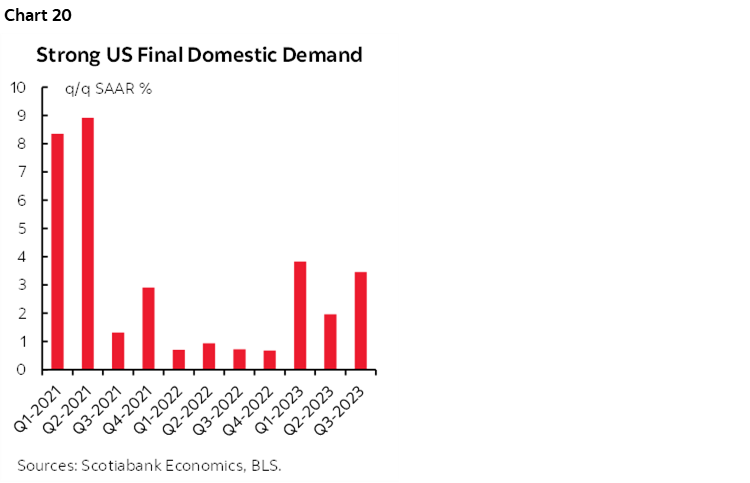
Underlying momentum in the domestic economy is likely to be even quicker than GDP. Key is final domestic demand that excludes inventory swings and changes in net export contributions to growth to focus upon consumption, housing and business investment, plus government spending. Inventory accumulation slowed in Q4 and this lower pace of investment will drag on GDP growth. It’s feasible that FDD growth will rival the 3.7% pace that was registered in Q3 (chart 20).
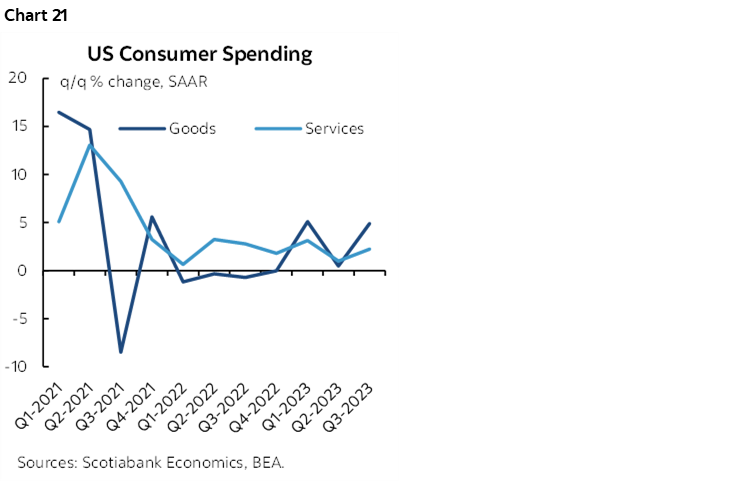
A big reason why this has been the case is the ongoing strength of US consumer spending (chart 21). Q4 probably saw inflation-adjusted consumption growth of just under 3% q/q SAAR. One day after GDP we’ll get the latest monthly consumer spending numbers for December that will probably grow by about 0.5% m/m SA in keeping with the strength we saw in December’s retail sales numbers that grew by 0.6% m/m.
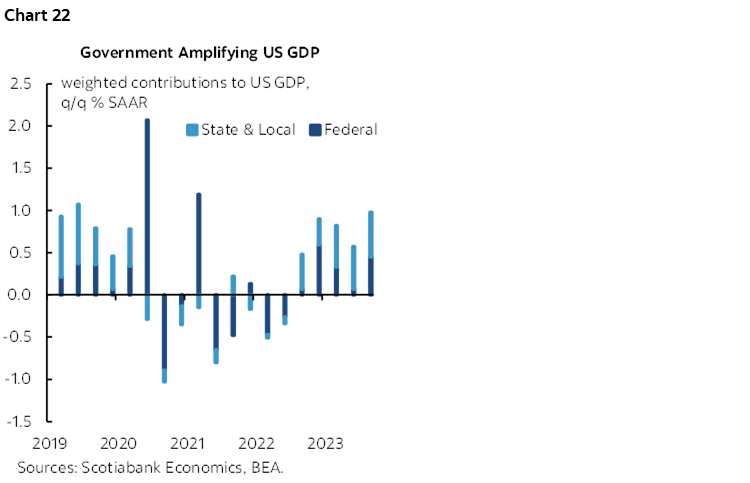
A much less significant reason has been ongoing contributions to growth from government spending (chart 22). An economy growing like the US begs the question why fiscal policy continues to prime the pump rather than having shifted long ago toward repairing the damage to US government finances that was done by the pandemic. The damage is continuing.
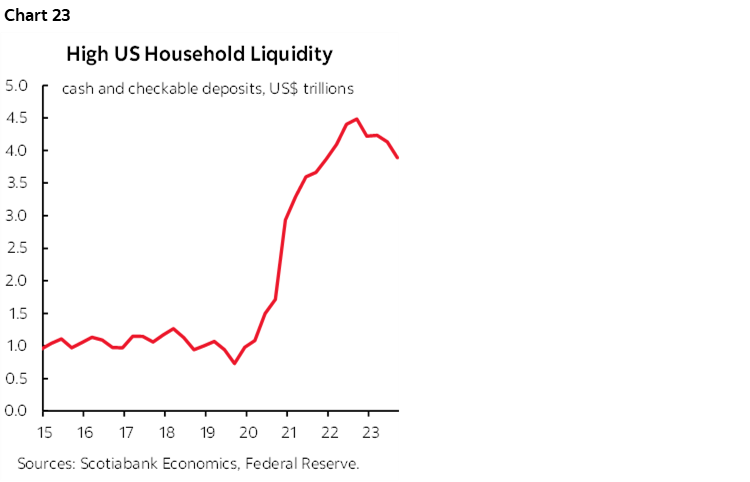
Mixed in with the December readings will be updates on income growth and the Fed’s preferred inflation readings. Incomes are roughly estimated to have grown by 0.3% which means the potentially faster consumption growth might have dipped into wealth and very high ongoing cash and liquid deposits held by households (chart 23).
The Fed’s preferred inflation gauges are the price deflator for total consumer spending and the deflator excluding food and energy. After CPI landed at 0.3% m/m in December for headline and core prices, PCE is expected to be a touch softer at 0.2% for both readings.
ONTO NEW HAMPSHIRE—A POOR PREDICTOR OF SUCCESS
Can he do it again? Probably. Does it matter? Probably not.
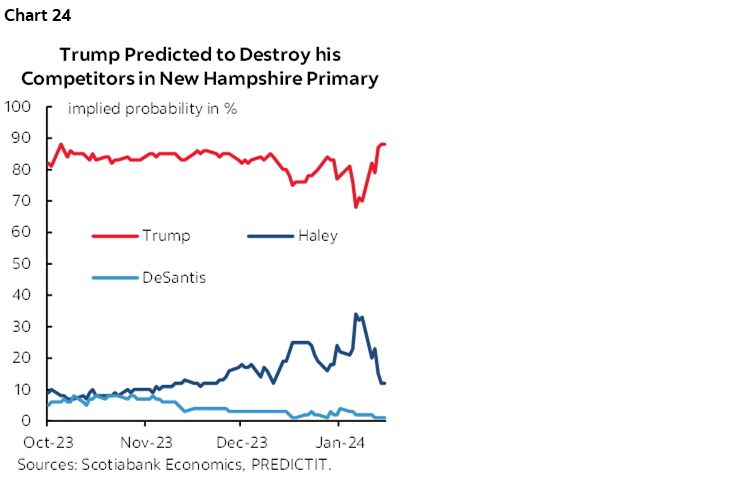
The second event on the protracted US election calendar will be held on Tuesday when the New Hampshire primary occurs. Trump is once again the odds-on favourite to win it (chart 24). He is polling well relative to Ron DeSantis and Nikki Haley (here), but not as well as he was into the Iowa caucuses.
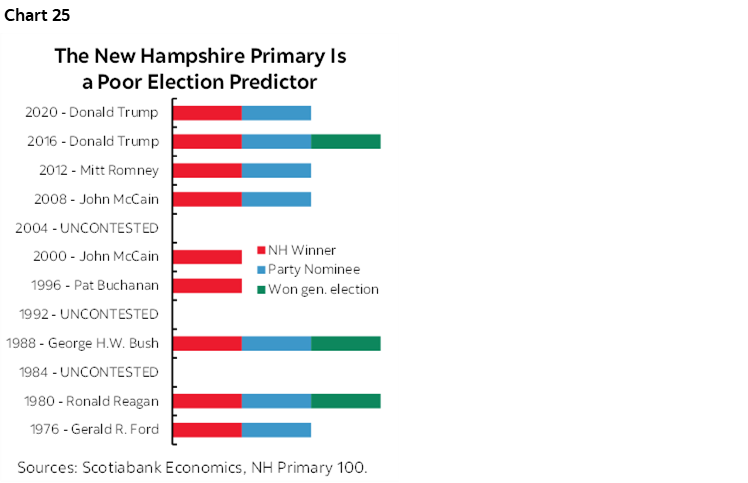
The New Hampshire Republican primary has a good track record in terms of predicting who will ultimately become the Republican Party’s nominee, but not such a good track record at predicting whether that person will win the general election (chart 25). Across all New Hampshire Republican primaries since 1976, the victor became President in only three out of nine times with the latest failure being Trump’s election loss in 2020. If Trump makes you shiver, then this track record may be comforting.
This time around, the NH primary only matters to the Republicans partially because no one is a serious challenger to President Biden for as long as he continues to declare his intentions to run and partly because the Dems are embroiled in a dispute that will make the results for them purely symbolic.
EARNINGS—A SOFT START
Seventy-six S&P500-listed firms will release Q4 and full year earnings this week as the earnings season broadens out. Key names will include Intel, Microsoft, Tesla, Visa, Amex, Netflix, GE, 3M, AT&T, United Airlines.
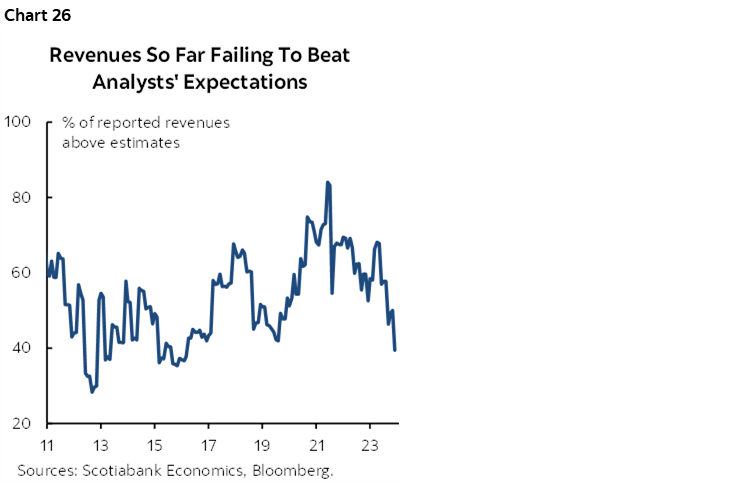
So far, with only about 10% of reporting companies in the book, the season has been somewhat of a disappointment especially on the revenues front (chart 26).
GLOBAL MACRO—PMIs TO DOMINATE
The monthly batch of global purchasing managers’ indices for January will dominate the rest of the macro indicator line-up. Australia and Japan will release first on Tuesday evening (ET). Then Eurozone and UK PMIs will be released on Wednesday morning and followed by the US S&P PMIs a few hours later. Other confidence gauges such as German IFO business confidence (Thursday) and German consumer confidence (Friday) are also due out.
The rest of the US macro line-up will be light. Durable goods orders during December will probably post a decent gain on the back or higher aircraft orders (Thursday). US jobless claims remain very low with the latest week having back down toward the post-pandemic low of 182k that was set in September 2022 (Thursday). New home sales in December probably bounced back with a sizeable gain given advance indicators like the rise in model home visits (Thursday) while pending home sales during December (Friday) will inform momentum on the resale side of the housing market.
Other global releases will be very, very light. New Zealand updates Q4 inflation that is expected to post the coolest gain since the early days of the pandemic. Markets are pricing the first RBNZ rate cut to occur by July with most of a cut priced by May.
South Korean GDP growth (Wednesday) is expected to remain resilient at about a 2 ½% q/q SAAR pace which would be identical to the prior two quarters.
Japan releases the Tokyo CPI measure for January on Thursday after the Bank of Japan’s decision earlier in the week and key will be whether it extends the trend of relatively soft readings.
LatAm markets will focus upon Mexican bi-weekly CPI, the unemployment rate for December and exports for the same month from Wednesday through Friday.
DISCLAIMER
This report has been prepared by Scotiabank Economics as a resource for the clients of Scotiabank. Opinions, estimates and projections contained herein are our own as of the date hereof and are subject to change without notice. The information and opinions contained herein have been compiled or arrived at from sources believed reliable but no representation or warranty, express or implied, is made as to their accuracy or completeness. Neither Scotiabank nor any of its officers, directors, partners, employees or affiliates accepts any liability whatsoever for any direct or consequential loss arising from any use of this report or its contents.
These reports are provided to you for informational purposes only. This report is not, and is not constructed as, an offer to sell or solicitation of any offer to buy any financial instrument, nor shall this report be construed as an opinion as to whether you should enter into any swap or trading strategy involving a swap or any other transaction. The information contained in this report is not intended to be, and does not constitute, a recommendation of a swap or trading strategy involving a swap within the meaning of U.S. Commodity Futures Trading Commission Regulation 23.434 and Appendix A thereto. This material is not intended to be individually tailored to your needs or characteristics and should not be viewed as a “call to action” or suggestion that you enter into a swap or trading strategy involving a swap or any other transaction. Scotiabank may engage in transactions in a manner inconsistent with the views discussed this report and may have positions, or be in the process of acquiring or disposing of positions, referred to in this report.
Scotiabank, its affiliates and any of their respective officers, directors and employees may from time to time take positions in currencies, act as managers, co-managers or underwriters of a public offering or act as principals or agents, deal in, own or act as market makers or advisors, brokers or commercial and/or investment bankers in relation to securities or related derivatives. As a result of these actions, Scotiabank may receive remuneration. All Scotiabank products and services are subject to the terms of applicable agreements and local regulations. Officers, directors and employees of Scotiabank and its affiliates may serve as directors of corporations.
Any securities discussed in this report may not be suitable for all investors. Scotiabank recommends that investors independently evaluate any issuer and security discussed in this report, and consult with any advisors they deem necessary prior to making any investment.
This report and all information, opinions and conclusions contained in it are protected by copyright. This information may not be reproduced without the prior express written consent of Scotiabank.
™ Trademark of The Bank of Nova Scotia. Used under license, where applicable.
Scotiabank, together with “Global Banking and Markets”, is a marketing name for the global corporate and investment banking and capital markets businesses of The Bank of Nova Scotia and certain of its affiliates in the countries where they operate, including; Scotiabank Europe plc; Scotiabank (Ireland) Designated Activity Company; Scotiabank Inverlat S.A., Institución de Banca Múltiple, Grupo Financiero Scotiabank Inverlat, Scotia Inverlat Casa de Bolsa, S.A. de C.V., Grupo Financiero Scotiabank Inverlat, Scotia Inverlat Derivados S.A. de C.V. – all members of the Scotiabank group and authorized users of the Scotiabank mark. The Bank of Nova Scotia is incorporated in Canada with limited liability and is authorised and regulated by the Office of the Superintendent of Financial Institutions Canada. The Bank of Nova Scotia is authorized by the UK Prudential Regulation Authority and is subject to regulation by the UK Financial Conduct Authority and limited regulation by the UK Prudential Regulation Authority. Details about the extent of The Bank of Nova Scotia's regulation by the UK Prudential Regulation Authority are available from us on request. Scotiabank Europe plc is authorized by the UK Prudential Regulation Authority and regulated by the UK Financial Conduct Authority and the UK Prudential Regulation Authority.
Scotiabank Inverlat, S.A., Scotia Inverlat Casa de Bolsa, S.A. de C.V, Grupo Financiero Scotiabank Inverlat, and Scotia Inverlat Derivados, S.A. de C.V., are each authorized and regulated by the Mexican financial authorities.
Not all products and services are offered in all jurisdictions. Services described are available in jurisdictions where permitted by law.