Next Week's Risk Dashboard
- Was the surge in US core CPI an aberration?
- Shunto wage figures will be key for the BoJ
- Why the BoJ should tread very carefully
- PBOC will probably remain on hold
- ·US retail sales could rebound
- Wages will also be key in the UK, Mexico
- An end to China’s fake ‘deflation’?
- China’s credit surge may have been temporary
- Global macro
Chart of the Week
As Daylight Saving Time begins on Sunday for many of our clients, several debates in financial markets may also advance this week. Key developments to watch will include US CPI and how it may affect the Fed, the outcome of Japan’s Shunto round of Spring wage negotiations and a policy decision by the PBOC with some thinking they could cut. Top shelf macro reports will be released across all major regions.
US INFLATION—WAS JANUARY AN ABERRATION?
Was January’s surge just a flash in the pan? An aberration along a softening trend line? Tuesday’s core CPI reading for February will help to inform this debate. It’s the last CPI print before the March 20th FOMC statement plus the accompanying Summary of Economic Projections including a refreshed dot plot.
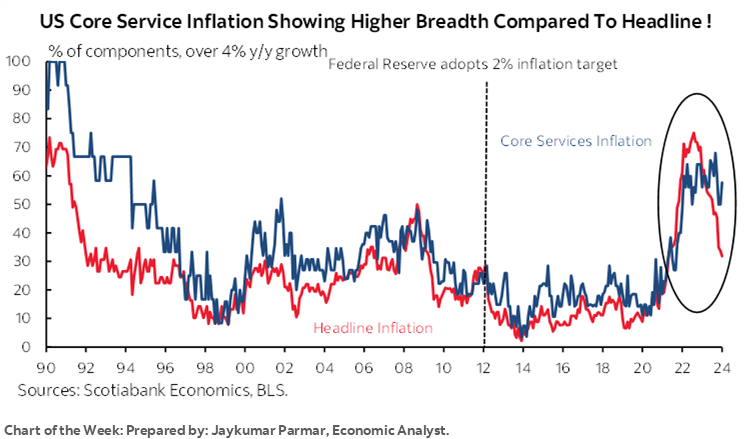
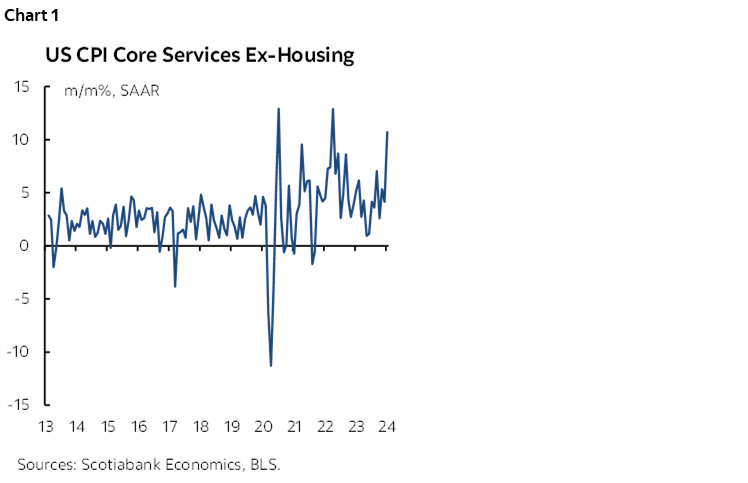
I’ve gone a little lower than consensus on this one with an estimated 0.3% m/m SA rise in headline CPI and 0.2% for core CPI ex-food and energy. There may be even downside risk to the core estimate. For one thing, I think the 0.85% m/m SA surge in core services inflation (ex-energy and housing) that was the hottest since April 2022 will be tough to repeat (chart 1). It’s entirely feasible that it crashes right back down.
Furthermore, based on industry guidance, each of the new vehicle and used vehicle price categories seem to have shaved about -0.1% m/m SA off of total CPI and a little more off of core CPI for combined drags of -0.2% or more. Gasoline could add about 0.1% m/m SA to headline CPI which is why I think that measure exceeds core.
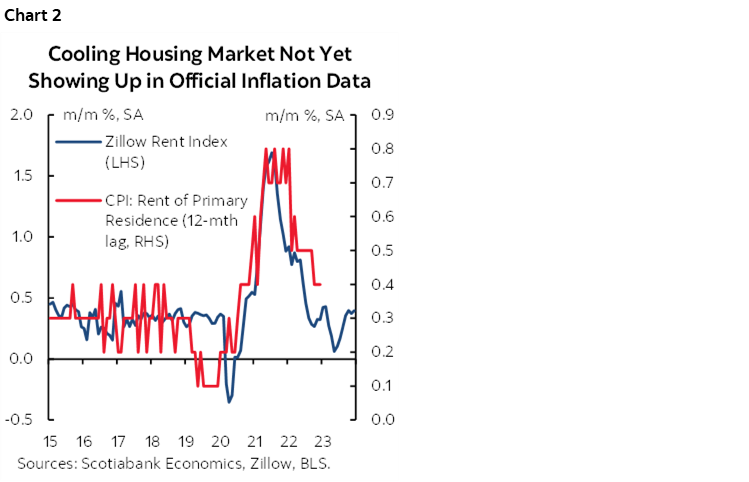
What’s also possible is that the prior month’s disinflation in core goods CPI (ex-food and energy) is a little warmer this time. At some point, however, the disinflation in market-based measures of rent is bound to begin showing up more fully in rent of primary residence and owners’ equivalent rent (chart 2).
JAPANESE WAGES AND THE BANK OF JAPAN
Wage growth is a key consideration facing the Bank of Japan as it ponders whether to raise its policy balance rate from -0.10% to zero or a small positive as soon as the March 18th–19th meeting. Such a move would end the period of negative rates that was introduced in early 2016. It would be highly symbolic and could be impactful to the economy and financial system.
That’s why this week will be so important to the Bank of Japan. Japan’s annual Spring Shunto wage negotiations will wrap up on Wednesday and the first estimate of the outcome arrives on Friday. An ESP Forecast survey of economists expects an average gain of 3.9%.
That would be below the demands set by Rengo—Japan’s largest trade union confederation—that initially set out to obtain a gain of “more than 5%” this year before guiding more recently that the average wage gain being sought by its member unions this year is 5.85%.
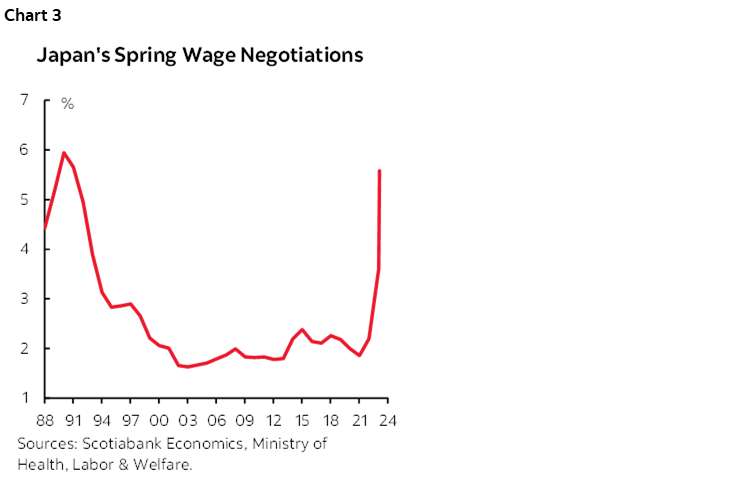
Still, after a wage gain of 3.6% last year, anything in the ballpark of what is either demanded or forecast to be agreed upon would be the strongest back-to-back gains since the early 1990s (chart 3). The Japanese government has put large corporations under pressure to raise wages and the thinking is that this could unleash a virtuous cycle of wage-price pressures that allows Japan to escape from the deflation that has plagued its economy since the popping of the stock market and property market bubbles over three decades ago.
But Japan—unlike, say, the Eurozone or Canada—sets wages one year at a time in collective bargaining exercises versus the multi-year approach in those other regions. A key question is therefore whether this kind of wage growth will persist next year and beyond.
Arguing in favour of the transitory argument is that such wage gains are not supported by productivity growth (chart 4). It’s unclear that this could turn out more favourably with a case in point being that Japanese machine tool orders are tumbling (-14% y/y). Total nonresidential investment has also been weak.
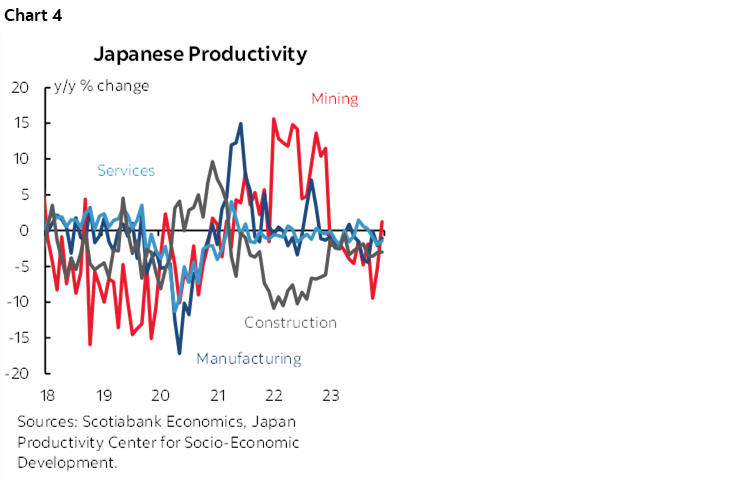
The chicken-and-egg challenge is that wage growth in excess of productivity gains can be inflationary and help the BoJ durably achieve its inflation goals, while simultaneously doubting the durability of such wage gains. At some point, shareholders would presumably pressure Boards to seek productivity gains and/or resist pressure from government and unions to pay more to workers lest their competitiveness deteriorate.
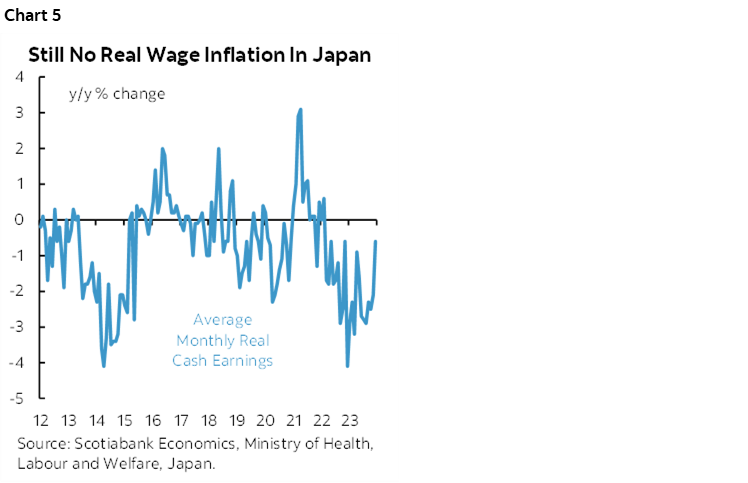
A further uncertainty is the pass-through effect; average real earnings are still falling in year-over-year terms with the Shunto wage setting exercise driving large corporations, but small businesses are weighing down average wages (chart 5).
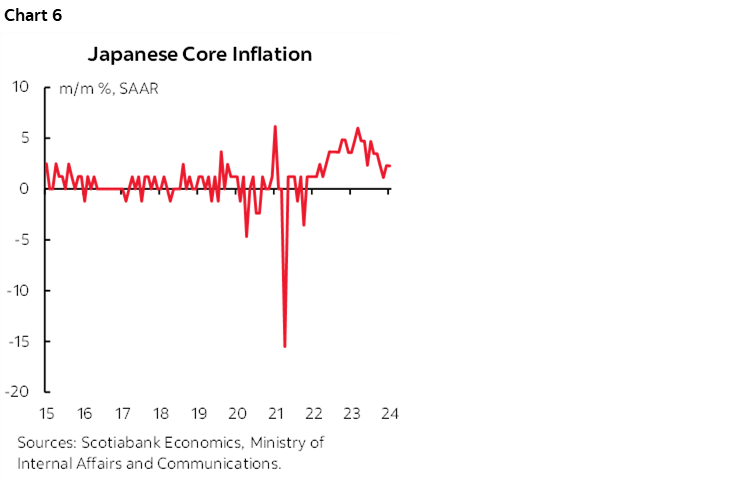
Added reasons for caution against ending negative rates could include that underlying inflationary pressure is already waning. Tokyo core CPI (ex-fresh food and energy) landed at 0.1% m/m SA in February. That was the softest reading since way back in April 2022. That continues the decelerating trend that has been in place since the peak last April (chart 6).
Furthermore, Japan’s economy is in technical recession, and there are also the potential perils of zigging (hiking) when the Fed is more likely to zag (cut) later this year.
Some argue that ending negative rates could be a relatively harmless one-and-done episode that would be more symbolic than substantive. The challenge here, however, is that markets are already pricing further rate hikes with a cumulative roughly 35bps move higher by year-end. How to manage markets that aren’t buying the one-and-done view is an added complication to BoJ communications that are typically shaky and difficult to decipher at best.
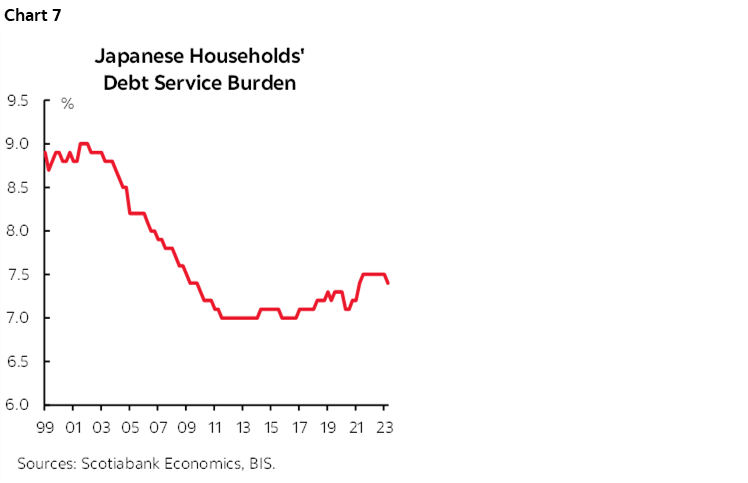
Managing this risk of a further unwanted tightening of financial conditions is very important to Japanese borrowers. About three quarters of Japanese mortgages are at variable rates. They have been used to very low borrowing costs but their debt service burden is already rising albeit from low levels (chart 7). That is partly due to the effects of stepping away from yield curve control that has contributed toward raising the 10-year JGB yield by about a full percentage point since the low point in 2019.
Tightened financial conditions could also manifest themselves in another way. Japan’s stock market has benefitted from strong foreign inflows. A lot of Japanese institutional investor money has been focused domestically. Both of these effects are partly attributable to FX hedging costs as the yen has sharply depreciated from about just over 100 to the USD in early 2021 to just under 150 today. Our forecast is for further yen appreciation toward 140 this year and 130 next year. Not being mindful toward the risks to FX hedging costs could drive a rebalancing of net investor flows out of Japan and prove to be destabilizing.
To be frank, however, these arguments are not resonating very strongly relative to others. When I was in Japan last week, there was dominant sentiment that now is the best opportunity that the BoJ will get to end the pernicious effects of negative rates and seize upon confidence building arguments that deflation is gone. The fear was this opportunity would slip away if and when the Fed begins to ease. Clearly that fear is being tamped down each time a Fed official speaks and favours later and less cutting. A nation’s mood and spirit may benefit from casting aside a policy deadweight that reminds everyone of the multi-decade challenge Japan has faced. Some continue to believe that entering negative rates was a mistaken experiment in the first place; this piece is one example of the literature over the years.
I hope proponents of a policy shift prove to be right because the consequences to being yet another false start and policy miscue by the BoJ could be devastating. It could have more of a negative effect than the weight on their shoulders of legacy policies.
PBoC—THE RISKS TO CUTTING OUTWEIGH CUT RISK
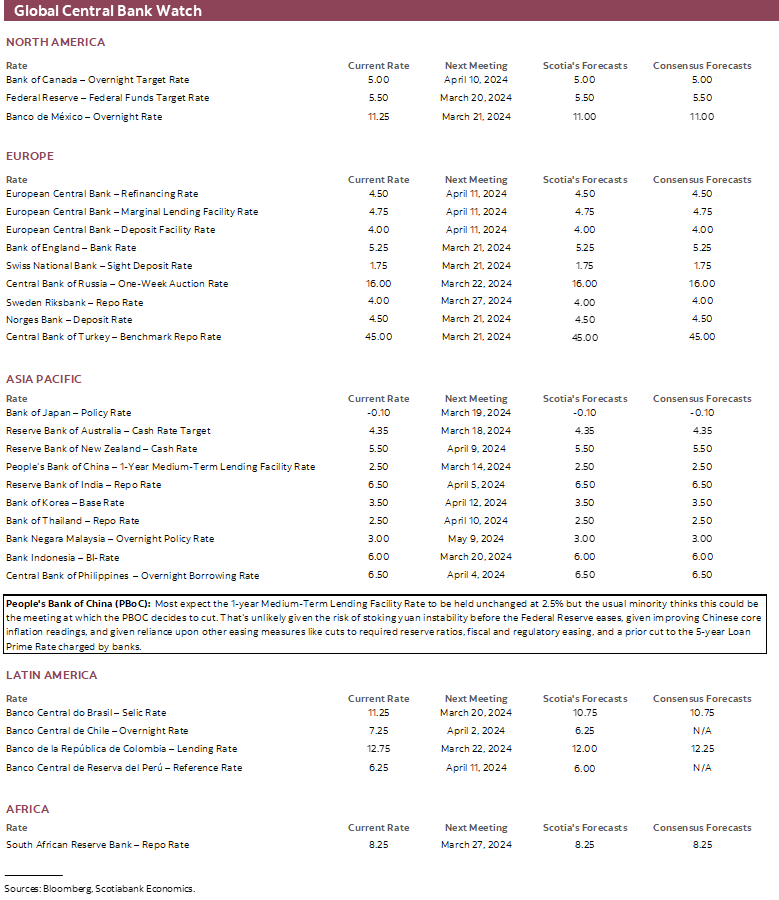
China’s central bank will be the only one to deliver a policy decision this week.
The People’s Bank of China is likely going to leave its 1-year Medium-Term Lending Facility Rate unchanged at 2.5% again. A minority of forecasters once again think it could cut, perhaps by 10bps. The case against doing so seems to be more dominant.
The yuan has depreciated by just over 1% to the dollar so far this year. Part of the reason is that market expectations for the Federal Reserve to begin easing monetary policy have been pushed out. For the PBOC to cut before the Fed is more clearly prepared to begin easing could stoke greater yuan instability. That’s key in the minds of Chinese policymakers particularly given memories of past periods of yuan instability and what it did to local markets and political stability.
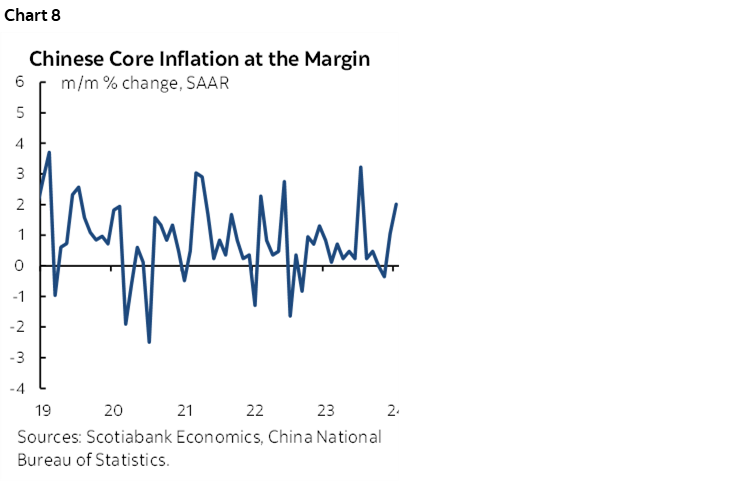
Further, Chinese inflation is probably on the mend (chart 8). It was never in deflation in terms of how economists define it as a broad, economy-wide reduction in prices that is expected to persist and that fundamentally alters behaviour including by postponing purchases. Just after completion of this publication, China is expected to report that the year-over-year rate of CPI inflation will return to positive territory in February, thus potentially ending the casual definition of deflation that some have promoted.
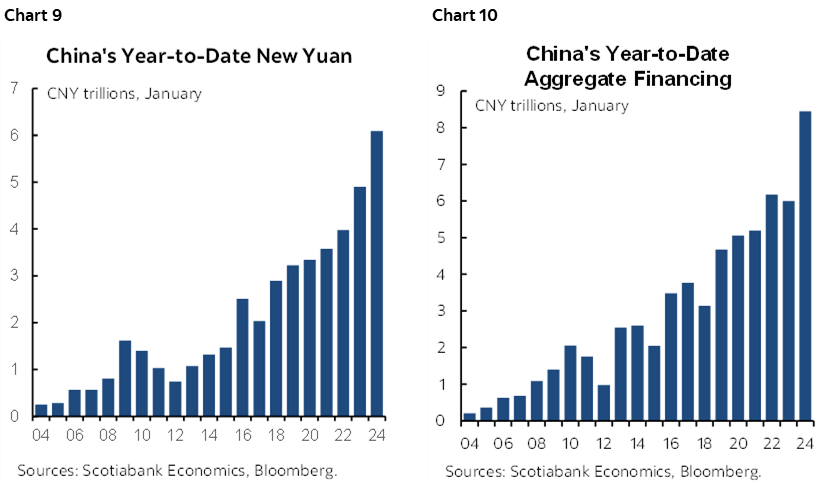
China is instead choosing to rely upon other forms of easing without stoking external imbalances. It has been cutting required reserve ratios on the hope that freeing up bank capital will stoke more lending. So far that has propelled domestic currency loans and total financing to the strongest start to the year on record (charts 9, 10). China has also applied targeted easing through limited fiscal and regulatory efforts. It has applied pressure upon the banks to reduce lending margins particularly on property financing as recently indicated by a cut to the key 5-year Loan Prime Rate that guides housing finance.
GLOBAL MACRO—US RETAIL SALES MAY REBOUND
While US CPI, developments in Japan and the PBOC’s decision may dominate, there are several global economic indicators that could also be impactful.
United States—It’s Not Just About CPI
Most of the attention will be upon US CPI but there will be other readings of interest over the week. All of them will appear on Thursday and Friday.
- Retail sales (Thursday): February’s print is expected to post a gain of close to 1% m/m which would be a strong rebound from the -0.8% prior decline. We already know that higher auto sales will play a role, but a rebound is also expected in core retail sales.
- Producer prices (Thursday): Pipeline inflation—potentially waiting to pass through to consumers—was on a generally subdued path from several months until core producer prices ex-food and energy jumped higher by 0.5% m/m SA. February’s reading is expected to be more moderate.
- Industrial data (Friday): Industrial output is expected to be little changed when February’s reading is released. Also watch the NY Fed’s Empire gauge of manufacturing activity that kicks off the monthly parade to the next ISM-manufacturing report.
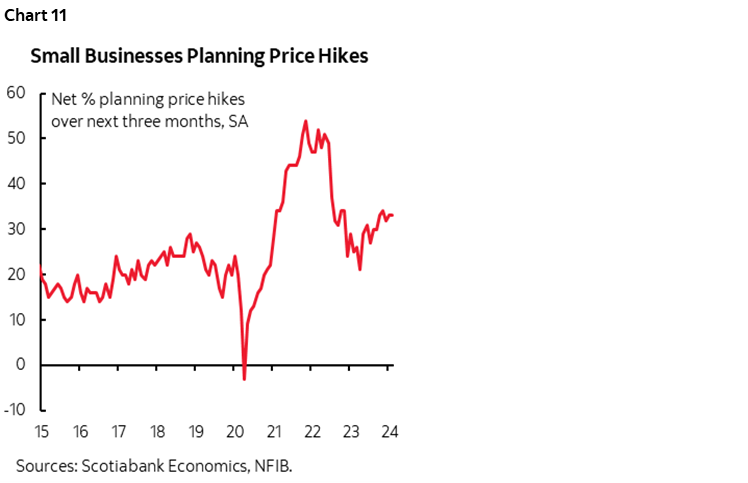
Other readings to watch in the US will include the NFIB’s small business sentiment gauge and details on hiring intentions and pricing plans that have been back on a mild upswing (chart 11). Weekly jobless claims (Thursday) and the University of Michigan’s consumer sentiment survey for March (Friday) round out the releases.
LatAm—Mexican Wages, Peru’s Recession
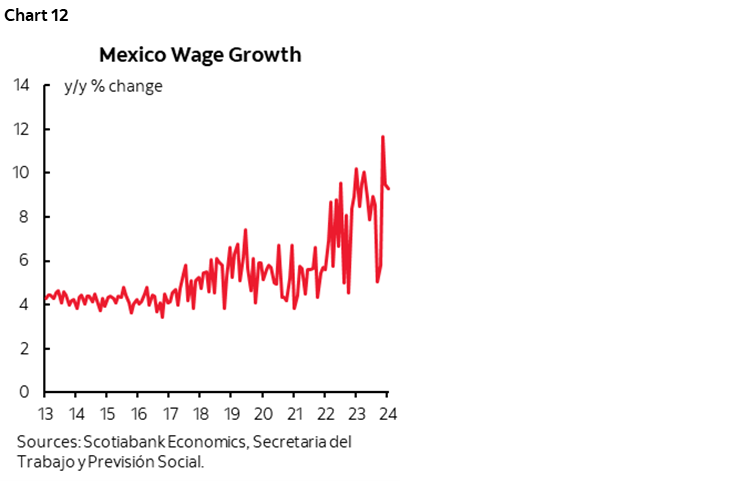
Two developments in Latin American markets will be closely watched. One is Mexican wage growth when fresh figures for February land at some point this week. Wage growth has been running at over 9% y/y with private employers leading the gain (10%) while public employees are lagging (4%). As chart 12 shows, the volatile pattern has been the fastest wage growth since the early 2000s. It’s a key consideration in evaluating Banxico’s scope for easing.
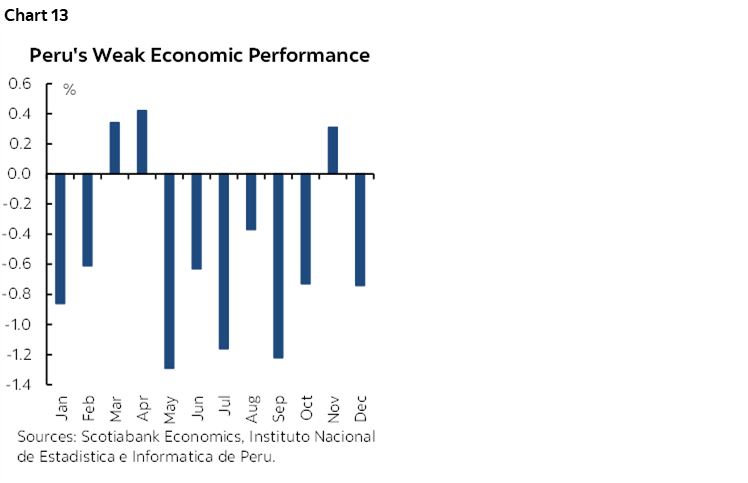
Second will be Peru’s economic activity index for January (Friday). It has been signalling contraction since last May and is closely correlated with GDP growth (chart 13). Stabilization in this reading could inform consensus expectations for a return to year-over-year GDP growth in Q1 after four quarterly contractions.
Canada—Mixed Minor Data
Canada will go relatively quiet after an active prior week. Minor updates are in store. Thursday’s manufacturing report for January was previously guided to post a 0.4% m/m rise in shipments in StatCan’s flash on February 26th. Friday’s wholesale trade was guided to drop by -0.6% m/m back on that same day. Friday’s housing starts are likely to slip if the moderation in permits for new dwellings is any guide. We might also see weaker existing home sales in February’s report given what we already know about some of the cities, but it’s probably best treated as a soft patch between the strong gains in December and January and the peak Spring housing market over April through to June.
Asia-Pacific—Can Chinese Credit Growth be Sustained?
China is expected to update financing figures for February at some point over the coming week. They will follow the hottest month of January on record as referenced earlier. That may have been partly due to credit easing measures such as reductions to the required reserve ratios faced by Chinese banks. It may have also been driven by demand ahead of the Lunar New Year on February 10th. Expect softening.
India updates CPI on Tuesday. Core inflation may ease further from the 3.6% y/y reading in January. That would bring it further below the 4% headline inflation target as the midpoint of the RBI’s 2–6% inflation target range.
Europe—UK Wages and the BoE
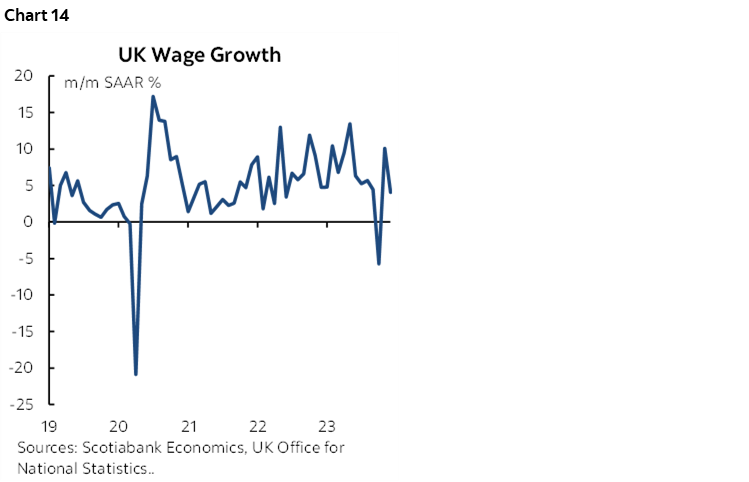
The UK will deliver its monthly data dump starting on Tuesday with employment figures for January, jobless claims, payrolls and wages for February. Wages could impact inflation risk and pricing for the Bank of England’s Bank Rate (chart 14). Wednesday brings out January updates for UK GDP, industrial production, services, construction activity and international trade. CPI updates will be offered by Norway (Monday) and Sweden (Thursday).

DISCLAIMER
This report has been prepared by Scotiabank Economics as a resource for the clients of Scotiabank. Opinions, estimates and projections contained herein are our own as of the date hereof and are subject to change without notice. The information and opinions contained herein have been compiled or arrived at from sources believed reliable but no representation or warranty, express or implied, is made as to their accuracy or completeness. Neither Scotiabank nor any of its officers, directors, partners, employees or affiliates accepts any liability whatsoever for any direct or consequential loss arising from any use of this report or its contents.
These reports are provided to you for informational purposes only. This report is not, and is not constructed as, an offer to sell or solicitation of any offer to buy any financial instrument, nor shall this report be construed as an opinion as to whether you should enter into any swap or trading strategy involving a swap or any other transaction. The information contained in this report is not intended to be, and does not constitute, a recommendation of a swap or trading strategy involving a swap within the meaning of U.S. Commodity Futures Trading Commission Regulation 23.434 and Appendix A thereto. This material is not intended to be individually tailored to your needs or characteristics and should not be viewed as a “call to action” or suggestion that you enter into a swap or trading strategy involving a swap or any other transaction. Scotiabank may engage in transactions in a manner inconsistent with the views discussed this report and may have positions, or be in the process of acquiring or disposing of positions, referred to in this report.
Scotiabank, its affiliates and any of their respective officers, directors and employees may from time to time take positions in currencies, act as managers, co-managers or underwriters of a public offering or act as principals or agents, deal in, own or act as market makers or advisors, brokers or commercial and/or investment bankers in relation to securities or related derivatives. As a result of these actions, Scotiabank may receive remuneration. All Scotiabank products and services are subject to the terms of applicable agreements and local regulations. Officers, directors and employees of Scotiabank and its affiliates may serve as directors of corporations.
Any securities discussed in this report may not be suitable for all investors. Scotiabank recommends that investors independently evaluate any issuer and security discussed in this report, and consult with any advisors they deem necessary prior to making any investment.
This report and all information, opinions and conclusions contained in it are protected by copyright. This information may not be reproduced without the prior express written consent of Scotiabank.
™ Trademark of The Bank of Nova Scotia. Used under license, where applicable.
Scotiabank, together with “Global Banking and Markets”, is a marketing name for the global corporate and investment banking and capital markets businesses of The Bank of Nova Scotia and certain of its affiliates in the countries where they operate, including; Scotiabank Europe plc; Scotiabank (Ireland) Designated Activity Company; Scotiabank Inverlat S.A., Institución de Banca Múltiple, Grupo Financiero Scotiabank Inverlat, Scotia Inverlat Casa de Bolsa, S.A. de C.V., Grupo Financiero Scotiabank Inverlat, Scotia Inverlat Derivados S.A. de C.V. – all members of the Scotiabank group and authorized users of the Scotiabank mark. The Bank of Nova Scotia is incorporated in Canada with limited liability and is authorised and regulated by the Office of the Superintendent of Financial Institutions Canada. The Bank of Nova Scotia is authorized by the UK Prudential Regulation Authority and is subject to regulation by the UK Financial Conduct Authority and limited regulation by the UK Prudential Regulation Authority. Details about the extent of The Bank of Nova Scotia's regulation by the UK Prudential Regulation Authority are available from us on request. Scotiabank Europe plc is authorized by the UK Prudential Regulation Authority and regulated by the UK Financial Conduct Authority and the UK Prudential Regulation Authority.
Scotiabank Inverlat, S.A., Scotia Inverlat Casa de Bolsa, S.A. de C.V, Grupo Financiero Scotiabank Inverlat, and Scotia Inverlat Derivados, S.A. de C.V., are each authorized and regulated by the Mexican financial authorities.
Not all products and services are offered in all jurisdictions. Services described are available in jurisdictions where permitted by law.