Next Week's Risk Dashboard
- Stocks might understand resilience better than rates
- FOMC: More pressure on QT plans than rates
- The US is not immune to soaring shipping costs
- Canada’s economy might have ended 2023 on a better note
- Why Canada’s economy is stronger under the hood
- US job markets remain on sound foundations
- BoE: No rush just yet amid warning signs
- Will Eurozone core CPI deliver another warning?
- BanRep: -25 or -50?
- BCCh to deliver another big cut
- Brazil’s predictable central bank
- Riksbank to extend hold
- Chinese stimulus may portend soft PMIs
- Australian core CPI to inform RBA’s bias
- A big week for earnings
- GDP: Eurozone, Mexico
Chart of the Week
While there are real risks and uncertainties going forward alongside significant regional variations, it may well be that stocks continue to be closer to getting the macro backdrop correct than many other pundits.
The S&P 500 has continued to push toward all-time highs. Toronto’s TSX isn’t far behind the all-time high hit in early 2022. Ditto for the FTSE100 that isn’t far behind the peak set early last year. Germany’s DAX is at a record, and so is France’s CAC40. Not everyone is in the same boat, but it’s hard not to believe that a lot of bad news is already baked into Chinese stocks with the Hang Seng at 5.4 times trailing earnings and 7.6 times forward with Shanghai under 10 on both measures.
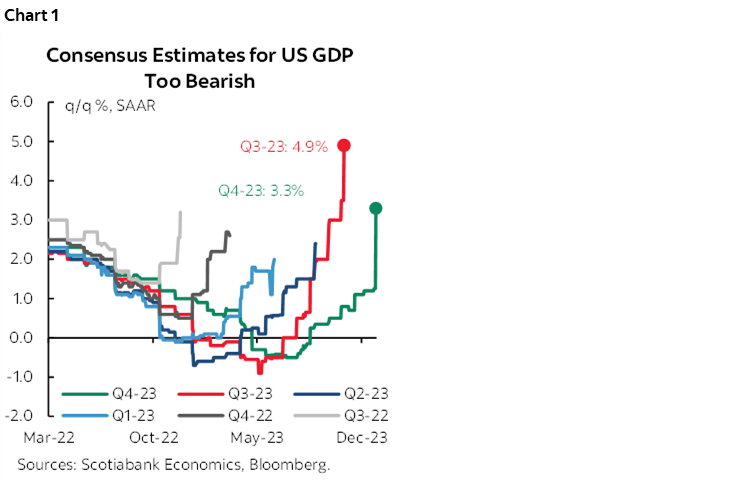
Stocks are counting on rate cuts that are still being aggressively priced, though considerably less so than toward the end of last year. Nevertheless, stock resilience can be contrasted to extreme bearishness that has been trapped in a cycle of pushing out expectations for a tumbling US economy for six consecutive quarters during which consensus has come in very negative and shamed upon exiting (chart 1).
This resilience may be confirming the theory that the US economy is more rate resilient—and hence better able to keep the world economy together—than in past cycles. The US consumer remains key. Household finances are in vastly better shape with a twenty-three year low in the debt-to-income ratio, record low debt payments as a share of incomes, record low weighted average effective cost of mortgage debt, still very high cash and near-cash balances and all backed by strong job markets. Fiscal policy is vastly different than, say, coming out of the GFC. Inventories are generally in better shape particularly in sectors like autos and housing.
Early signs suggest that 2024Q1 could be a repeat. The New York Fed’s nowcast estimate stands at 2.8%. The Atlanta Fed’s preliminary ‘nowcast’ for Q1 GDP growth is calling for 3%. The consumer is shaping up to be key again. Momentum math is baking in 2.1% consumption growth in Q1 before we even get any Q1 data; even very mild monthly gains could almost double that tracking.
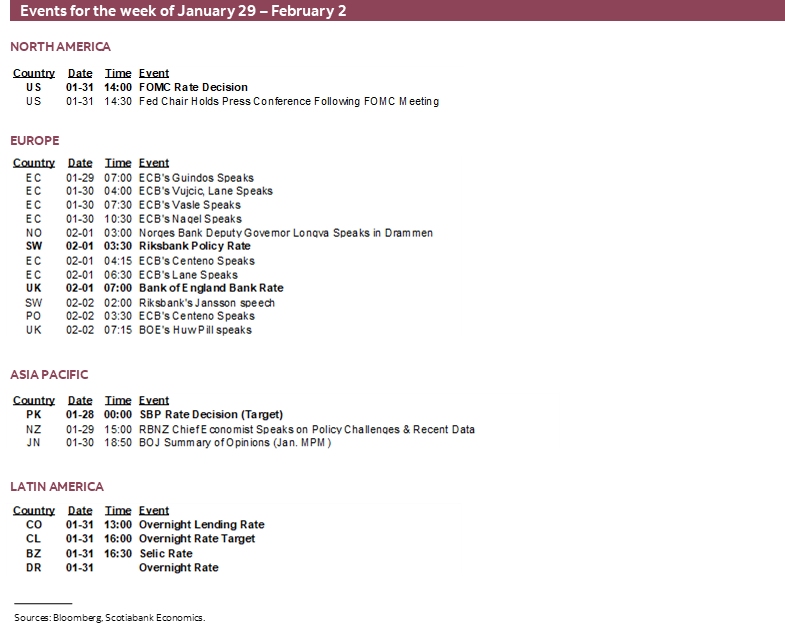
In other words, it’s not that bad out there despite the constant barrage of negativity. This perspective may dominate the Federal Reserve’s meeting this week as it mulls over whether to change rate guidance and debates QT parameters. The catch-22 is that expectations for a sudden dovish tilt may be rather premature; the cost to resilience may be slower, later, and smaller rate cuts. The Bank of England, Riksbank, and several LatAm central banks will be offering their own fresh perspectives but with none moving quite as rapidly as the LatAm set, perhaps because they hiked more than others.
The same argument even applies to Canada where there is a danger that negative nellies are distorting impressions of the economy and talking it toward a problem. As argued below, the economy is in considerably better shape than GDP indicates.
Apart from top central banks, the coming week will also bring out a wave of first tier macro reports from across the global economy and a very heavy line-up of earnings.
Suffice it to say that if you’re bored by developments with nothing to do over the coming week, then that’s a you issue.
FOMC—THE QT PRESSURE IS ON
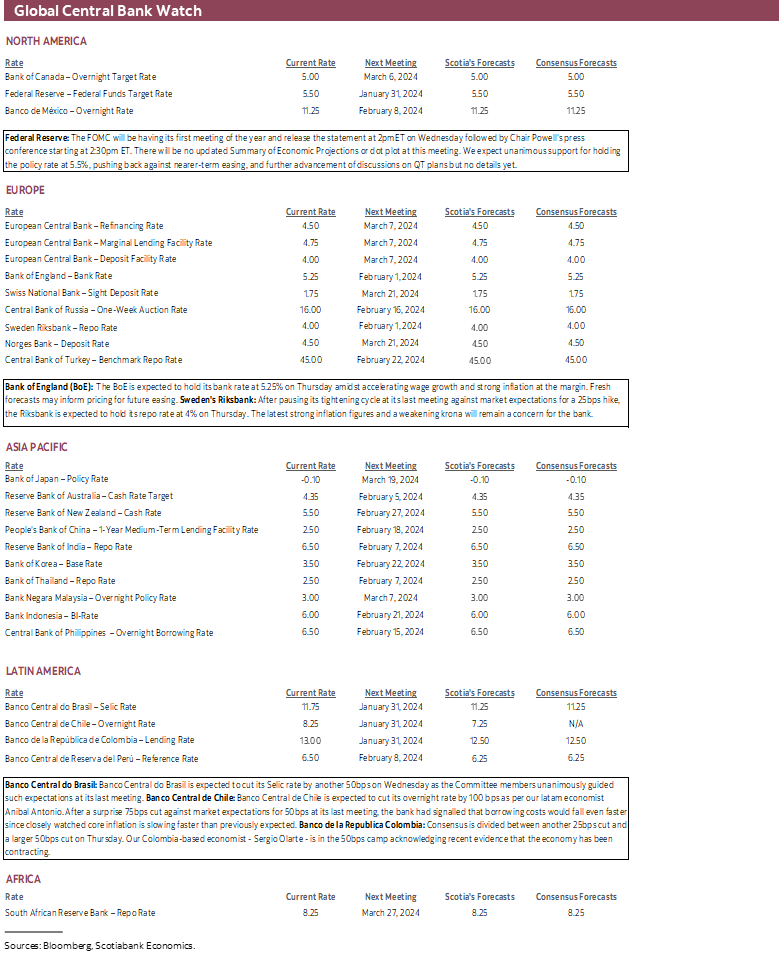
The Federal Reserve’s latest policy stance will be unveiled on Wednesday when the FOMC statement arrives at 2pmET followed by Chair Powell’s press conference at 2:30pmET. They updated the Summary of Economic Projections including the ‘dot plot’ at the December meeting (recap here) and the next forecast update will come in March. Forward guidance and any discussion on QT changes will be the things to watch.
Statement Changes—Still Going Strong
Statement changes are likely to be minimal. The opening sentence probably needs adjusting. It’s technically correct to say growth “slowed from its strong pace in the third quarter” but the upside surprise at 3½% (4.9% prior) is still very strong. Perhaps they’ll simply reference ongoing strength in the US economy.
Forward Guidance—‘Any’ Changes?
Forward guidance is likely to retain reference to “any additional policy firming that may be appropriate” will be determined by data and developments. This was watered down in the December statement through by the insertion of ‘any.’
If this sentence is struck out entirely then it may signal greater openness toward nearer term easing, but I doubt it, and only if they don’t pull the same stunt that the BoC pulled. Recall that the BoC removed something similar from its statement only to retain hike risk in the Governor’s opening remarks to his press conference and in comments throughout in what turned out to be somewhat of a confusing shell game.
Little change is expected compared to the December press conference in terms of rate guidance when Chair Powell said that “we are likely at or near the peak” on rates and “participants didn’t put down additional hikes but didn’t want to take the possibility off the table” in reference to the slight wording changes in the statement that added the aforementioned word ‘any’.
A more definitive possibility on top of the potential for a statement wording change would be for Powell to expressly state that the Committee has more confidence that they are at a rate peak. I find that difficult to imagine. Developments since the December FOMC have given rise to strong GDP growth (here) that has blown away the bears for about six consecutive quarters now, strong gains in consumer confidence, ongoing strength in payrolls and faster wage growth (here), firm inflation and intensified risk to global supply chains that is materially impacting both global and US shipping costs (charts 2, 3). If they wanted to retain the option to hike again in December, they’d have to have a very good reason for entirely giving up that option now in the wake of these developments. Again, the BoC is a good example of not doing it until you are convinced it’s the right thing to do and able to do it clearly, given their botched effort at doing so.

We expect the Chair to lean against nearer term easing, and to emphasize a measured and careful pace of possible future easing of a magnitude indicated by the December SEP (-75bps this year). The next updated dot plot in March will afford future opportunity to adjust this guidance if desired at the time and in relation to current market pricing for 125–150bps of rate cuts over the duration of this year.
QT—More Info Now, or Check Back in Three Weeks?
I have not been alone in arguing for a long while now that the Federal Reserve would likely have to reduce its Quantitative Tightening plans earlier than it had been guiding by way of implicitly signalling it was on autopilot for years to come. Discussions with market participants including bank Treasuries on this topic have been ongoing for a couple of years now. As the Fed rolled back support to the bond market, the widespread feeling was that the day would come when underestimated frailties would be exposed across a disparate array of funding franchises across the US financial system. The regional banking crisis last Spring was a good example of this, aided by widespread ineptness among the affected regional banks. Those frailties would force the Fed’s hand toward pulling back on QT plans by this year.
Further discussion on adjusting Quantitative Tightening parameters and addressing pressures in funding markets is likely at this meeting, but it’s unclear how much may be revealed at this point. No announcement or concrete plans are expected. The most likely scenario could be for the Chair to indicate that there was further discussion at this meeting, that no decisions have been reached, and watch the minutes three weeks hence. He could entirely defer by saying this will be a topic for fuller discussion at a later meeting.
The issue driving the need for a discussion fairly soon is the speed at which Quantitative Tightening is depleting bank reserves and liquidity at money market funds. When the Fed was engaged in Quantitative Easing and liquidity management, the aim was to buy reasonably safe assets—primarily Treasuries and Mortgage-Backed Securities—and inject cash into the market on reasonably favourable terms. The result drove higher bank reserves held at the Fed and higher repo facility balances held by money market funds. The hope was that injecting this liquidity would give these groups more cash to buy other securities and to lend, and therefore add to the effects of rate cuts in lowering borrowing costs while stoking economic growth and countering disinflationary pressures.
As the economy strengthened and inflation rose, Quantitative Tightening sought to reverse this chain of effects as a complementary form of policy tightening to the primary tool of raising the fed funds target range. It entailed allowing the Fed’s holdings of securities to drop off the balance sheet as the amounts matured at a controlled pace of US$60 billion per month for Treasuries and $35 billion per month for MBS, although they tend not to be able to run off MBS holdings at this pace. As issuance replaces the retired securities, banks have to deplete their reserves to fund their securities holdings and money market funds have to run down RRP balances. The effects are to provide less money to lend, less money to invest in securities holdings, and hence less stimulus to growth and inflation.
The problem is that nobody wants this process to go too far. If banks’ reserves and money market funds’ RRP balances are depleted too rapidly and sink too low, then it could trigger problems in funding markets. It could result in forced selling of securities holdings and excessive damage to lending channels while scarce liquidity puts upward pressure upon repo rates and broader funding costs. This is what happened in late 2019 and the Fed has since adopted a more liberal ‘ample’ reserves framework.
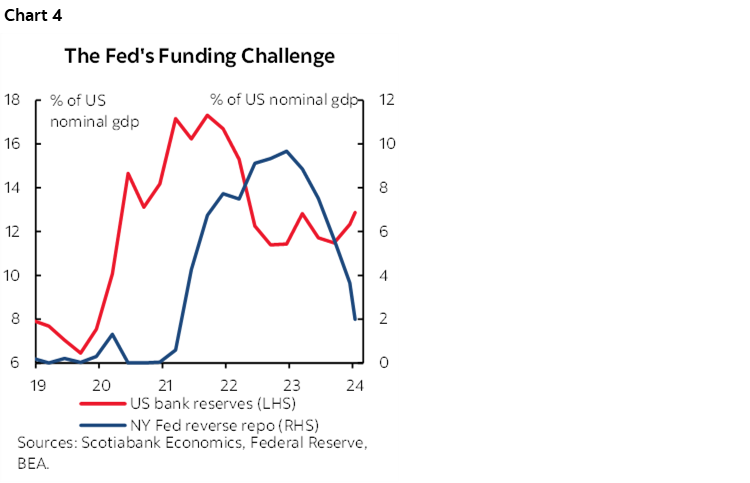
That ample reserves framework is now being tested (chart 4). Reserves are at about 12% of NGDP when the Fed has indicated 10–12% is their target range. That indicates reserves are still ample, but getting closer to the target range that would require slowing the pace of QT runoff. RRP balances are rapidly falling. Most forecasters expect that reserves and RRP balances could become too tight by Spring and so the Fed would want to head off a funding market challenge beforehand.
The FOMC may have pried the door open to addressing QT parameters at the December meeting when the minutes simply stated the obvious point that “it would be appropriate for the Committee to being to discuss the technical factors that would guide a decision to slow the pace of runoff well before such a decision was reached.”
Our base case assumption is that an announcement on tapering QT flows could come as early as the March meeting with implementation by—or before—May and that QT will be set along a path to be shut down within one year thereafter. The Committee is likely to adopt a meeting-by-meeting approach to the issue of pace, saying that they will remain flexible and nimble as opposed to expressing the certainty that would be required to pre-commit to something like going cold turkey with an abrupt end to QT or guiding an explicit path forward.
CANADA’S ECONOMY—BE CAREFUL ABOUT WHAT YOU TALK US INTO!!
If Canada’s economy tanks this year, then I for one will point one finger at the folks who have been doing their best to overstate economic weakness and who risk talking us into a recession.
There is no doubt that Canada’s economy is treading water, but it is not quite as weak as GDP suggests. It is not as weak as the BoC has portrayed. It is not as weak as business leaders have indicated.
Fresh updates will arrive on Wednesday when Statcan publishes November and December GDP estimates that will further inform our tracking for Q4 overall. I’ll go over the estimates first and then the reasons why GDP overstates weakness.
The Estimates—December to Rebound
Q4 GDP could be tracking about ½% q/q SAAR growth using the monthly production-side GDP accounts. Statcan had guided on December 22nd that November GDP was tracking about +0.1% m/m whereas I’ve estimated no growth with possible downside risk. Key is that November hours worked fell 0.7% m/m and so for GDP to be flat to slightly higher relies heavily upon Statcan guidance that manufacturing, transportation and warehousing and several primary sectors lifted the economy.
December is looking stronger. A rebound in hours worked and light activity readings suggest that decent growth could have occurred. Advance guidance for December nominal retail sales was +0.8% m/m which likely implies a small volume gain that could translate into a higher value-added contribution to GDP. Housing starts surged ahead by 18% m/m SA and should lift construction sector activity. Advance guidance for manufacturing sales points to softness, but this is offset by advance guidance for wholesale sales. Existing home sales were up by 8.7% m/m SA for the biggest gain since April which should lift ancillary professional services (real estate agents, lawyers, bankers etc). Vehicle sales were strong and continue to rise (here).
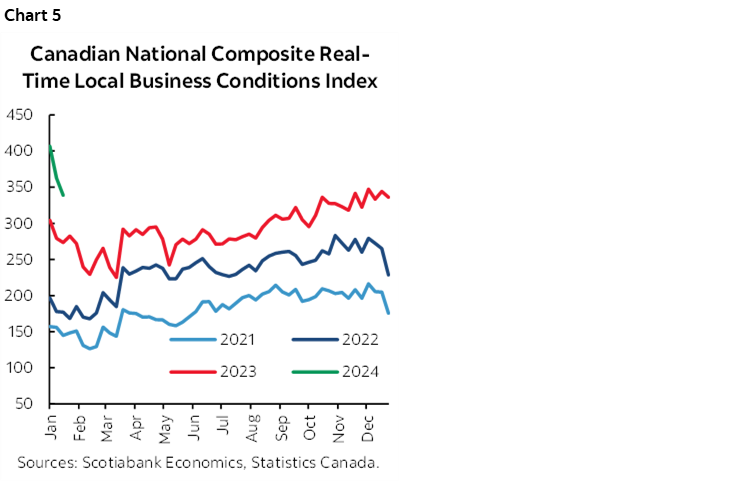
December GDP could also come down to services activity which is more difficult to track. A strong surge in Statcan’s real-time local business conditions index indicates robust activity (chart 5). This alt-data reading draws heavily upon mobility data. The chart shows a pick-up in 2023 that carried through to year-end and more powerfully than levels from prior years and more powerfully than the year ended in those prior years. 2024 is off to a much stronger start than any other pandemic-era year so far. It’s reasonable to assume that with so many folks moving about, many of them were spending money at restaurants, bars, hotels, on flights, at sporting events, movie theaters and concerts.
The BoC’s fresh forecast expects Q4 GDP growth to be 0% using the expenditure-based accounts that also include effects like inventory and trade swings.
Final Domestic Demand—The Better Measure
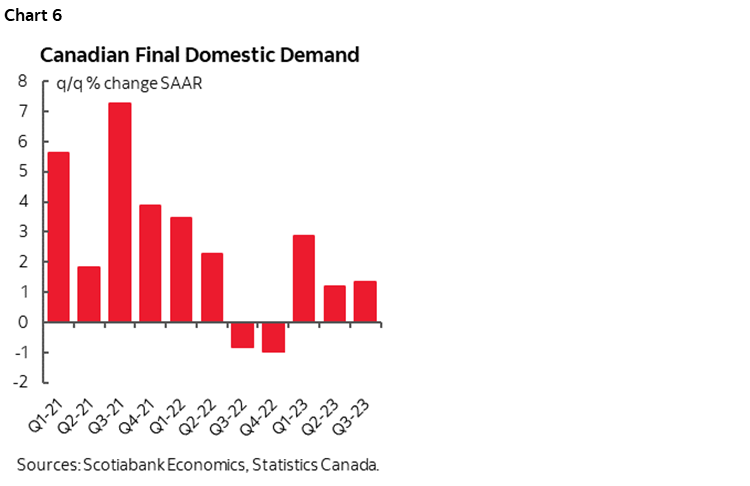
One reason for why the economy has not been as weak during 2023 as GDP suggests is because final domestic demand (FDD) has continued to grow. FDD is a better gauge of underlying momentum in the economy because it tracks consumption plus investment plus government spending and therefore excludes volatile effects from inventories and net exports. FDD was up by 2.9% q/q SAAR in Q1, 1.2% in Q2 and 1.3% in Q3 (chart 6). It probably grew by at least that amount in Q4, thus extending its outperformance relative to GDP.
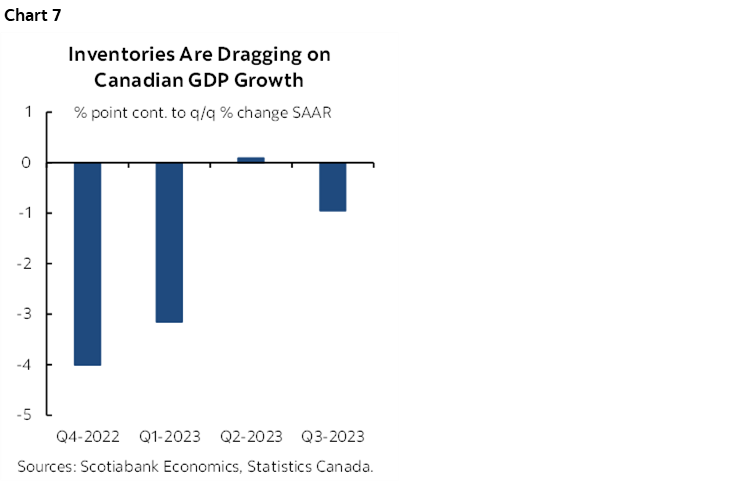
GDP has been especially weighed down by inventory changes that knocked a whopping 4.0 percentage points off of 2022Q4 growth, knocked another weighted 3.1 ppts off of 2023Q1 growth that turned to no role in Q2, and then knocked another full percentage point off of GDP growth in Q3 (chart 7). It’s hard to view inventory disinvestment as a negative at this point in the cycle, but the more growth bearish folks who only look at GDP are implicitly doing so. I think it’s constructive to see businesses carefully manage inventories that are expensive to store and finance, and some of this is because of ongoing supply chain volatility.
Serial Shocks Can’t Be Ignored
Another reason for why the economy is not as weak as GDP suggests is because of serial shocks to the economy that weigh down GDP but don’t necessarily reflect as much weakness under the hood.
Over the summertime, much of the story was about wildfires and lost hours due to crippling strikes. Into the Fall, the weakness extended with a shutdown of a major auto assembly plant in Ontario for retooling and the cross-border effects of the UAW strike. There have also been serial hits to petrochemicals production including unplanned maintenance and problems with some oil sands upgraders. The St. Lawrence Seaway strike hit multiple sectors of the economy.
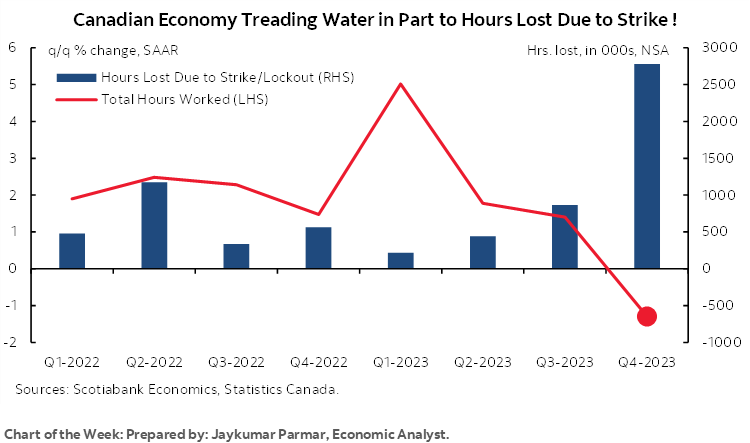
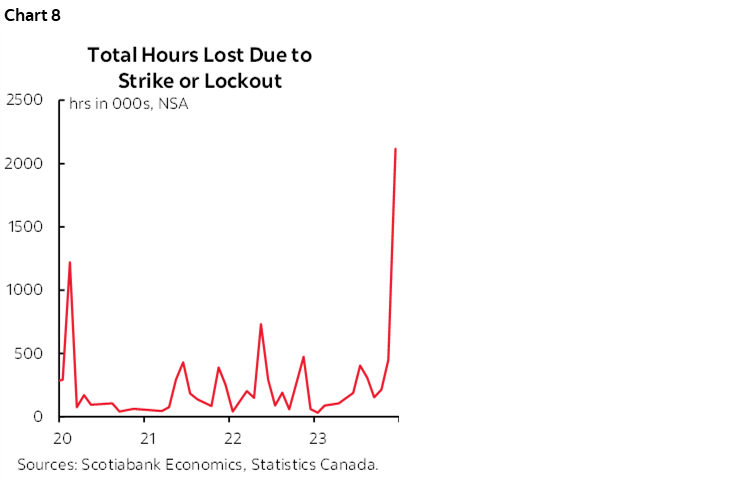
Chart 8 is one way of vividly portraying these effects. Canada is losing more hours worked due to strikes than it did due to crippling pandemic lockdowns. That’s just stunning to me. Folks standing on picket lines are not producing goods and services and so they are denting GDP growth, but eventually they return to work either thrilled or disappointed by what they got in the end and more likely the former given the pattern of wage settlements being secured.
Excess Negativity
I find it unusual that the BoC plays up weakness in GDP without referencing final domestic demand and factors like inventories. Also unusual is that the BoC used to include technical boxes in its MPRs that sought to quantify the impacts of shocks and they seem to have abandoned that practice under Macklem’s regime. Why? This raises suspicion that the BoC is trying to overstate weakness in the economy in order to fist-pump the efficacy of monetary policy in dampening growth and convince Canadians that tighter monetary policy is working. It is to a certain extent, but they should be careful what they ask for if such practices cause a bigger problem by excessively harming confidence in the outlook.
The same concern applies to folks who are forcing their arguments in favour of rate cuts. I get that borrowers and lenders want rate cuts, while savers are in no rush. I also get that forcing their arguments by sounding so awfully negative on the economy without taking into account the arguments that are offered above risks destroying confidence and banging up the economy.
US JOB MARKETS—JOBS AND WAGES STOPPED BEING PAID FOR BY PRODUCTIVITY GAINS
The week’s gradual releases of labour market readings will build to a crescendo when nonfarm payrolls, wages and the unemployment rate are released for the month of January on Friday. If expectations pan out, then the latest readings could indicate resilient job growth, ongoing wage gains, and manageable growth in productivity-adjusted labour costs. Unit labour costs will bounce higher from the prior quarter’s decline, but not explosively so and that could continue to indicate only modest inflationary pressure derived from the labour market.
I’ve estimated payrolls to rise by 220k with wage growth posting another 0.4% m/m SA gain and a stable unemployment rate at 3.7%. The latter is derived from the companion household survey that is expected to roughly equilibrate reversals of the large drops in employment and the size of the labour force of over 600k each in December by contrast to strength in nonfarm payrolls that were up 216k.
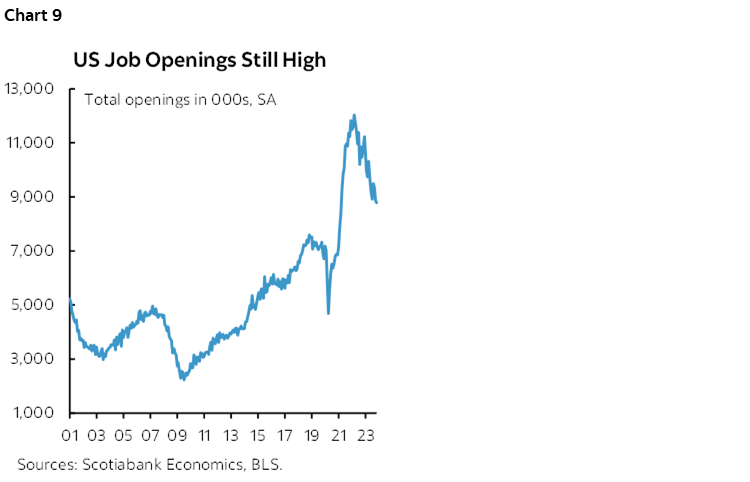
The US job market appears to be strong. Weekly initial jobless benefit claims were little changed between the December and January nonfarm reference periods and are still averaging in the low-200k range. Layoffs have remained low, with January’s update due on Thursday before payrolls. JOLTS job vacancies are falling but remain above pre-pandemic levels amid uncertainty toward how many are ‘live’ postings with a true intention to fill (chart 9). ADP payrolls get updated for January on Wednesday, but never hang a nonfarm call on ADP unless it’s an extreme outlier in either direction and even that’s not assured.
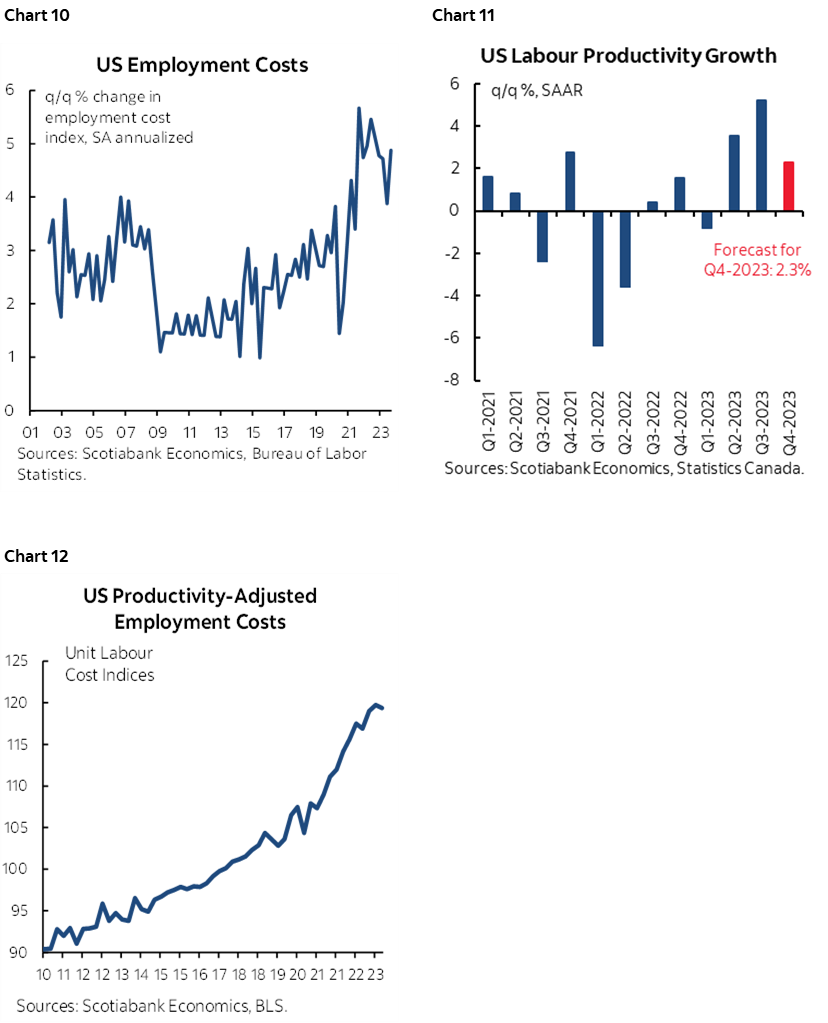
What could be more important than payrolls, however, are measures of employment costs relative to how productivity growth may be paying for them. The Employment Cost Index is expected to post another rise of 1%+ q/q SAAR that would extend a string of strong gains (chart 10). Productivity growth is expected to slow sharply but still put in a decent performance in the 2% to 2½% q/q SAAR range given that GDP surprised higher at 3.3% and nonfarm business output was up by 3.7% (chart 11). The combined effect could drive a renewed pick-up in unit labour costs to grow by over 2% q/q SAAR after a temporary drop in Q3 (chart 12).
BANK OF ENGLAND—NO RUSH JUST YET
The Fed may dominate the week’s central bank calendar, but the Bank of England is no slouch either. It weighs in on Thursday and while no policy changes are expected, the guidance it provides could be key.
Markets are fully pricing the first rate cut to occur by the June 20th meeting and with about half of a cut priced for the May 9th meeting. Watch the break down of votes on the MPC for an indication of whether the holdouts are giving up on the possible need for additional tightening; most expect a weakened minority in favour of hiking. A full forecast update will be provided at this meeting. Inflation and wage growth have recently come in softer than the BoE expected by now, but pipeline pressures are still ahead in wage setting exercises, spiking shipping costs and expected fiscal stimulus in the March 6th Budget.
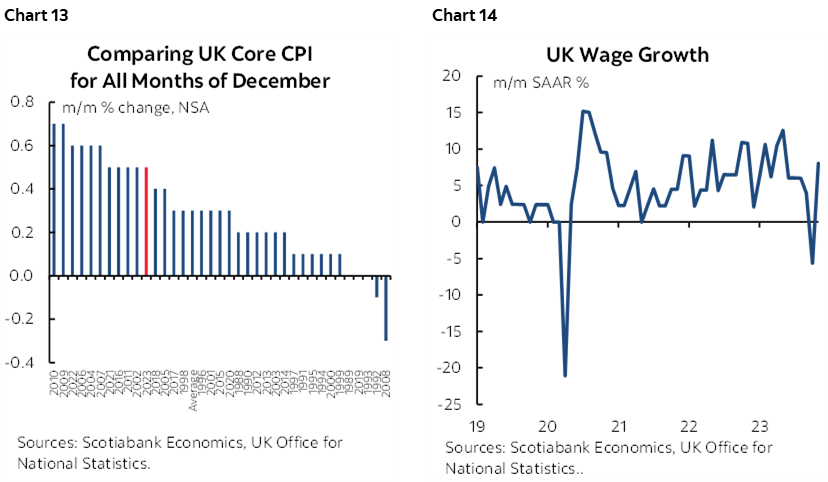
In all, expect no rush to ease, but signals that the BoE is setting along this path as it buys time to further assess conditions into Spring. Recent core CPI (chart 13) and wage growth (chart 14) indicate that the path toward persistently disinflationary pressures is likely to be a bumpy one at best.
BANREP—25 OR 50?
After commencing an easing cycle with a 25bps cut in December, Colombia’s central bank faces an evenly consensus that is divided between another 25bps reduction and a larger 50bps cut on Tuesday. Our Bogota-based economist—Sergio Olarte—is in the 50bps camp. He acknowledges recent evidence that the economy has been contracting, but also flags a 12% minimum wage hike that is smaller than the 16% hike last year. Olarte thinks quicker easing may be in the cards through 2024H1.
BCCH—PICKING UP THE PACE
This one could be a doozie. Banco Central de Chile has cut its policy rate by 300bps so far and started with a 100bps cut last summer, after which it has delivered a mixture of 25s and 50s before cutting by 75bps in December. Tuesday’s meeting is thought to bring back the risk of another 75bps cut or possibly 100bps. December’s CPI print of 3.9% y/y was lower than expected and brings the rate closer to the central bank’s 3% target over two years. That could merit an expedited path back toward a more neutral setting.
BCB—NO MYSTERY HERE
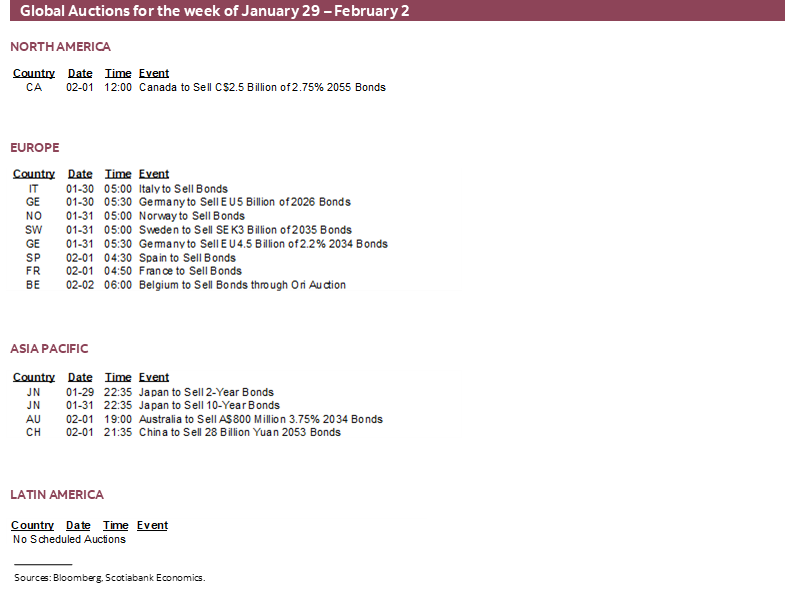
Another 50bps Selic rate cut is universally expected on Tuesday. Banco Central do Brasil explicitly guides its intentions one meeting ahead at a time as it has cut in 50bps moves for the past four meetings. This one would bring cumulative cuts to 250bps from the 13.75% policy rate peak that existed until last summer. The last statement on December 13th said that “Committee members unanimously anticipate further reductions of the same magnitude in the next meetings” and note the plural reference in terms of expectations for the next meeting on March 20th. That takes some of the fun out of it for forecasters.
RIKSBANK—A HAWKISH HOLD
Sweden’s central bank is widely expected to hold its repo rate unchanged at 4% again on Thursday. Expect a generally hawkish tone in the wake of comments from central bank officials. Governor Erik Thedeem recently said “The risk picture is relatively similar to when we last met. We have said that the exchange rate is a concern for inflation and there is no reason to change that view.” First Deputy Governor Anna Breman added that “The upside risks are somewhat larger, because of uncertainties around the global situation, corporate pricing behaviour and, to some extent, the development of the krona.”
GLOBAL MACRO—NO REASON FOR BOREDOM
Top shelf macro data will mix with a heavy line-up of company earnings reports.
One-fifth of the S&P500 releases earnings reports and guidance this week and the breadth across sectors will sharply increase. Among the household names will be Apple, Microsoft, Alphabet, Meta Platforms, Amazon, Pfizer, Merck, Boeing, UPS, etc. There will also be 17 TSX names releasing earnings reports.
Top-shelf global macroeconomic releases will include the following and I’ll write about other lower profile global readings over the coming week in daily notes:
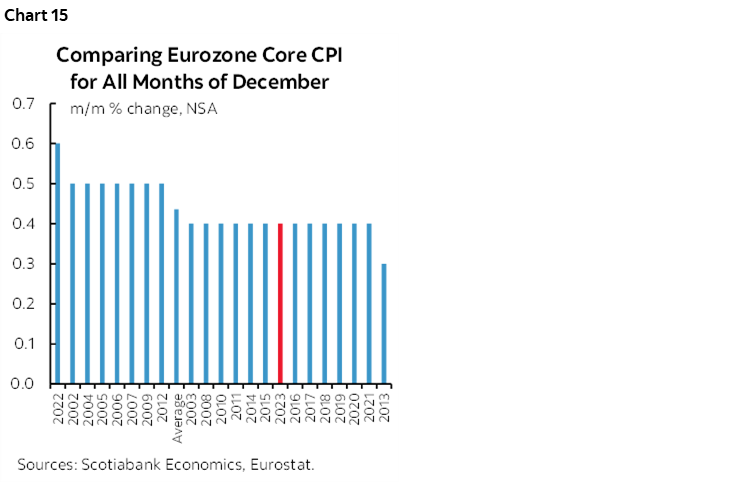
- Eurozone CPI: January’s estimate lands on Thursday. A milder than seasonally normal decline in headline CPI unadjusted for CPI is expected. Key will be core CPI that is normally quite soft in January and in the wake of the string of fairly soft readings that have been registered that is until December’s reading offered a mild warning sign against prematurely declaring victory over inflation (chart 15). Another softer than usual core reading could embolden market pricing for a near-term cut while ECB officials guide more patience and await wage setting figures that will only be available in time for the June meeting. We should have a good sense of how the number will shape up in advance as Spain (Monday), France (Tuesday), and Germany (Wednesday) report ahead of the Eurozone add-up with Italy on the same day.
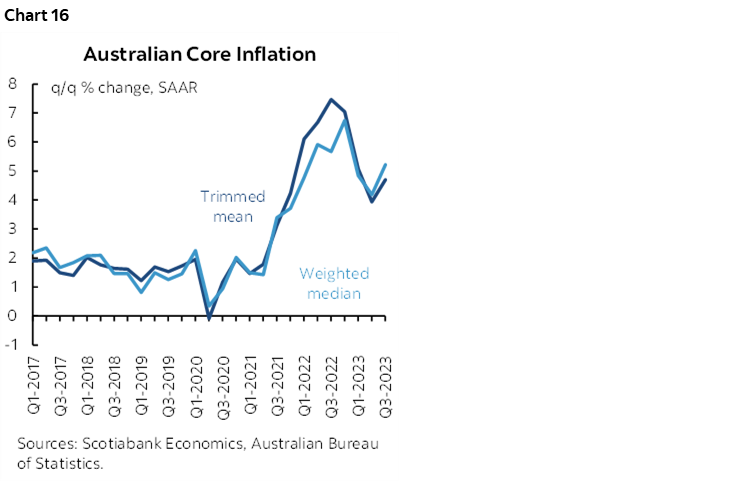
- Australian CPI: Consensus is hopefully that Tuesday’s Q4 reading will tamp down the previously hot pace at which trimmed mean and weighted median CPI estimates have been rising (chart 16). The RBA’s decision on February 6th is expected to buy time and patiently lean against pricing for a rate cut later this summer while it also awaits the February 20th release of Q4 wage growth figures.
- Chinese PMIs: China’s state purchasing managers indices for January arrive on Tuesday. They have been hovering around the 50 dividing line between expansion (above) and contraction (below). The sudden speed with which Chinese officials have guided openness toward applying stimulus that has included another cut to the required reserve ratio and more targeted measures may be a warning sign on coming data.
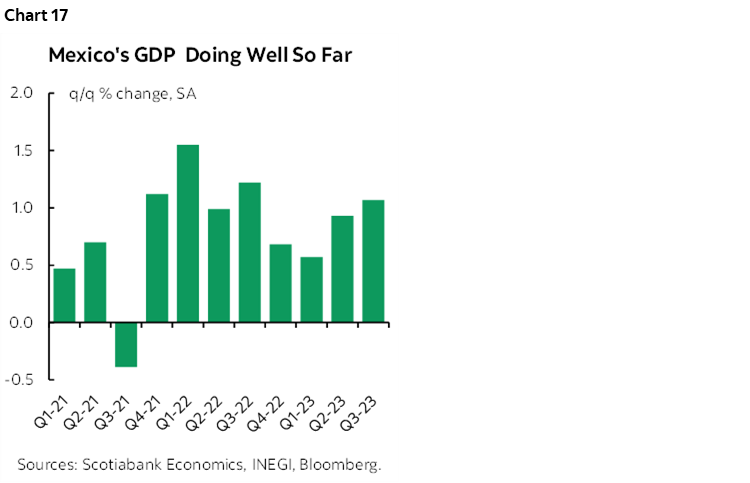
- GDP: Several economies report Q4 GDP figures this week. The biggest will be the Eurozone on Tuesday amid expectations for no growth. Italy and Spain (Monday) could inform this estimate while Germany and France release on the same day. Sweden updates on Monday and is expected to post mild growth. Mexico’s economy has been doing quite well for a while now (chart 17) and Q4 GDP will seek to keep the streak alive on Thursday.
- Inflation: Other than the Eurozone, other inflation updates will come from Peru (Thursday) before the following week’s policy decision by Banco Central de Reserva del Peru. Indonesia updates CPI on Wednesday, followed by South Korea on Thursday.
Other US releases will pale by comparison to whatever the Fed says and the job market readings that are recited above. Consumer confidence for January (Tuesday) could be impactful and may post a mild gain on strength in markets and jobs plus lower gasoline prices. ISM-manufacturing for January (Thursday) is expected to be little changed and continue to indicate a manufacturing sector in mild contraction. Unfortunately, the more impactful ISM-services gauge won’t arrive until the following week. Repeat home sales prices for November (Tuesday) should post another decent gain. Construction spending for December (Thursday), vehicle sales for January (Thursday) and factory orders for December (Friday) complete the line-up.
DISCLAIMER
This report has been prepared by Scotiabank Economics as a resource for the clients of Scotiabank. Opinions, estimates and projections contained herein are our own as of the date hereof and are subject to change without notice. The information and opinions contained herein have been compiled or arrived at from sources believed reliable but no representation or warranty, express or implied, is made as to their accuracy or completeness. Neither Scotiabank nor any of its officers, directors, partners, employees or affiliates accepts any liability whatsoever for any direct or consequential loss arising from any use of this report or its contents.
These reports are provided to you for informational purposes only. This report is not, and is not constructed as, an offer to sell or solicitation of any offer to buy any financial instrument, nor shall this report be construed as an opinion as to whether you should enter into any swap or trading strategy involving a swap or any other transaction. The information contained in this report is not intended to be, and does not constitute, a recommendation of a swap or trading strategy involving a swap within the meaning of U.S. Commodity Futures Trading Commission Regulation 23.434 and Appendix A thereto. This material is not intended to be individually tailored to your needs or characteristics and should not be viewed as a “call to action” or suggestion that you enter into a swap or trading strategy involving a swap or any other transaction. Scotiabank may engage in transactions in a manner inconsistent with the views discussed this report and may have positions, or be in the process of acquiring or disposing of positions, referred to in this report.
Scotiabank, its affiliates and any of their respective officers, directors and employees may from time to time take positions in currencies, act as managers, co-managers or underwriters of a public offering or act as principals or agents, deal in, own or act as market makers or advisors, brokers or commercial and/or investment bankers in relation to securities or related derivatives. As a result of these actions, Scotiabank may receive remuneration. All Scotiabank products and services are subject to the terms of applicable agreements and local regulations. Officers, directors and employees of Scotiabank and its affiliates may serve as directors of corporations.
Any securities discussed in this report may not be suitable for all investors. Scotiabank recommends that investors independently evaluate any issuer and security discussed in this report, and consult with any advisors they deem necessary prior to making any investment.
This report and all information, opinions and conclusions contained in it are protected by copyright. This information may not be reproduced without the prior express written consent of Scotiabank.
™ Trademark of The Bank of Nova Scotia. Used under license, where applicable.
Scotiabank, together with “Global Banking and Markets”, is a marketing name for the global corporate and investment banking and capital markets businesses of The Bank of Nova Scotia and certain of its affiliates in the countries where they operate, including; Scotiabank Europe plc; Scotiabank (Ireland) Designated Activity Company; Scotiabank Inverlat S.A., Institución de Banca Múltiple, Grupo Financiero Scotiabank Inverlat, Scotia Inverlat Casa de Bolsa, S.A. de C.V., Grupo Financiero Scotiabank Inverlat, Scotia Inverlat Derivados S.A. de C.V. – all members of the Scotiabank group and authorized users of the Scotiabank mark. The Bank of Nova Scotia is incorporated in Canada with limited liability and is authorised and regulated by the Office of the Superintendent of Financial Institutions Canada. The Bank of Nova Scotia is authorized by the UK Prudential Regulation Authority and is subject to regulation by the UK Financial Conduct Authority and limited regulation by the UK Prudential Regulation Authority. Details about the extent of The Bank of Nova Scotia's regulation by the UK Prudential Regulation Authority are available from us on request. Scotiabank Europe plc is authorized by the UK Prudential Regulation Authority and regulated by the UK Financial Conduct Authority and the UK Prudential Regulation Authority.
Scotiabank Inverlat, S.A., Scotia Inverlat Casa de Bolsa, S.A. de C.V, Grupo Financiero Scotiabank Inverlat, and Scotia Inverlat Derivados, S.A. de C.V., are each authorized and regulated by the Mexican financial authorities.
Not all products and services are offered in all jurisdictions. Services described are available in jurisdictions where permitted by law.