Next Week's Risk Dashboard
- Gong Xi Fa Cai!
- US core CPI will probably extend the trend…
- …and what the Fed will be closely watching
- Revised spending weights to have little effect on US CPI
- Lower income households face their pressures…
- …but it’s the wealthy driving US consumer spending
- Can strong US core retail sales repeat?
- Canada’s housing market is only just beginning to surge
- Everything you ever wanted to know about the UK in one week
- Aussie jobs: aberration or cracking?
- Indonesians head to the polls
- Russia’s central bank will probably hold
- Ditto for the Philippines’ central bank
- Earnings season continues
- Other global macro
- Canadian early close
Chart of the Week
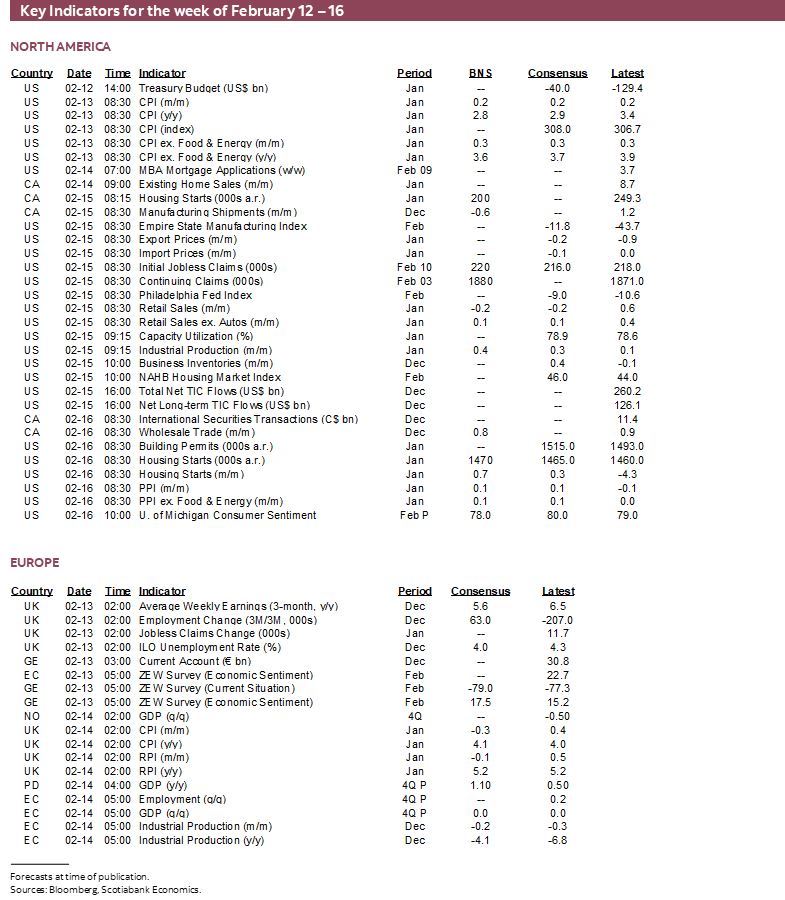
Gong Xi Fa Cai! Chinese markets will be shut for annual Lunar New Year festivities. The state of the US consumer will be front and center this week in an otherwise relatively light set of calendar-based developments for markets to consider. US CPI will inform cost pressures that they are facing, while retail sales might find December’s gain to be a hard act to follow.
Amid the obsession with short-term data, however, is the question who is driving consumption?
If, for instance, it’s all lower income households who are facing worse pressures than richer households, then the US economy could be in trouble, right?
Not so fast. Using calculations derived from the BLS’s Consumer Expenditure Survey, chart 1 shows the upper 20% of earners in the US drove about 40% of consumption growth over the pandemic, approximated by using 2019 to 2022 data which is the freshest available. Add in the next highest 20% and it takes the share of total consumption growth that has been driven by the top 40% of earners to 61%. It's a very similar picture over the longer full-decade picture that's also shown in the chart.
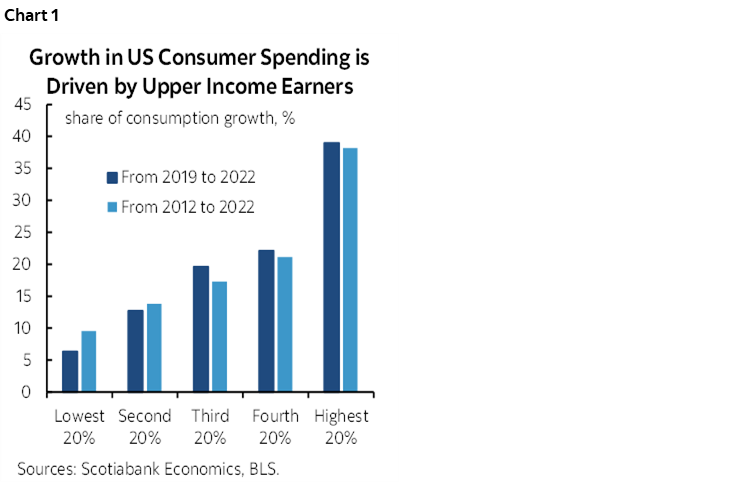
As for the bottom 20% of earners, well, they only accounted for a single digit share of consumption growth. The bottom two income quintiles only counted for just under 20% of consumption growth during the pandemic.
There are real challenges to lower income households and so I wouldn’t want these points to be misinterpreted as celebrating anyone’s misfortune. But for readers of a note like this who are focused upon prospects for overall US consumption growth and its influences upon a variety of considerations from the stock market to the Fed, the clear message is to focus upon upper income earners. They are steering the ship with better means to manage today’s challenges.
US INFLATION—SAME TREND, SAME CAUTIONS?
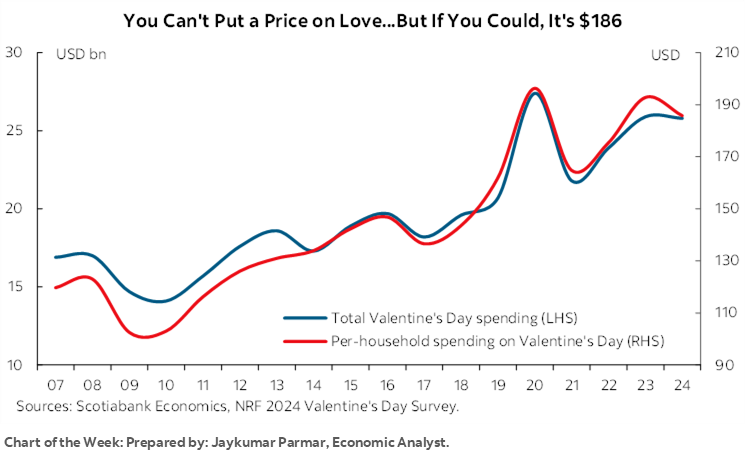
Fortunately, inflation is not quite cutting as hard against many consumers’ circumstances today, even though in my opinion there remain sizeable upside risks that counsel forward-looking caution by the Federal Reserve. That’s minor relief in time for Valentine’s Day as Jay Parmar’s chart of the week on the front cover reminds us.
In the here and now, however, the focus will be upon US CPI that will be updated for the month of January on Tuesday. It’s probably shaping up to offer more of the same old same old thing that markets have become accustomed to seeing over recent prints.
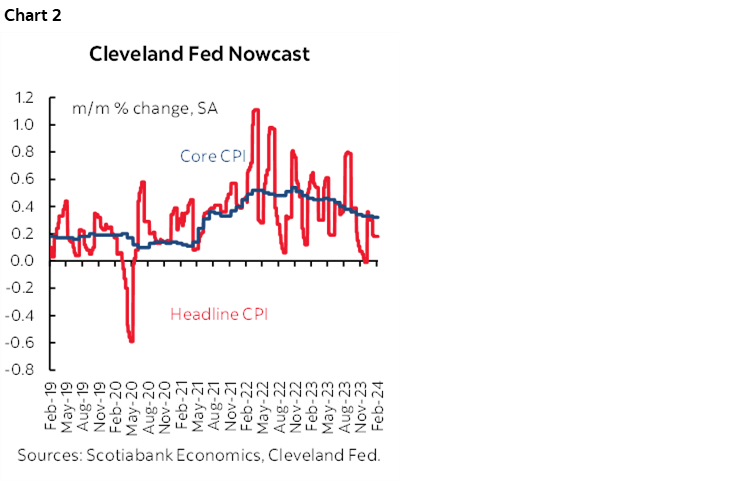
My estimates this time are within the range of other attempts. Headline CPI is forecast to rise 0.2% m/m SA with core CPI excluding food and energy up by 0.3%. That should bring the year-over-year rate down to 2.8% from 3.4% and core to 3.6% from 3.9%. These estimates are similar to the Cleveland Fed’s nowcasts that are shown in chart 2.
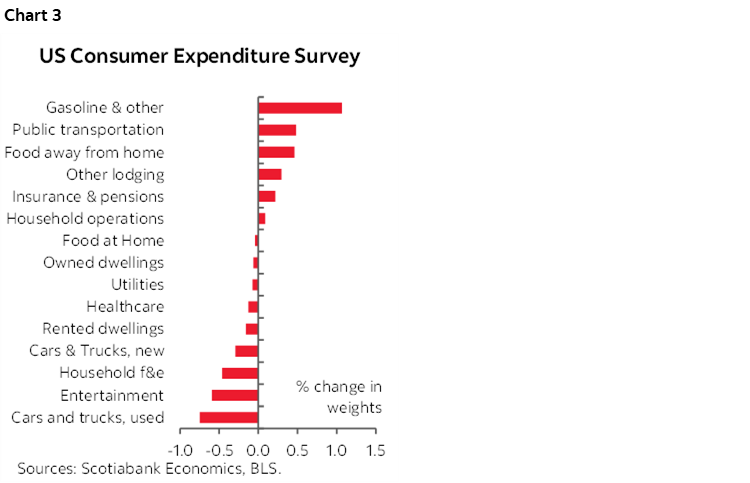
Before delving into some of the reasoning, note that spending weights will be updated in this release based upon the changed composition of consumer spending in 2022 versus 2021 derived from the Consumer Expenditure Surveys from the Bureau of Labour Statistics. They are not expected to have a meaningful impact upon the estimates. Chart 3 shows the main changes. There will be higher weights upon gasoline, plus public transportation and food away from home, but lower weights on used vehicles and a few other categories. Applying these weight changes to December’s CPI reading, for example, would have only reduced it by -0.01%, or one-hundredth of a percentage point. I’m pretty sure the margins of error around a monthly CPI forecast swamp that effect!
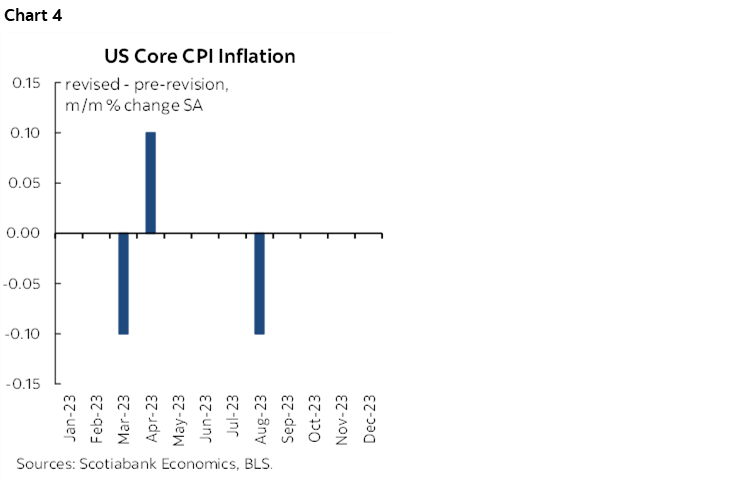
Recently released changes to seasonal adjustment factors will also be applied, but they had no material effect when applied to recent data (chart 4) and are not expected to be a material issue.
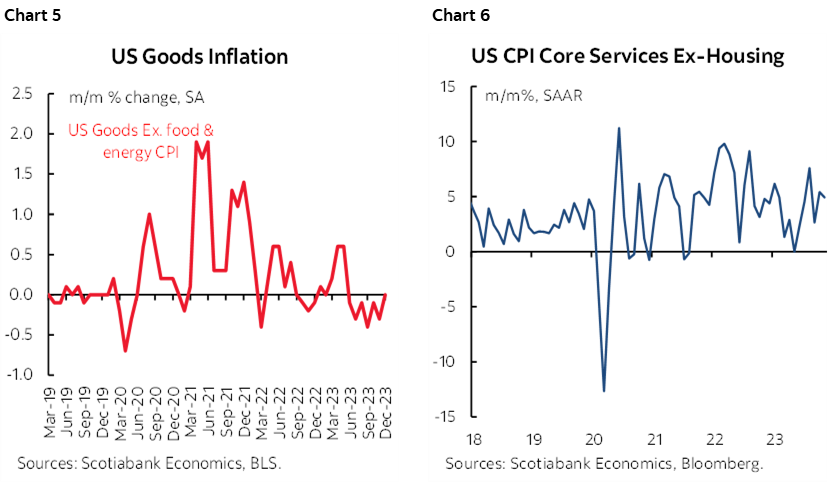
Key in a bigger picture sense will be whether the prior month’s warning that core goods disinflation is waning (chart 5) while core services inflation ex-housing remains firm (chart 6) was a one-off or the start of renewed pressures. If core services price inflation remains sticky and the post-pandemic moderation of goods inflation has run its course then this could play to Chair Powell’s concern that “Over time, goods inflation will flatten out and so disinflation will require services inflation to contribute more.” This was a major source of Powell’s uncertainty and caution that he summarized by saying “Ongoing progress in bringing it down is not assured” in reference to inflation.
As for the drivers, seasonally unadjusted prices normally tick higher in January, but some prices behaved in seasonally abnormal fashion. Gasoline prices fell by a little more than is seasonally normal and should help to explain a slightly softer headline reading than core in month-over-month terms. Little contribution is expected from food prices. Henry Hub natural gas prices surged last month as cold conditions spark demand, but the tiny weight on the overall ‘fuel oil and other fuels’ category should yield little effect.
Vehicle prices slipped by a bit more than is seasonally normal in January. Estimates from industry sources point to about 2% m/m SA declines in new vehicle prices as well as trade-ins as a proxy for used. The roughly 7% combined weight may drag about -0.1% m/m SA off of headline CPI and a little more off of core. There is the usual translation risk in terms of how the BLS captures vehicle prices using its own data.
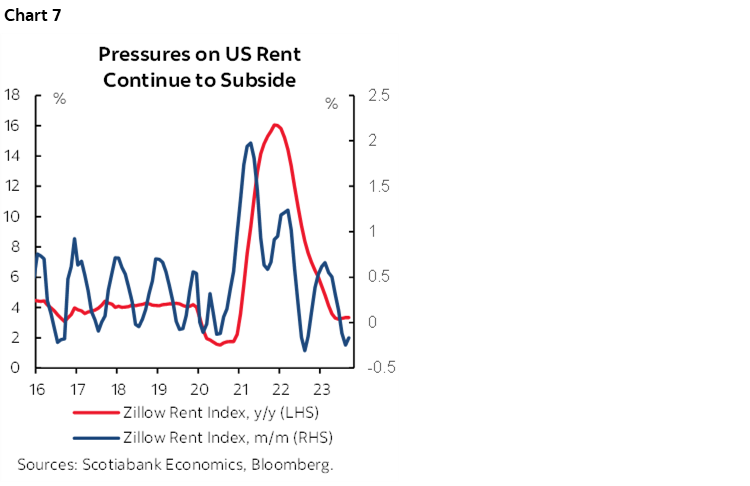
Shelter costs are expected to continue to put upward pressure upon inflation. Another rise in rent of primary residence of 0.4–0.5% m/m SA is expected notwithstanding downward pressures upon Zillow’s rent gauge (chart 7), along with a gain in Owners’ Equivalent Rent of 0.5%.
Whatever the exact estimate, one thing is always assured in today’s markets: a small miss or beat is likely to drive a big overreaction in markets and exaggerated headlines. Powell has made it clear they wish to see more evidence over at least a few months while emphasizing numerous uncertainties around the drivers. For example, with wage growth on an upward trend in m/m SAAR terms, will the productivity surge stick, and what if the US economy’s strong performance pushes capacity constraints just as global supply chains threaten renewed passthrough price pressures?
THE US WILL ALSO FOCUS UPON RETAIL SALES
US macro reports will be dominated by CPI (see above) but also retail sales on Thursday. A small decline is likely with my estimate at -0.2% m/m SA. That’s mainly because auto sales fell by about 5% m/m SA in January. Gasoline prices also fell a bit in seasonally adjusted terms. To stay in the black would require a strong gain in sales excluding autos and gas on the heels of the solid gain in December. There is probably some downside risk.
Other US macro reports will be covered throughout the week. They will include NFIB small business confidence and plans (Tuesday), the start of regional manufacturing surveys with the Empire and Philly measures (Thursday), industrial output (Thursday), housing starts (Friday), producer prices (Friday) and UMich consumer sentiment (Friday).
CANADIAN HOUSING IS JUST GETTING STARTED
Canadian bond markets will shut early on Friday at 1pmET ahead of the Family Day long weekend.
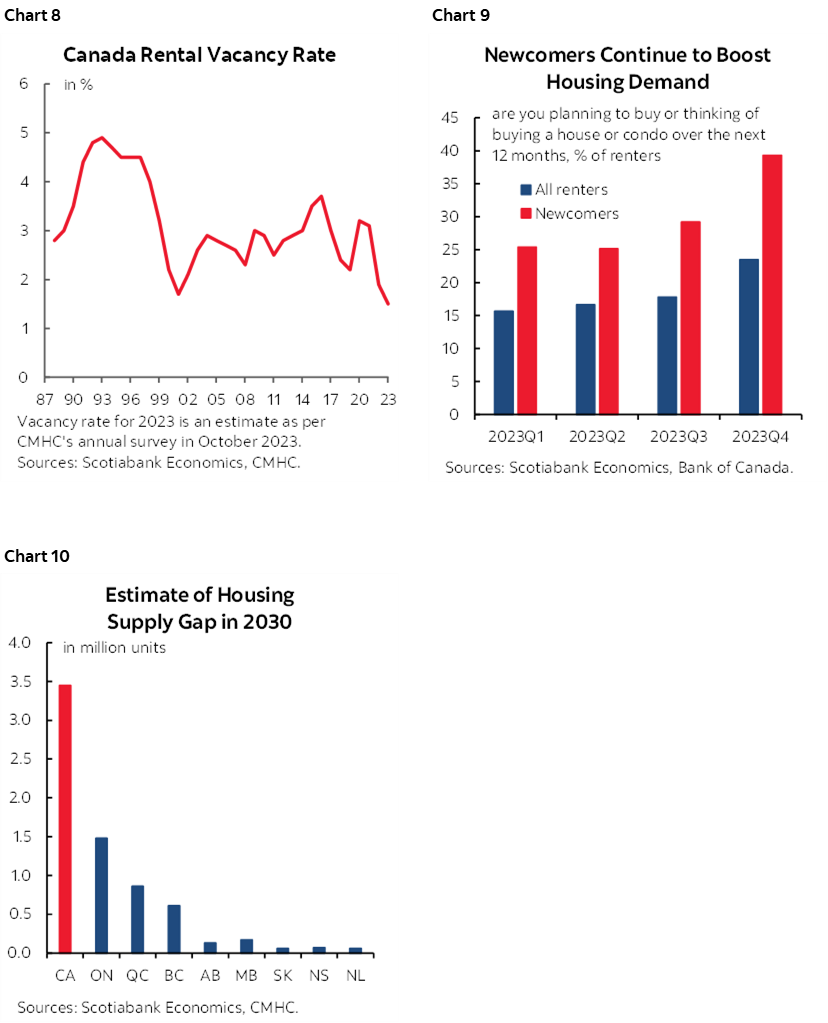
Housing data will figure prominently, though rarely impacts financial markets in the short-term. Another large gain in existing home sales is expected to be reported for January on the heels of the 8.7% m/m SA surge in December. This expectation is based upon tracking across individual cities such as Toronto, Vancouver, Montreal, Calgary, and Quebec City. Continued momentum is expected with one reason being high immigration and a very tight rental market (chart 8) coupled with high and rising intentions of all renters—especially new arrivals—to purchase a home over the coming year (chart 9). That is to be placed in the context of a severe housing shortage (chart 10).
Other than housing data, a pair of other releases will further inform December GDP tracking after Statcan’s preliminary guidance it grew by 0.3% m/m SA that month. Manufacturing sales for December (Thursday) will probably post a decline of -0.6% m/m in dollar value terms based on preliminary guidance from Statistics Canada, but that’s likely to be entirely due to lower prices instead of volumes; industrial prices fell 1.5% m/m NSA and -0.6% m/m NSA excluding energy. Wholesale trade probably climbed by just shy of 1% m/m SA based on Statcan’s preliminary guidance but that may be a price effect since Statcan’s guidance for December GDP indicated softness in related sectors.
A KEY WEEK FOR THE UK ECONOMY
The UK economy will be a major focal point throughout the week.
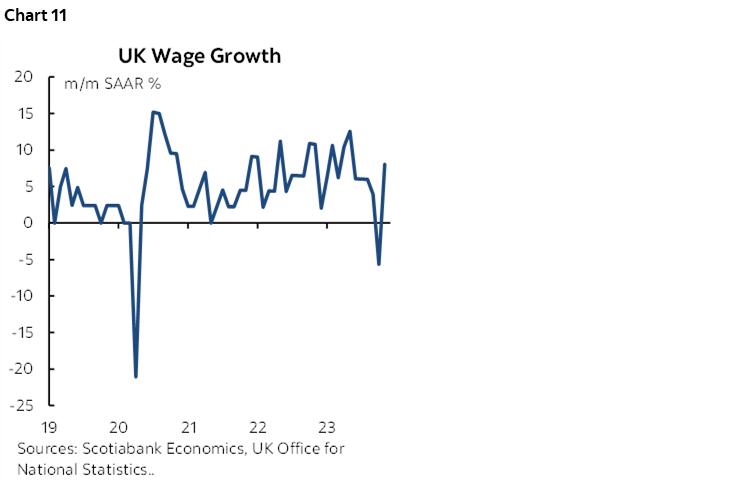
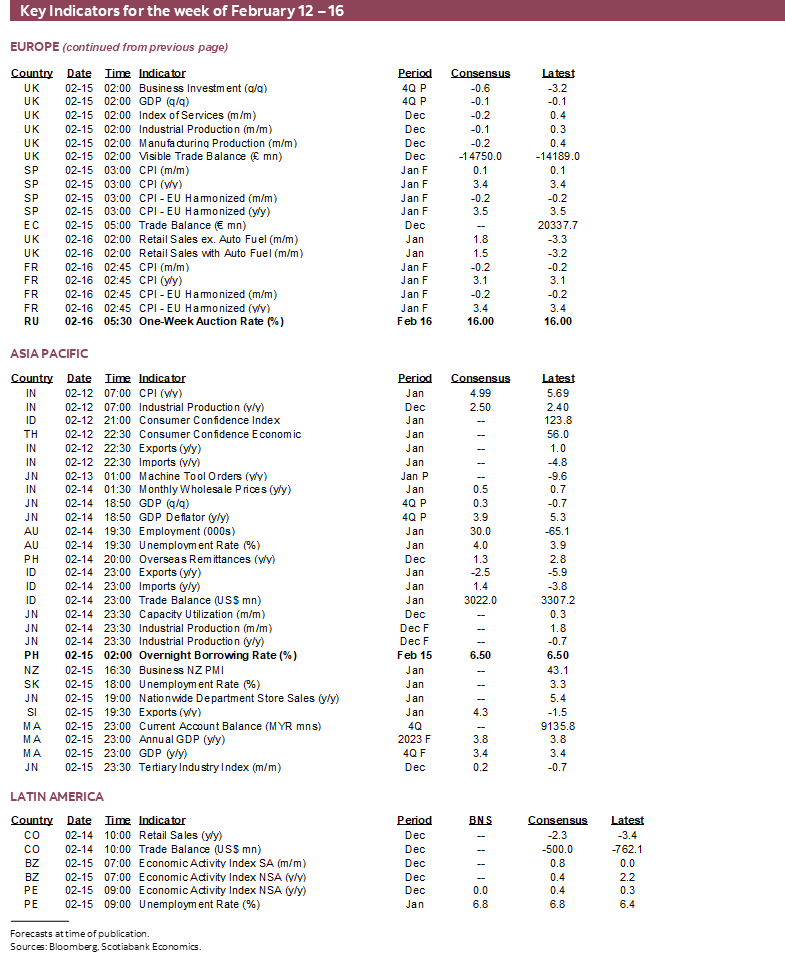
- Job markets: Payrolls fell in December by the most since late 2020 and January’s update on Tuesday will inform whether it was an aberration or the start of something more serious. So will the resumption of publishing total employment figures that same day. Jobless claims have been holding reasonably steady with January’s update also due. Key, however, may be wages during December given the volatile pattern of late (chart 11).
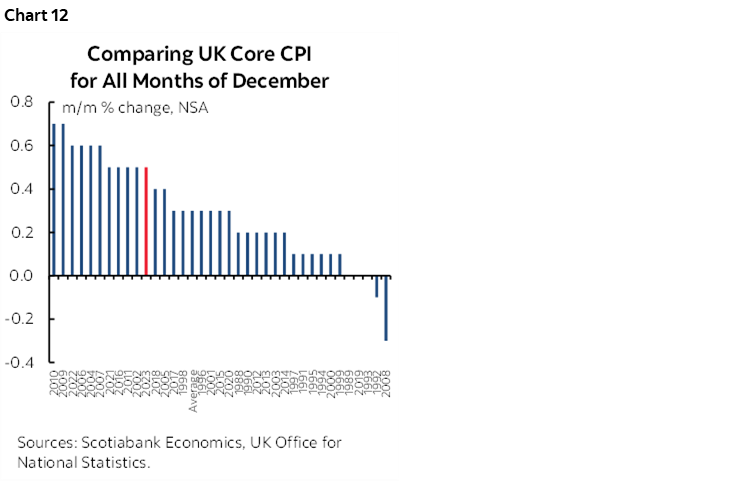
- CPI: January’s update follows on Wednesday. Like wages, the pattern of changes in core CPI inflation has been erratic of late. December’s core reading was among the hottest months of January on record in seasonally unadjusted form (chart 12) and that followed one of the weakest months of November on record that in turn followed a long stretch of stronger than usual readings. January will help to inform a trend.
- Q4 GDP: Thursday’s estimate will be a close call in determining whether the UK economy meets the technical definition of recession. The economy posted a very slight contraction of -0.1% q/q SA in Q3 after a flat Q2 and expectations for a flat Q4. The UK economy hs been largely moving sideways for an extended period.
- Other releases: Industrial output (Thursday), the monthly services index (Thursday), trade figures (Thursday) and retail sales (Friday) will round it all out with December and January readings that help us to further understand economic momentum into Q1.
AUSTRALIAN JOBS—CRACKING, OR AN ABERRATION?
Is Australia’s job market cracking? The loss of 107k full-time jobs in December that drove total employment down by 65k amid a gain in part-time jobs sent a warning shot. Most economists expect a partial rebound when January’s reading arrives on Wednesday. The Australian Bureau of Statistics itself seemed dismissive toward December’s loss when it noted that it should be taken in the context of the large 117k gain over the prior two months alongside adverse weather in parts of the country.
A QUIET WEEK FOR GLOBAL CENTRAL BANKS
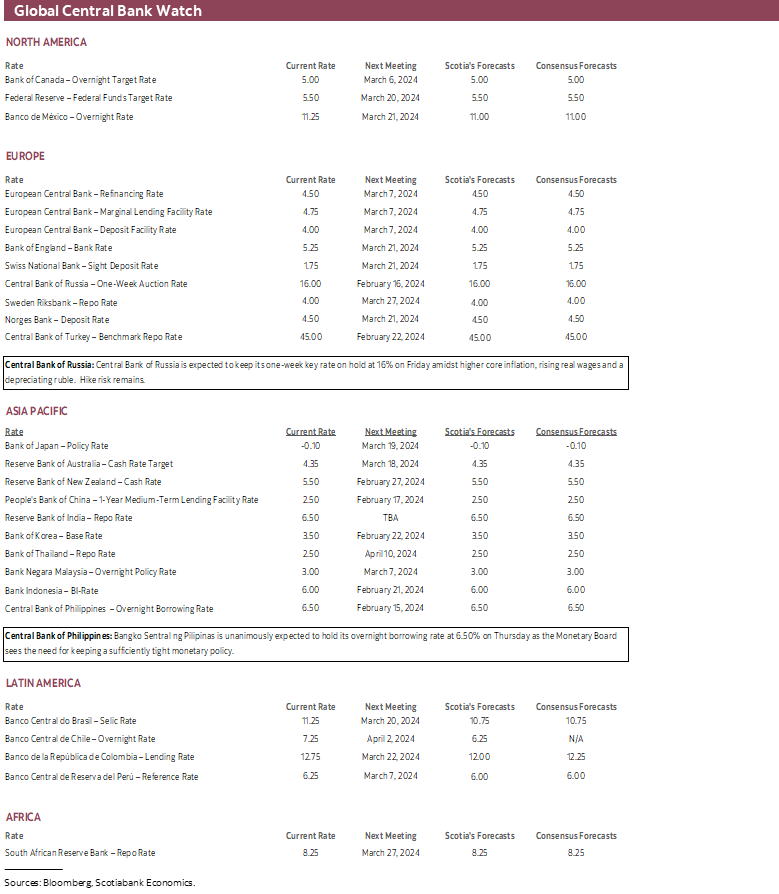
Central banks will be quiet this week with no top tier ones on the docket.
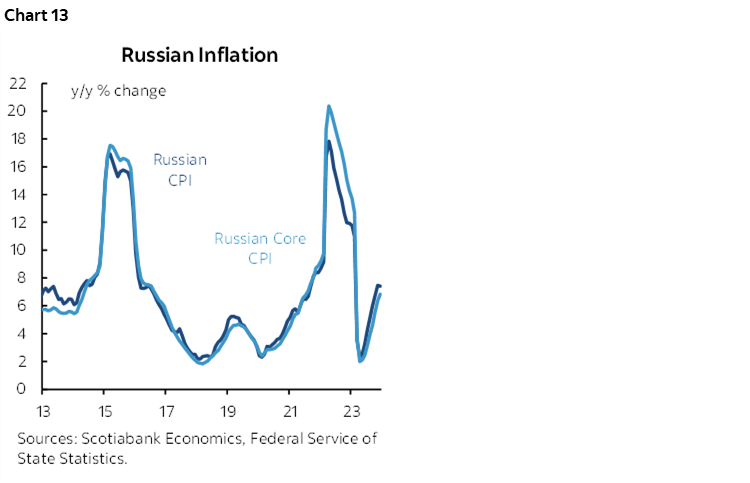
- Russia’s central bank (Friday): Is Russia’s 16% policy rate at a peak and will the central bank guide future easing? That’s unclear. 850bps of hikes since last summer need to be given time to have their full effects. And yet since the last 100bps hike in December, core inflation has moved higher to 6.8% y/y and has been trending higher through much of the past year. Real wages are rising by 7.2% y/y which is toward a multi-year high which could make it hard to contain inflation (chart 13). Furthermore, the ruble has resumed depreciation, falling by 3½% to the USD since about mid-January. Also note that a bit of a bun fight on capital controls has emerged between the central bank and government officials. The central bank has questioned the impact of the capital controls and argued against extending them while the government says they have been effective at stabilizing the ruble.
- Bangko Sentral ng Pilipinas (Thursday): The central bank of the Philippines is expected to extend its pause by setting the overnight borrowing rate at 6.5% this week. Its last statement in December stated that “the balance of risks to the inflation outlook still leans significantly toward the upside” and that “the Monetary Board continues to see the need to keep monetary policy settings sufficiently tight.” Since then, Q4 GDP growth beat expectations with upward revisions that keep the pressure upon inflation while headline/core CPI has moved to 2.8%/3.8% y/y and therefore within the central bank’s 2–4% target range.
OTHER GLOBAL DEVELOPMENTS
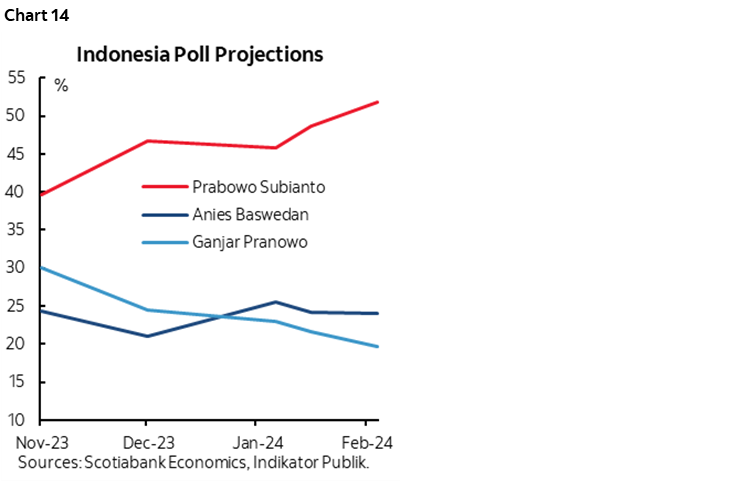
Indonesians will vote in a new government on Wednesday—and get a day off to vote to boot! President Joko Widodo has hit his two-term limit and so three leading candidates are vying to be his replacement (chart 14).
India’s CPI inflation rate for January (Monday) arrives after the RBI’s hawkish hold this past week. A further deceleration toward 5% y/y is expected.
Japan’s Q4 GDP growth estimate (Wednesday) is expected to post a mild rebound from the prior quarter’s contraction of nearly 3% q/q SAAR. Some within consensus think there is a chance at a much softer number.
LatAm markets face light developments with most of the focus upon Colombia. Q4 GDP (Thursday) is expected to post mild year-over-year growth. Retail sales and industrial output (Wednesday) will add to the picture with December readings that help to estimate hand-off effects to Q1.
Earnings season will also remain active. Thirty-eight TSX-listed firms in Canada will release this week including names like Shopify, Hydro One, Barrick Gold, Air Canada, several life insurers, and several resource firms. Sixty-three US firms will update but none are likely to be impactful to the broad market tone.

DISCLAIMER
This report has been prepared by Scotiabank Economics as a resource for the clients of Scotiabank. Opinions, estimates and projections contained herein are our own as of the date hereof and are subject to change without notice. The information and opinions contained herein have been compiled or arrived at from sources believed reliable but no representation or warranty, express or implied, is made as to their accuracy or completeness. Neither Scotiabank nor any of its officers, directors, partners, employees or affiliates accepts any liability whatsoever for any direct or consequential loss arising from any use of this report or its contents.
These reports are provided to you for informational purposes only. This report is not, and is not constructed as, an offer to sell or solicitation of any offer to buy any financial instrument, nor shall this report be construed as an opinion as to whether you should enter into any swap or trading strategy involving a swap or any other transaction. The information contained in this report is not intended to be, and does not constitute, a recommendation of a swap or trading strategy involving a swap within the meaning of U.S. Commodity Futures Trading Commission Regulation 23.434 and Appendix A thereto. This material is not intended to be individually tailored to your needs or characteristics and should not be viewed as a “call to action” or suggestion that you enter into a swap or trading strategy involving a swap or any other transaction. Scotiabank may engage in transactions in a manner inconsistent with the views discussed this report and may have positions, or be in the process of acquiring or disposing of positions, referred to in this report.
Scotiabank, its affiliates and any of their respective officers, directors and employees may from time to time take positions in currencies, act as managers, co-managers or underwriters of a public offering or act as principals or agents, deal in, own or act as market makers or advisors, brokers or commercial and/or investment bankers in relation to securities or related derivatives. As a result of these actions, Scotiabank may receive remuneration. All Scotiabank products and services are subject to the terms of applicable agreements and local regulations. Officers, directors and employees of Scotiabank and its affiliates may serve as directors of corporations.
Any securities discussed in this report may not be suitable for all investors. Scotiabank recommends that investors independently evaluate any issuer and security discussed in this report, and consult with any advisors they deem necessary prior to making any investment.
This report and all information, opinions and conclusions contained in it are protected by copyright. This information may not be reproduced without the prior express written consent of Scotiabank.
™ Trademark of The Bank of Nova Scotia. Used under license, where applicable.
Scotiabank, together with “Global Banking and Markets”, is a marketing name for the global corporate and investment banking and capital markets businesses of The Bank of Nova Scotia and certain of its affiliates in the countries where they operate, including; Scotiabank Europe plc; Scotiabank (Ireland) Designated Activity Company; Scotiabank Inverlat S.A., Institución de Banca Múltiple, Grupo Financiero Scotiabank Inverlat, Scotia Inverlat Casa de Bolsa, S.A. de C.V., Grupo Financiero Scotiabank Inverlat, Scotia Inverlat Derivados S.A. de C.V. – all members of the Scotiabank group and authorized users of the Scotiabank mark. The Bank of Nova Scotia is incorporated in Canada with limited liability and is authorised and regulated by the Office of the Superintendent of Financial Institutions Canada. The Bank of Nova Scotia is authorized by the UK Prudential Regulation Authority and is subject to regulation by the UK Financial Conduct Authority and limited regulation by the UK Prudential Regulation Authority. Details about the extent of The Bank of Nova Scotia's regulation by the UK Prudential Regulation Authority are available from us on request. Scotiabank Europe plc is authorized by the UK Prudential Regulation Authority and regulated by the UK Financial Conduct Authority and the UK Prudential Regulation Authority.
Scotiabank Inverlat, S.A., Scotia Inverlat Casa de Bolsa, S.A. de C.V, Grupo Financiero Scotiabank Inverlat, and Scotia Inverlat Derivados, S.A. de C.V., are each authorized and regulated by the Mexican financial authorities.
Not all products and services are offered in all jurisdictions. Services described are available in jurisdictions where permitted by law.