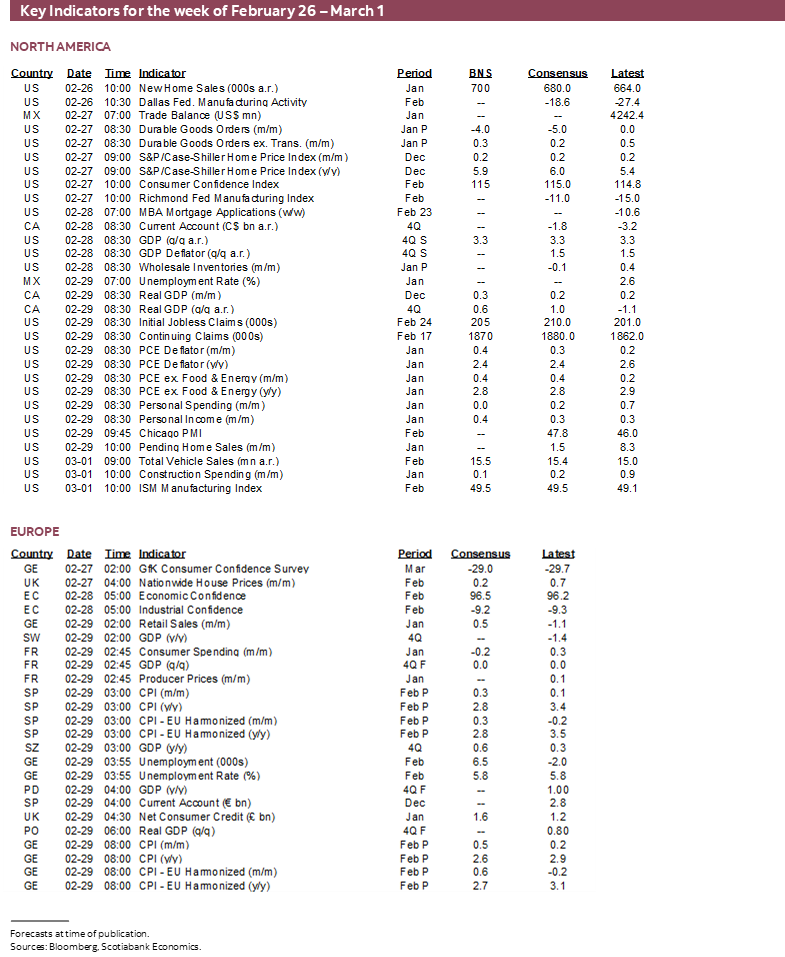
Next Week's Risk Dashboard
- Key data to inform the path to Spring by major central banks
- The Fed’s preferred inflation gauge could be the hottest in a year
- Will Eurozone core CPI extend the warning signs?
- The ECB’s wage focus
- Canadian GDP may be on the path to recovery…
- …and is looking better under the hood
- Hot housing, fiscal pump priming, rebounding growth to restrain BoC doves
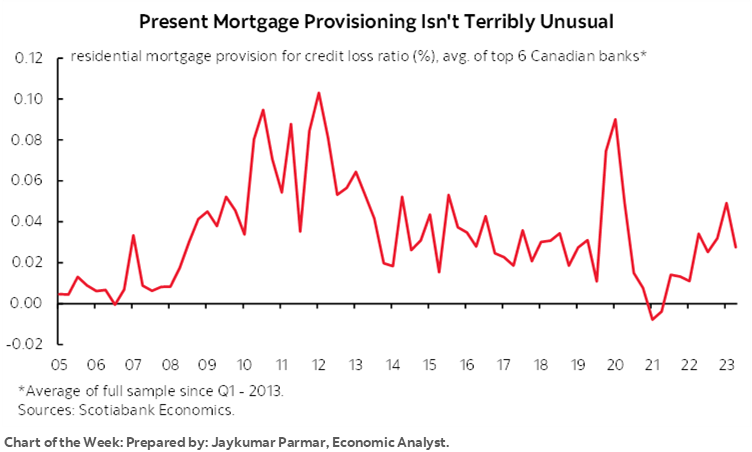
- Canadian bank earnings season to highlight mortgage resilience
- Japan’s waning core inflation lends caution against ending negative rates
- China’s PMIs to inform economic momentum
- The RBNZ’s first decision after being freed of political meddling
- Global macro indicators, US primaries
Chart of the Week
This week’s global developments could further inform the path toward potential policy moves by major central banks into Spring time, at least in the northern hemisphere. Canada may be sowing an economic rebound into a thawing housing market and more fiscal stimulus that could disappoint the camp that believes in early rate cuts but in a good news is bad news sort of way. Inflation updates from the US, Europe and Japan won’t drive any immediate decisions, but could be material to determining exactly how patient their central banks may be in the coming months. The RBNZ has been freed from political meddling to determine the next course of action. Canadian bank earnings will also focus upon the key issue of mortgage market resilience. Throughout it all will be a wave of global indicators and a couple of no-contest US primaries.
CANADA’S ECONOMY—KEEP PAYING
Canada updates GDP growth in a batch of estimates that will land on Thursday. I’ve gone with 0.6% q/q Q4 growth at a seasonally adjusted and annualized rate, as well as 0.3% m/m SA growth in December. The preliminary estimate for January sans details will also be offered by Statcan and that could be another positive.
These estimates compare to the Bank of Canada’s forecast for Q4 GDP growth in the January MPR of 0.5% q/q SAAR and Statcan’s 0.3% initial ‘flash’ guidance for December. A simple model that I run estimates lower growth than 0.3% for December, but it inadequately captures areas that Statcan said were upsides in their very limited guidance that pointed to mining, quarrying and oil and gas extraction as well as real estate and rental and leasing activities.
One driver of these estimates is hours worked since GDP is an identity defined as aggregate hours worked times labour productivity with the latter defined as output (or real GDP) per hour worked. For Q4 overall, hours worked fell by 1% q/q SAAR and will be a drag on GDP growth. For GDP growth to stay in the black in Q4 there would have to be strength in activity readings.
Having said that, the blight on hours worked was mostly in November when they dropped by -0.5% m/m SA and at the point of hand-off to Q4 back in September when hours fell by -0.2%. Since then, hours surged in December (+0.3% m/m SA) and January when the 0.6% rise was the biggest jump since last January. GDP during those two months will get a lift from hours all else equal.
In fact, the momentum in play is very powerful into 2024. These two latest monthly increases in hours worked ‘bake in’ a very strong gain of 2.6% q/q SAAR in hours worked during Q1 based upon Q4 and the way that hours transitioned into the start of the new year while assuming February and March see flat hours solely for the purpose of focusing the math on known variables so far.
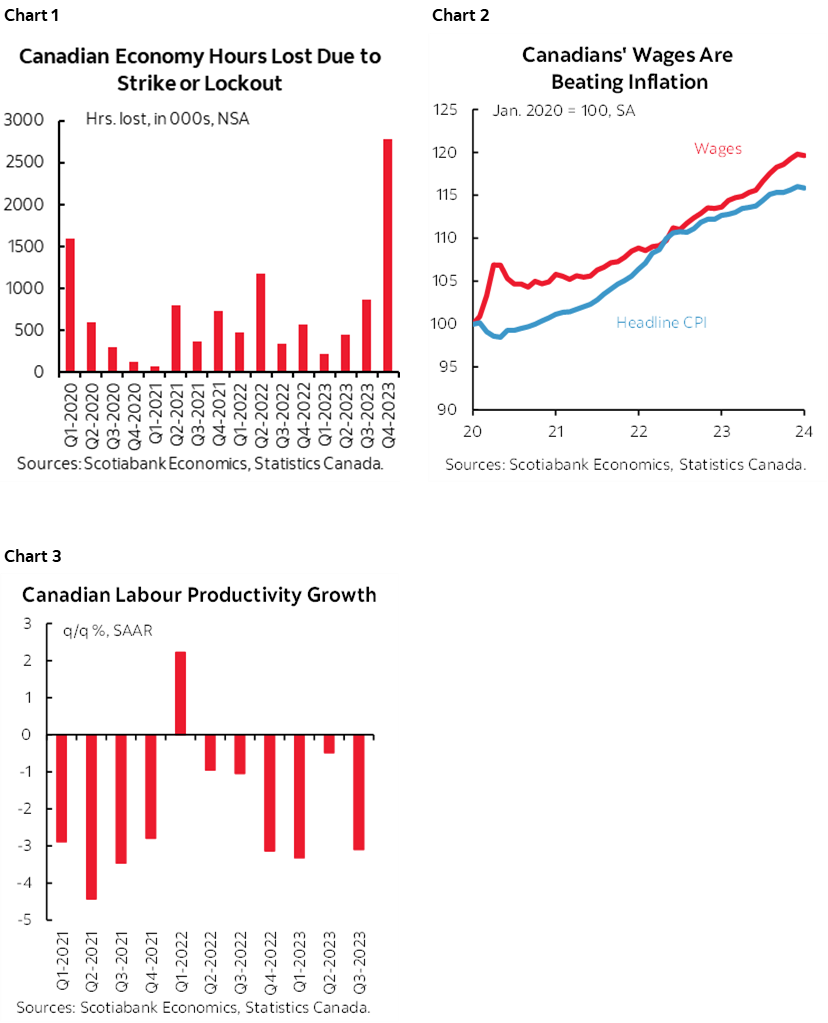
Why is this happening? It’s not just with the return of baseball’s spring training that folks are yelling ‘stttttrrrike!!’. Striking workers accounted for a bigger hit to lost hours worked in the economy than during the effects of pandemic lockdowns (chart 1). Wow. Regular readers know that I don’t accept that the strikes are about make-up pay as average hourly earnings have risen faster than inflation throughout the pandemic (chart 2) and despite terrible labour productivity (chart 3). Nevertheless, as those strikes settled, hours worked rebounded among other influences. I would expect a lot of volatility in strike effects on hours this year based upon expiring collective bargaining agreements in a highly unionized Canadian economy.
Another influence upon GDP growth is going to be net trade. Export volumes were up by just under 3% q/q SAAR in Q4 over Q3 while import volumes fell by about –½%. Higher exports and less of an import leakage effect from the GDP accounts reinforce one another to contribute favourably to GDP growth in Q4.
Now here is where the rub lies. Inventories. Ugh. You want to bust up a party and send folks diving under sofas real fast then get an economist to start talking about inventories, but it’s important nevertheless. Inventories have been a big drag on GDP growth over the past several quarters (chart 4). Inventories knocked a whopping four percentage points off of 2022Q4 GDP growth, another 3.1% off GDP growth in 2023Q1, were a neutral influence in 2023Q2 (+0.1%) and then knocked another one point off Q3.
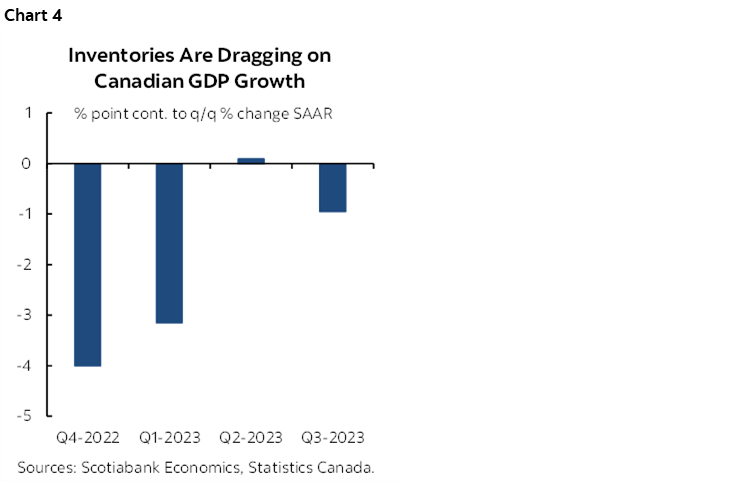
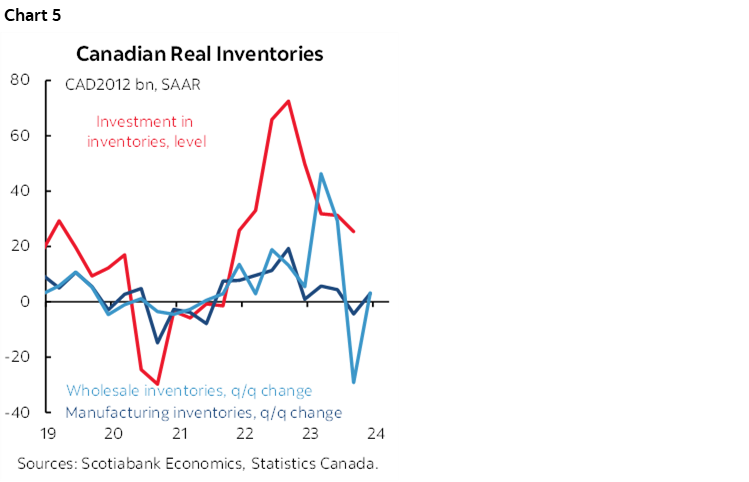
Chart 5 is the best we can do to track how they performed in Q4; it looks like manufacturing and wholesale inventory disinvestment ebbed which should be a plus for GDP growth. We cannot, however, adequately track inventories across much of the rest of the economy including retailers that report inventories quarterly up to Q3, resource sectors and agriculture. That chart shows that what we can track is at best very, very loosely correlated with changes in total inventories and so that’s going to be a significant wildcard into the reports.
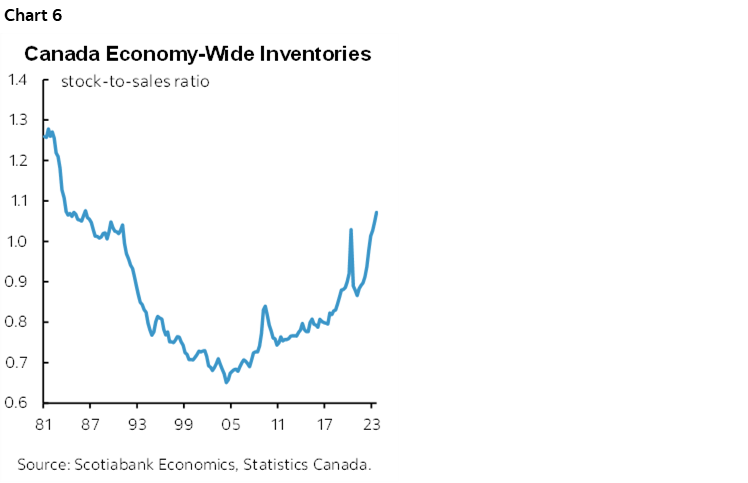
The fact that inventories have been a drag on growth is not necessarily a bad thing. In fact, I like to see companies shifting toward more prudent inventory management amid considerable uncertainty over the outlook. It’s also the case that they ran up inventories to sales ratios to be quite high, mostly outside of retail (chart 6). Uncertainty lies in how much of this increase was desired due to serial supply chain shocks over the years, versus a bit of an economic whoopsie.
What it leaves us with is that we may have in place the machinations for a solid rebound in the economy in monthly GDP gauges to end the year and transition to the start of 2024 in such fashion as to bake in a good running head start to Q1 GDP growth.
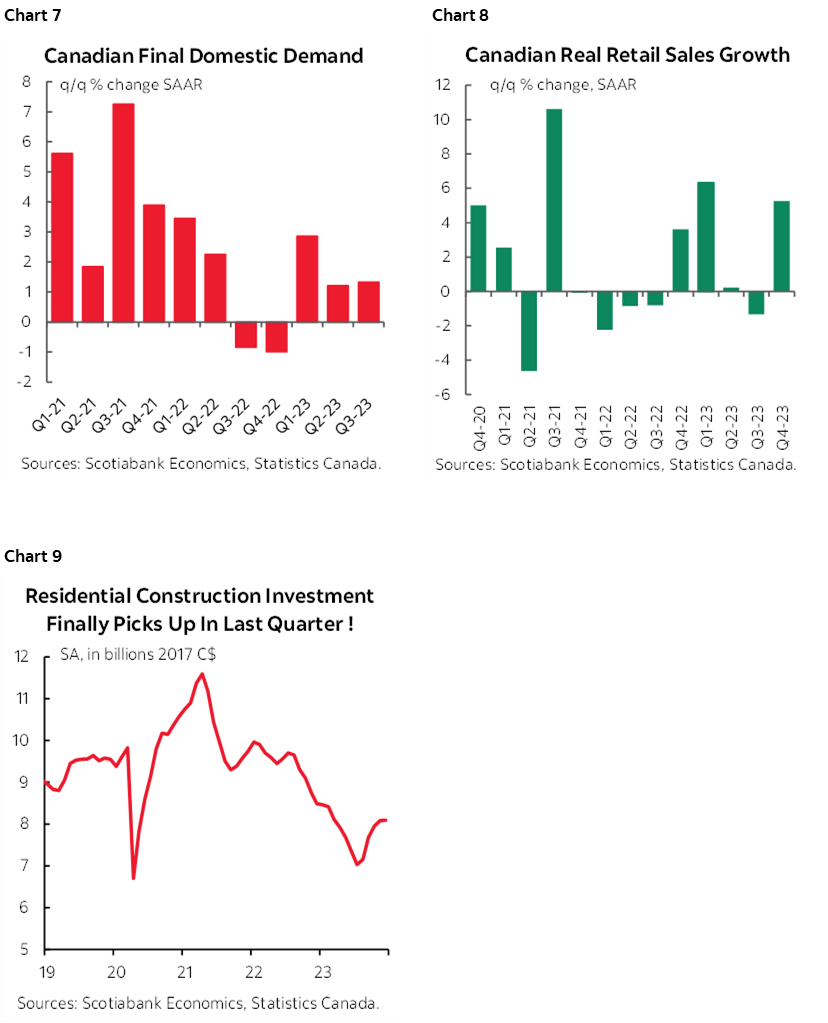
I’ve long argued that the economy is not as weak as it has appeared to be through casual glances at the GDP headline numbers. Last year’s wildfires, unusually timed maintenance and upgrades at mines and in the energy patch’s upgraders, striking workers and inventory shedding have wreaked havoc with the numbers. Final domestic demand—that excludes net trade and inventory swings to focus more upon the domestic economy—has been stronger than GDP and we think it continued to grow in Q4 (chart 7). One consideration in this regard is evidence on the consumer as retail sales volumes soared by 5% q/q SAAR in Q4 (chart 8). Ditto for residential construction (chart 9).
This matters to the Bank of Canada. By Springtime, the case against market pricing for easing in April or June and in favour of marginal pricing for hikes may intensify. That would happen if the economy posts firmer growth in Q1, if the Spring housing market turns out to be as strong as I think it will be, and if governments follow the BC provincial government’s path toward more fiscal pump priming in the overall Budget season. Again, this is highly conditional, but should the reasonable narrative around this scenario pan out, then keep on paying on in terms of the April and June meeting pricing and very plausibly later.
INFLATION UPDATES TO INFORM THE WAITING GAMES
Key measures of inflation could advance the dialogue around the future policy paths for the Federal Reserve, ECB and Bank of Japan.
US Core PCE Could Align with Core CPI
The Federal Reserve’s favoured inflation gauge will be updated for the month of January on Thursday. I’ve upped my initial estimate to 0.4% m/m SA for headline and core compared to what I initially thought after the hotter than expected CPI readings earlier this month (here). Core PCE has been trending beneath core CPI for some time now, but there are at least a couple of possible reasons to think that could change this time.
One reason is that Federal Reserve economists estimated 0.4% gains as disclosed in this speech by Vice Chair Jefferson. While they have a rich team of economists and access to a great deal of information, we clearly can’t just leave it at that.
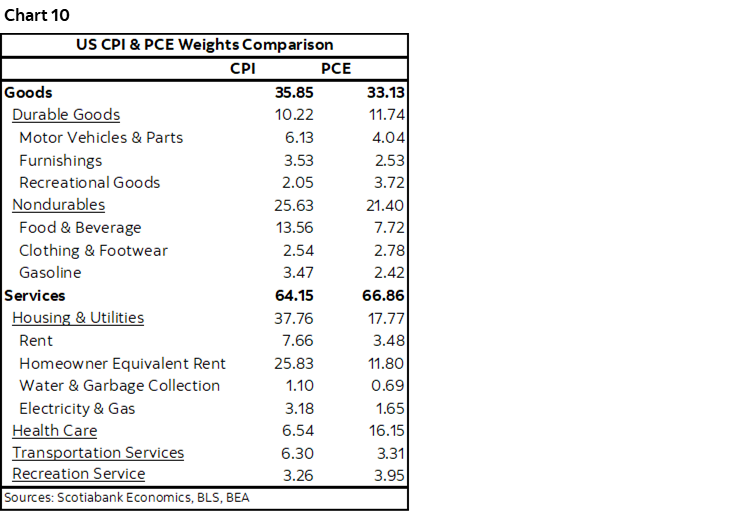
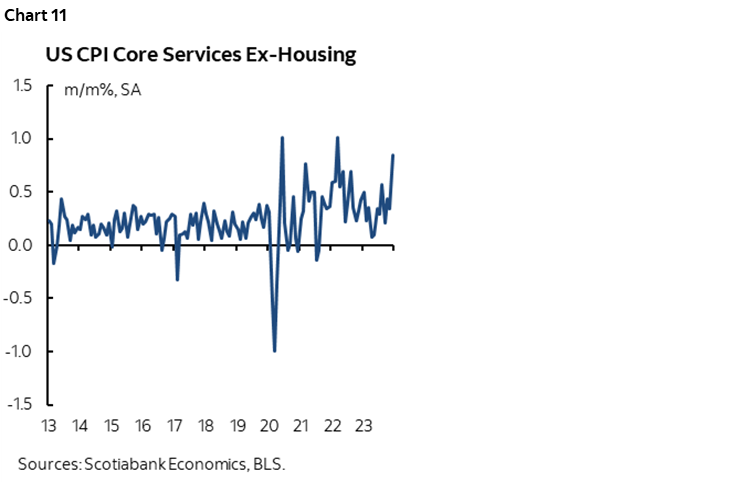
A second reason is that PCE carries different weights than CPI as shown in chart 10. For instance, PCE assigns a higher weight on core services inflation which was one of the hottest parts of the CPI report (chart 11).
I think there could well be a bit of sticker shock to markets if 0.4% core PCE is indeed delivered instead of a continuation of the prior pattern of PCE undershooting CPI. The forward looking debate will then revert back to whether it was a one-off, or a bigger warning shot. Either way, expect Fed officials to continue with their pleas for more time and more data.
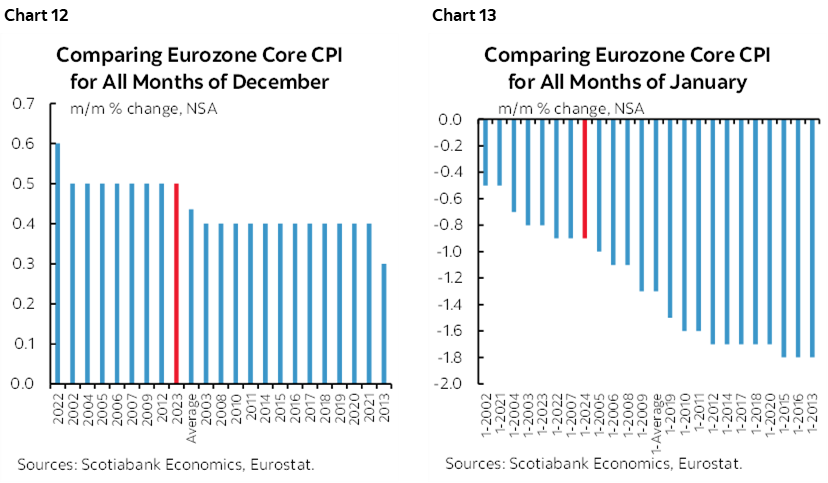
Eurozone CPI—A Flash or a Trend, With Wages on the Radar
Was January just a flash in the pan? How about December? By that I mean whether the hotter than seasonally normal m/m rise in core CPI during each of December and January was temporary or the beginning of a new round of upside pressure (charts 12, 13). February’s reading on Friday is expected to post a headline rise of 0.6% m/m NSA which would be within seasonal norms. Key, however, will be the core reading in the context of the prior couple of months. Germany, France and Spain release the day before and Italy releases on the same day as the Eurozone tally.
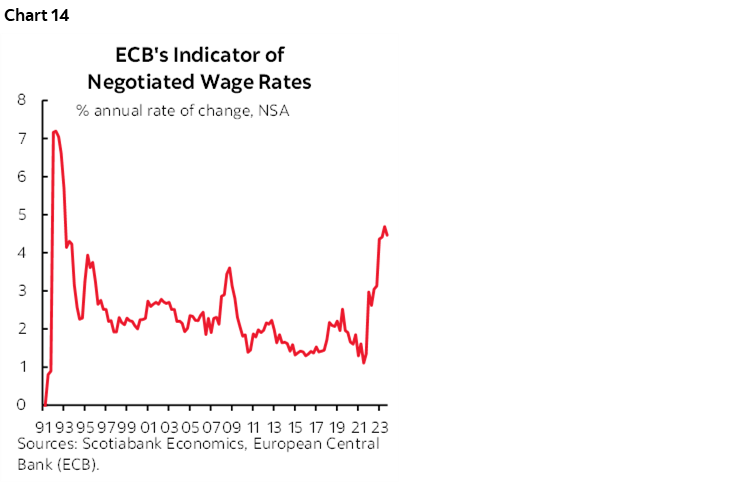
Nothing much hangs on this inflation reading other than implications for short-term moves in financial markets. ECB officials are generally making it clear that they are likely to wait until they have more evidence by the June meeting on both inflation and critically important wage readings.
ECB President Lagarde recently observed that the tiny deceleration in negotiated wages (chart 14) was “obviously encouraging”, but then noted that they need to see Q1 numbers that we won’t get until at least late May or by the June 6th meeting. She did so by noting “There are many sectors and employees that are covered by negotiations that will be completed in the course of the first quarter of 2024 and I think that those numbers will—especially if they continue to be encouraging—will be important for us to assess going forward in order to reach confidence.”
On that note, what she had in mind was an ECB paper (here) that was released a week ago. It delivered a new indicator that uses data from individual pay agreements across several Eurozone economies to estimate wage growth. It offered several observations collected with my colleague Jay Parmar:
- The new wage tracker showed growth in compensation was seen hitting a peak at around 5% early this year;
- The paper observed that "Negotiations over the first quarter of 2024 are likely to be decisive for the development of wage pressures over 2024."
- “Forward-looking wage trackers albeit based on limited data, so far show no clear signs of a broad-based slowdown in negotiated wage growth in the near term.”
- And that the Latest collective-bargaining agreements through end-2023 “do not show a clear indication of a turning point for negotiated wage growth yet and the long average contract duration in some countries could potentially lead to quite some persistence of the current high wage growth rates in the future.”
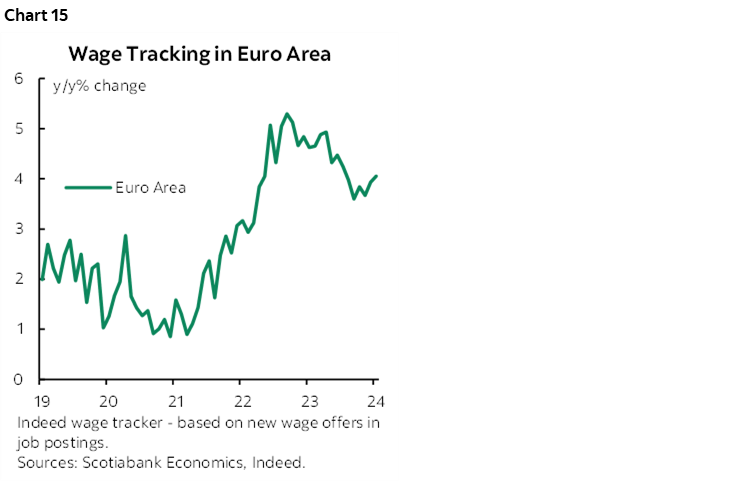
There are other readings for wage growth worth monitoring in the meantime. Chart 15 shows the Indeed wage tracker that appears to have recently stabilized at a relatively elevated level. Still, it only tracks wages for new job postings—not wage settlements for existing workers or overall wages for all workers.
Japan—Be Careful, BoJ
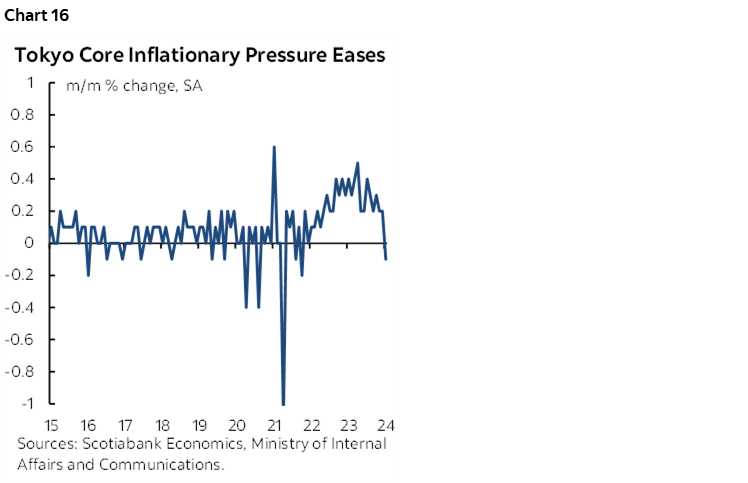
Japan’s national CPI reading for January arrives on Monday. It may continue to caution the Bank of Japan against ending negative rates any time soon. The already released Tokyo core CPI reading for the same month continued to trend lower (chart 16).
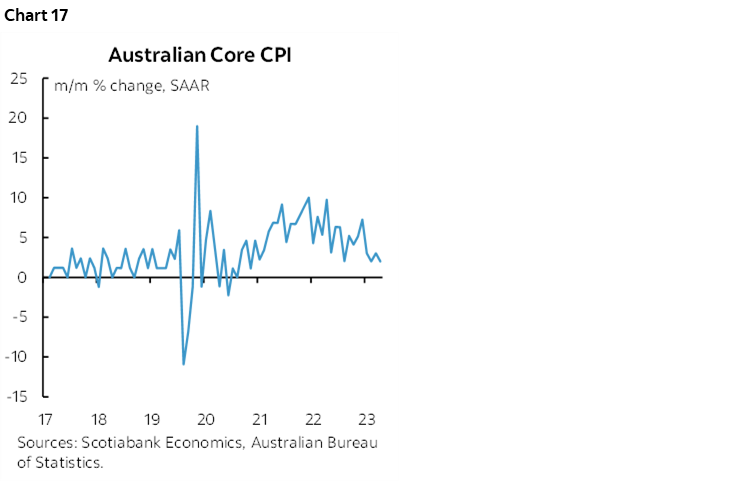
Other inflation updates will arrive in Australia (Tuesday) that has seen cooling pressure (chart 17), Peru (Friday) where a sharp cooling has already been prompting monetary easing, Indonesia (Thursday), and maybe Thailand.
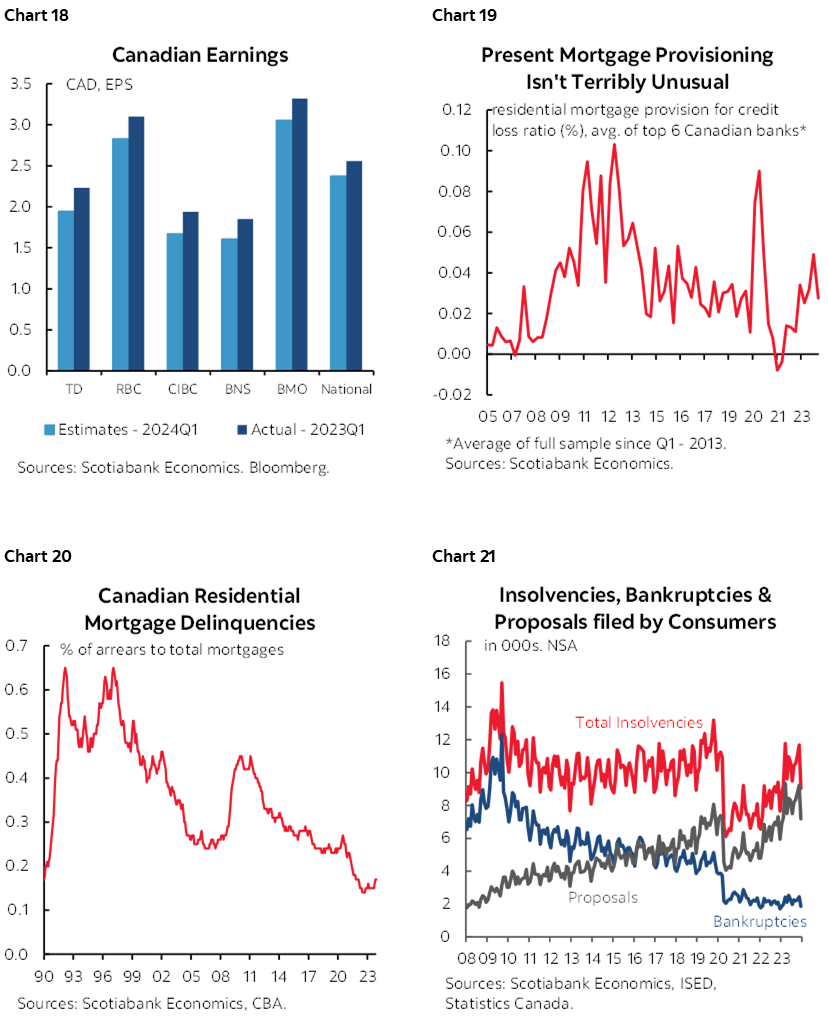
CANADIAN BANK EARNINGS—RESILIENT MORTGAGES
Forty-six TSX-listed firms will release earnings reports this week, but a handful of reports by banks will be the standout given their 20% weight on the TSX and influence in credit markets.
My employer, the Bank of Nova Scotia, kicks it all off on Tuesday with the first glimpse at fiscal 2024 via Q1 earnings for the quarter ending on January 31st. BMO is also out that same day, followed by RBC and National on Wednesday, and then CIBC, TD and Laurentian on Thursday followed by Canadian Western Bank on Friday.
Analysts’ expectations for EPS are shown in chart 18 in comparison to the same fiscal quarter last year. Given how topical it is, charts 19, 20 and 21 should be considered as reflections of the ongoing ability to manage through the consequences of higher borrowing costs on the mortgage book.
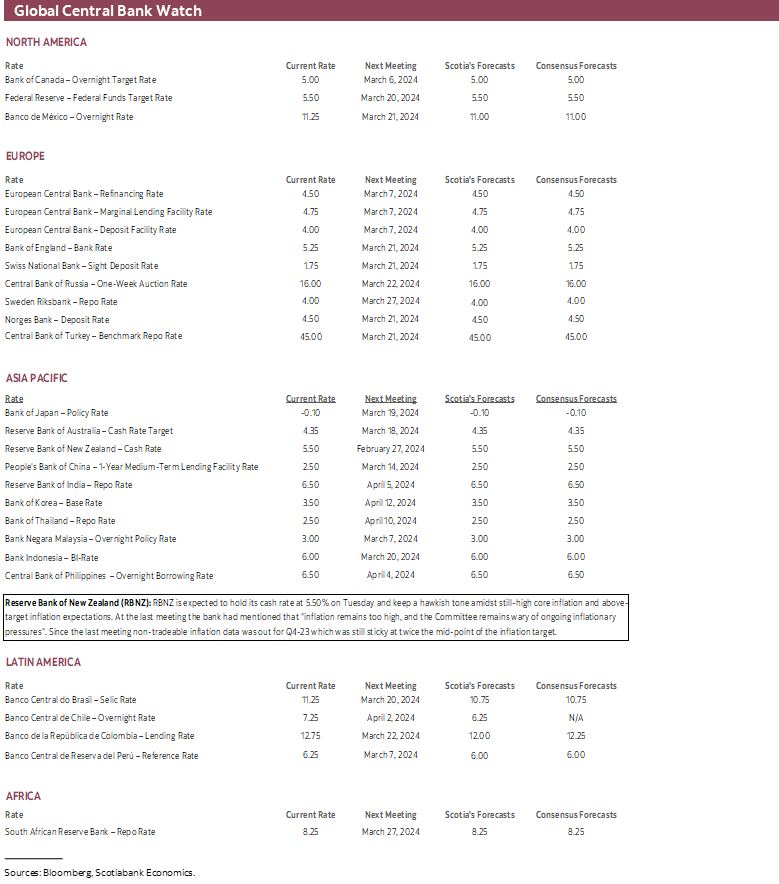
CENTRAL BANKS—THE RBNZ GETS ITS FOCUS BACK
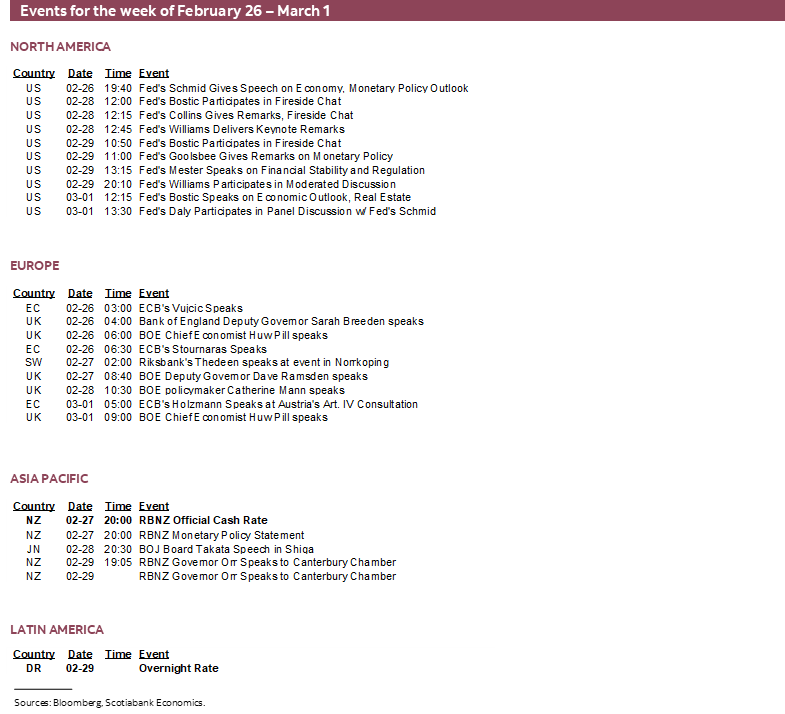
Only one central bank will deliver a policy decision this week that will otherwise include a wave of speaking events held by officials across a number of global central banks.
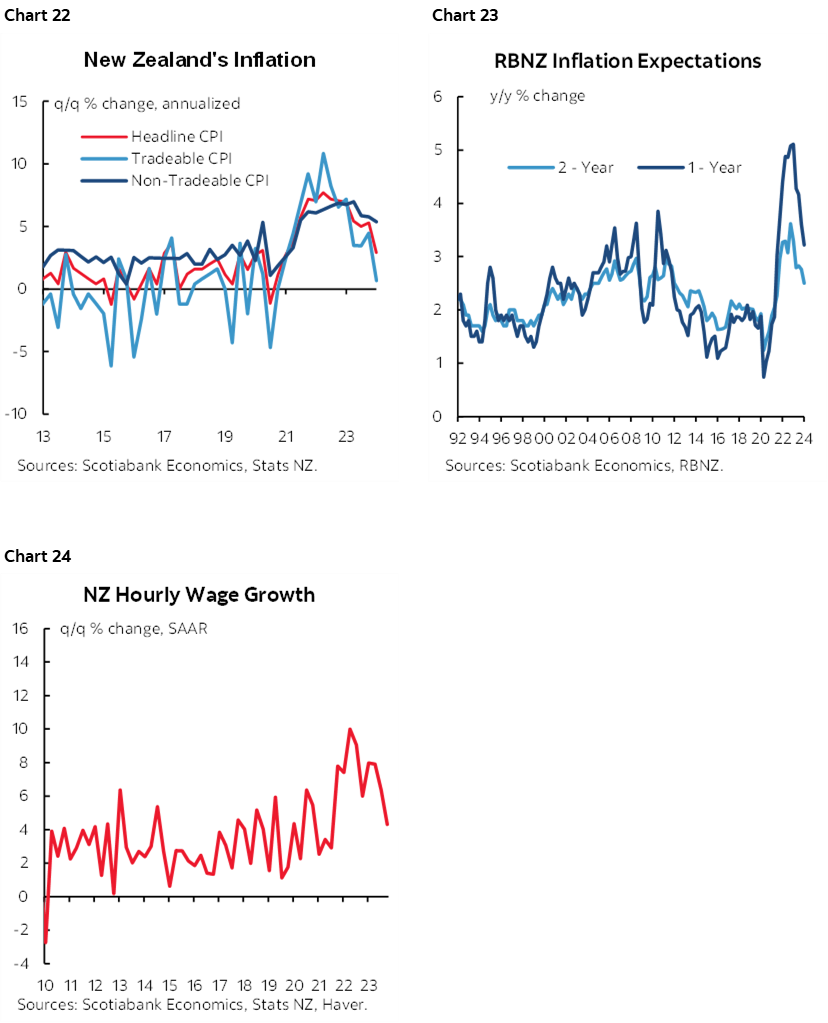
The RBNZ is expected to hold its official cash rate at 5.5% on Tuesday evening (ET). A tiny minority thinks they may have another hike up their sleeves, but markets are only pricing a roughly one-in-four chance at a hike that would be the first one since last May. The partial pricing of a hike at present could give way to market effects whether they hike or hold.
There may be a stronger case for a hold as they refresh forecasts. All-in inflation has ebbed, although this is mostly because of tradeables whereas the non-tradeable component of CPI has held at relatively sticky rates (chart 22). Inflation expectations have pulled back, but remain above the 2% inflation target (chart 23). Wage growth has been very noisy and the RBNZ may opt to wait for more evidence (chart 24).
Should the RBNZ elect to hold, then the bias is likely to remain hawkish and continue to lean against easing any time soon. It has been freed from the ill-advised political tinkering when the former government foisted a dual inflation and jobs mandate onto one of the most respected central banks anywhere that was among the earliest adopters of inflation targeting. The recent election resulted in the coalition government of PM Luxon reverting back to the original mandate.
Here here. We should all be worried greatly about the risk of political tinkering in an environment of still high inflation. As previously written, we should watch for the risk of tinkering elsewhere in the years ahead, including Canada that faces an election next year, the need for another 5-year central bank mandate the year after, and the expiration of Governor Macklem’s current term in 2027.
GLOBAL MACRO—A US DATA DUMP
A lot of other global readings will be mixed in and around another couple of US primaries in South Carolina (Saturday) and Michigan (Tuesday) this week and that probably won’t be pretty contests.
While PCE will be the main US reading on tap for the week, there will be many others that fall in the second and third tiers of macro readings. New home sales should rise given evidence from model home foot traffic (Monday). Durable goods orders probably fell on weaker aircraft orders, but watch core orders ex-defence and air (Tuesday). Consumer confidence might get a bit of a lift given influences from jobs, wages and equities (Tuesday). Repeat sale house prices are expected to post a gain (Tuesday). Personal income is expected to post a sizeable gain but consumer spending for the same month of January could be soft given evidence from retail sales (Thursday). Wednesday’s Q4 GDP revisions are expected to be minor to the 3.3% prior estimate. Friday’s ISM-manufacturing gauge could get a lift from improvements in some regional manufacturing surveys. Friday’s vehicle sales for February are expected to rebound based on industry guidance.
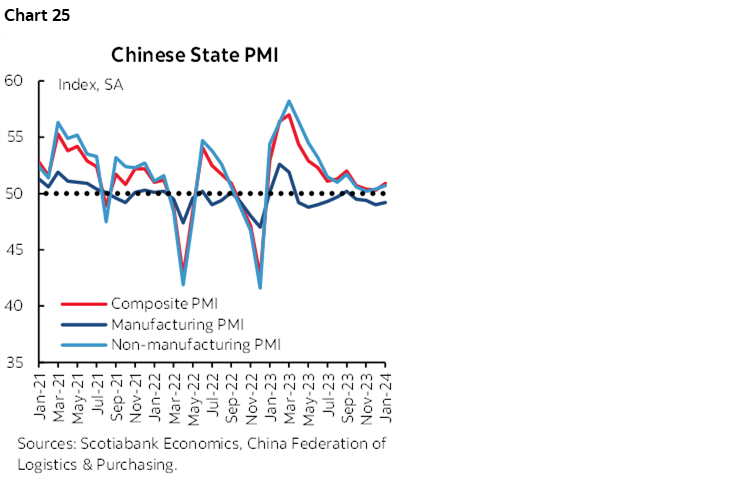
China will update the state’s purchasing managers’ indices for February on Wednesday. The composite reading has been signalling low growth at a slightly expansion above-50 reading to date (chart 25).
LatAm markets will consider what will probably be very little if any growth in Brazil’s economy during Q4 (Friday). The week’s other releases will include GDP from India and Sweden (Thursday) as well as a data dump from Japan on Thursday that covers retail sales, industrial output, the jobless rate and housing starts. Last, Germany might update retail sales either this week or next and so will Australia by mid-week.

DISCLAIMER
This report has been prepared by Scotiabank Economics as a resource for the clients of Scotiabank. Opinions, estimates and projections contained herein are our own as of the date hereof and are subject to change without notice. The information and opinions contained herein have been compiled or arrived at from sources believed reliable but no representation or warranty, express or implied, is made as to their accuracy or completeness. Neither Scotiabank nor any of its officers, directors, partners, employees or affiliates accepts any liability whatsoever for any direct or consequential loss arising from any use of this report or its contents.
These reports are provided to you for informational purposes only. This report is not, and is not constructed as, an offer to sell or solicitation of any offer to buy any financial instrument, nor shall this report be construed as an opinion as to whether you should enter into any swap or trading strategy involving a swap or any other transaction. The information contained in this report is not intended to be, and does not constitute, a recommendation of a swap or trading strategy involving a swap within the meaning of U.S. Commodity Futures Trading Commission Regulation 23.434 and Appendix A thereto. This material is not intended to be individually tailored to your needs or characteristics and should not be viewed as a “call to action” or suggestion that you enter into a swap or trading strategy involving a swap or any other transaction. Scotiabank may engage in transactions in a manner inconsistent with the views discussed this report and may have positions, or be in the process of acquiring or disposing of positions, referred to in this report.
Scotiabank, its affiliates and any of their respective officers, directors and employees may from time to time take positions in currencies, act as managers, co-managers or underwriters of a public offering or act as principals or agents, deal in, own or act as market makers or advisors, brokers or commercial and/or investment bankers in relation to securities or related derivatives. As a result of these actions, Scotiabank may receive remuneration. All Scotiabank products and services are subject to the terms of applicable agreements and local regulations. Officers, directors and employees of Scotiabank and its affiliates may serve as directors of corporations.
Any securities discussed in this report may not be suitable for all investors. Scotiabank recommends that investors independently evaluate any issuer and security discussed in this report, and consult with any advisors they deem necessary prior to making any investment.
This report and all information, opinions and conclusions contained in it are protected by copyright. This information may not be reproduced without the prior express written consent of Scotiabank.
™ Trademark of The Bank of Nova Scotia. Used under license, where applicable.
Scotiabank, together with “Global Banking and Markets”, is a marketing name for the global corporate and investment banking and capital markets businesses of The Bank of Nova Scotia and certain of its affiliates in the countries where they operate, including; Scotiabank Europe plc; Scotiabank (Ireland) Designated Activity Company; Scotiabank Inverlat S.A., Institución de Banca Múltiple, Grupo Financiero Scotiabank Inverlat, Scotia Inverlat Casa de Bolsa, S.A. de C.V., Grupo Financiero Scotiabank Inverlat, Scotia Inverlat Derivados S.A. de C.V. – all members of the Scotiabank group and authorized users of the Scotiabank mark. The Bank of Nova Scotia is incorporated in Canada with limited liability and is authorised and regulated by the Office of the Superintendent of Financial Institutions Canada. The Bank of Nova Scotia is authorized by the UK Prudential Regulation Authority and is subject to regulation by the UK Financial Conduct Authority and limited regulation by the UK Prudential Regulation Authority. Details about the extent of The Bank of Nova Scotia's regulation by the UK Prudential Regulation Authority are available from us on request. Scotiabank Europe plc is authorized by the UK Prudential Regulation Authority and regulated by the UK Financial Conduct Authority and the UK Prudential Regulation Authority.
Scotiabank Inverlat, S.A., Scotia Inverlat Casa de Bolsa, S.A. de C.V, Grupo Financiero Scotiabank Inverlat, and Scotia Inverlat Derivados, S.A. de C.V., are each authorized and regulated by the Mexican financial authorities.
Not all products and services are offered in all jurisdictions. Services described are available in jurisdictions where permitted by law.