Next Week's Risk Dashboard
- Powell may come to regret his reversal on GDP growth
- Powell’s CBS interview will be stale on arrival
- The Fed and elections
- Fed’s survey to inform credit tightening
- US CPI revisions could be impactful
- Canada’s job market could rebound
- Canada faces years of strong wage growth
- Canada’s housing market is flashing red again
- BoC’s measures address CORRA and may offer further hints
- BoC’s Macklem to speak on how he has a tough job
- BoC’s survey to inform mixture of credit tightening and easing
- Will ECB inflation expectations show further progress?
- Banxico to stay on hold
- Peru’s central bank to extend gradual pace of cuts
- RBA lean against cuts, keep an eye on wages
- Will the RBI sound more neutral?
- BoT will likely reaffirm neutrality
- NZ jobs and wages to inform RBNZ’s next step
- CPI: Updates across LatAm, Asia-Pacific
- Minor US primaries/caucuses this week
- US, Canadian earnings seasons continue
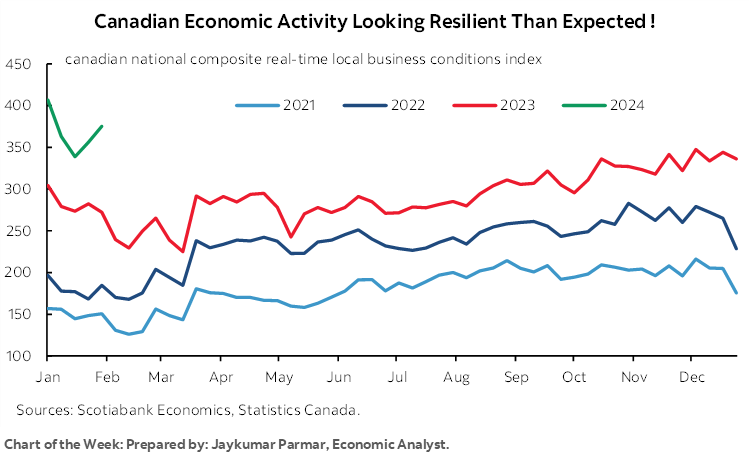
Chart of the Week
“Evidence of growth persistently above potential or that labour markets are not coming into balance could warrant further tightening.”
—Federal Reserve Chair Jay Powell, November 1st 2023
Fed Chair Powell should have stood by this remark that was delivered during the press conference following November’s FOMC communications when he spoke this past week. Instead, he opted not to do so and is likely regretting that by now.
You won’t hear a hint of this regret when he features in a CBS interview on Sunday at 7pmET. He’ll sound like a guy who is totally unaware of what just happened because, well, he wasn’t when he perhaps unwisely agreed to tape the interview this past Thursday. Talk about stale on arrival in a #outreach fail by his communications staff. Powell risks sounding like the person who walks into the office on Monday morning after the Super Bowl and asks ‘so, who won’?
Recall that US job growth and wage gains smashed expectations including positive revisions (recap here). Q1 US GDP growth is now tracking at over 4% according to the Atlanta Fed’s ‘nowcast’ that has been performing much better of late after prior struggles particularly with services tracking; an update is due on Wednesday. This is putting consensus on track toward the dubious achievement of grossly underestimating US GDP growth for a seventh consecutive quarter.
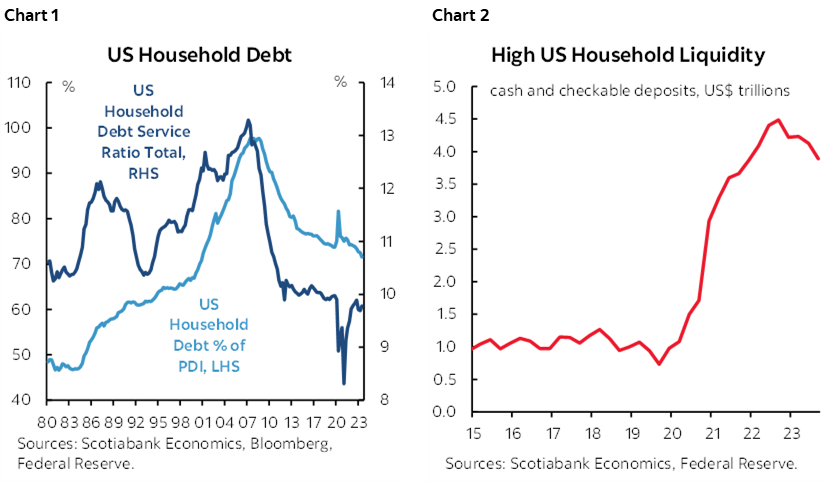
Clearly there is something unique about the US economy today compared to past rate hike cycles given that we’re pushing about two-and-a-half years into a bond market tightening cycle that began before the Fed’s first hike in March 2022. I think that the healthiest US household finances in decades feature prominently on the list of explanations. A 23-year low in debt-to-income, record low debt payments as a share of incomes, and still very high cash balances help to understand this picture (charts 1, 2).
When Powell spoke during his press conference this past week, however, he sounded like someone who had done a total 180’ turn compared to November. When asked how he is weighing strong growth against inflation data, he said:
“On growth, we've had strong growth and yet cooling job growth and cooling inflation. We don't look at strong growth as a problem. We're looking for inflation to continue coming down as it has for the past six months.”
That’s odd, he said in November that strong growth and its connections to the dual mandate could merit further tightening; how could the theory be so malleable in the Chair’s mind? When pushed further, he said:
“The greater risk is that inflation stabilizes at a level above 2% rather than accelerate. We would have to respond if inflation moves back up again and both of those scenarios are risks. You've had six very good months for inflation but are the last six months durable?
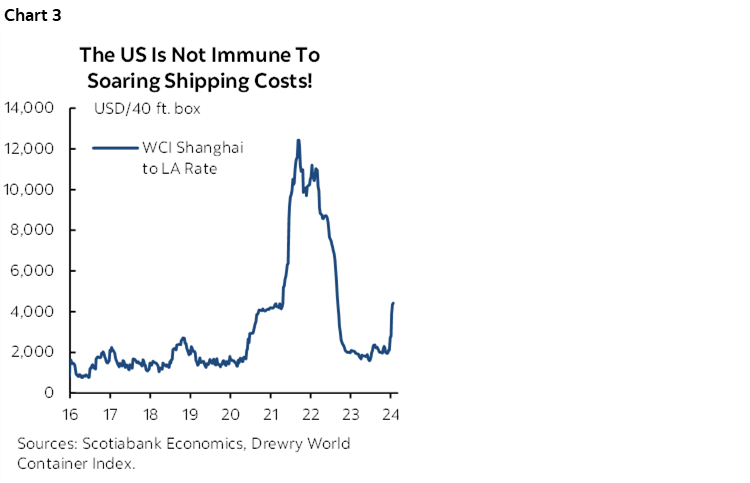
While core PCE has indeed been tracking softly of late, the kind of evidence we are getting on jobs, wages and GDP growth suggests that upside risks to inflation lie ahead alongside the nascent re-emergence of supply chain pressures via container prices (chart 3). That would be more consistent with Powell’s November remark.
On the other side of the Fed’s dual mandate, Powell’s depiction of the labour market was as follows:
“The labour market by many measures is at or nearing normal but not totally back to normal. Job openings, wage increases are not totally back to where they were. The economy is broadly normalizing. Wage setting will take a couple of years to get all of the way back [to pre-pandemic].”
We just got a ripping jobs report with strong upward revisions and wage growth is on an accelerating trend. Job vacancies have also increased.
And finally, on monetary policy, he said:
“Almost every participant on the committee does believe it will be appropriate to reduce rates. What we're trying to do is to identify a place where it will become appropriate to begin easing.”
That guidance is either pushed out and or suffering from lessened confidence on the Committee now. I did like the fact that Powell explicitly pushed back against March rate cut pricing. I’m also partly forgiving of some of his remarks given the data he had on jobs and wages at the time, but not on GDP growth given that preliminary tracking was already pointing toward further upside risk. But where the risk—and less forgiveness—lies is in terms of this Jekyll and Hyde act going back to Powell as we knew him in November versus today.
So where does the Fed go from here? To balance the nonnegligible risks of no easing this year or even renewed tightening, it would seem prudent for the street to push out and lower pricing for Fed rate cuts toward something more closely aligned with the dot plot and its implied timing.
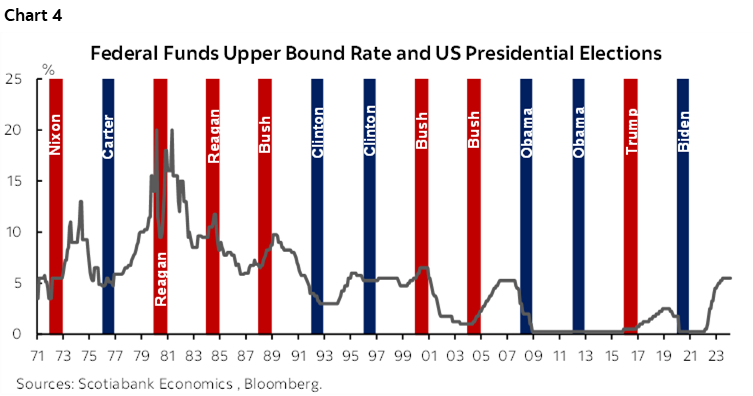
Speaking of November, data and election risk are now on a potential collision course. The Biden administration will cheer the job market and GDP growth, but its crass Fed critics—looking at you Senator Warren—are very likely to ramp up anti-Fed rhetoric on the path forward. Data may not support easing in time to give Biden a boost, but I don’t think the evidence that the Fed can’t cut before a US election because it is politically captive holds much water—if supported by data and developments. The Fed commenced easing cycles just ahead of elections in 1976, 1980, 1984, 1992, 2008 and 2020. It began cutting just after an election only once, in 2001 following the November 2020 election (chart 4).
CANADA’S JOB MARKET—MAKE-UP BEFORE BREAK-UP??
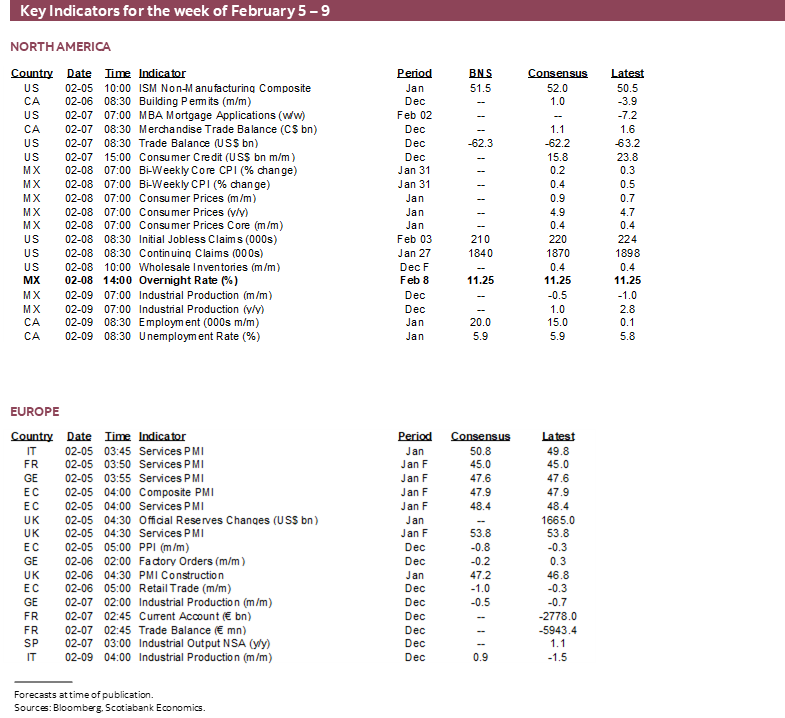
Canada updates wage settlements on Monday, and then jobs, wages, the unemployment rate and other labour force metrics for the month of January on Friday and specifically the reference week of January 14th to 20th. I’ll be most focused upon wages.
If the Bank of Canada truly believes what they are saying when they say that wage growth will slow and all Canada has been doing is booking make-up wage gains in relation to inflation, then good luck ever achieving 2% inflation.
There will also be revisions to job growth over the January 2021 to December 2023 period that reflect annual adjustments to seasonal adjustment factors. They are often small but add an extra element of uncertainty to estimating the hand-off effects into January’s numbers.
Here are expectations:
- I’ve estimated a gain of 20k jobs.
- The unemployment rate is estimated to tick higher to 5.9%.
- I wouldn’t be surprised to see wage growth in the mid- to upper- single digits on a m/m seasonally adjusted basis at an annualized rate.
- Also key may be hours worked. During the December LFS reference week, 162,000 employees in Quebec’s educational sector were on strike. This had the effect of knocking about a tenth of a percent off hours worked which should be added back into the January reference week.
One reason to expect job growth is if self-employed jobs reverse the prior month’s decline. Self-employed fell by 18k which offset a similar rise in payrolls jobs and therefore kept total employment unchanged. That’s one reason why December’s jobs report was not as bad as it appeared. Self-employed is also a highly unreliable category. The standard deviation of monthly changes in self-employed jobs in relation to the mean change is far higher than for total jobs. Payroll jobs are hard to fake. Many self-employed jobs are highly valued in the Canadian economy, but it is a lower data quality category.
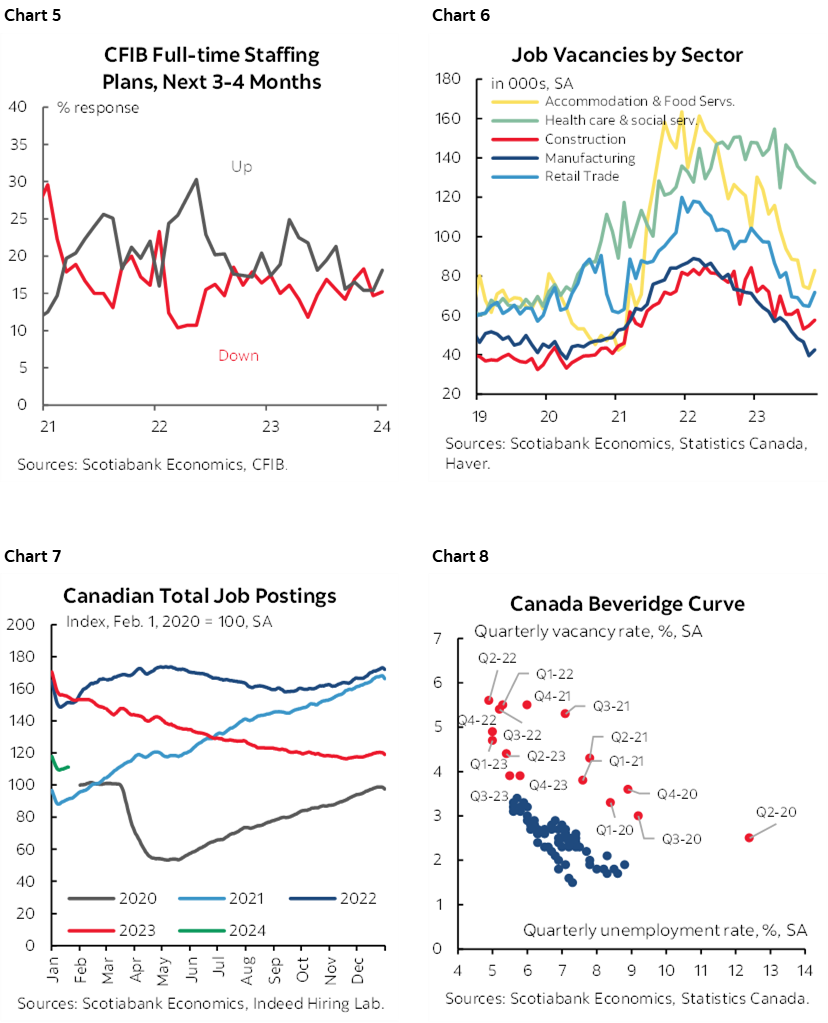
Another reason to expect job growth is that the appetite for hiring increased. We can see this in the CFIB’s plans to hire gauge that edged up in January (chart 5). Lagging aggregate job vacancies up to November edged a touch higher in most industries (chart 6). Job postings are entering the year at lower levels than 2022–23 which indicates slower appetite for new hires at the margin versus unfilled existing jobs (chart 7). And of course immigration continues to drive very rapid population growth which in and of itself fills vacancies and creates opportunities. One way of looking at overall tightness in Canadian job markets is chart 8 that relates the job vacancy rate to the unemployment rate; the latest evidence up to 2024Q4 shows progress from extreme tightness (lots of unfilled jobs, very low UR) toward something that is still tight, just a little less so.
Also watch for a potential gain in hours worked after the country lost more hours worked to striking workers on picket lines than it lost during the depths of pandemic lockdowns (chart 9). Since GDP is hours worked times labour productivity, that could be a hint at a strong gain in January GDP.
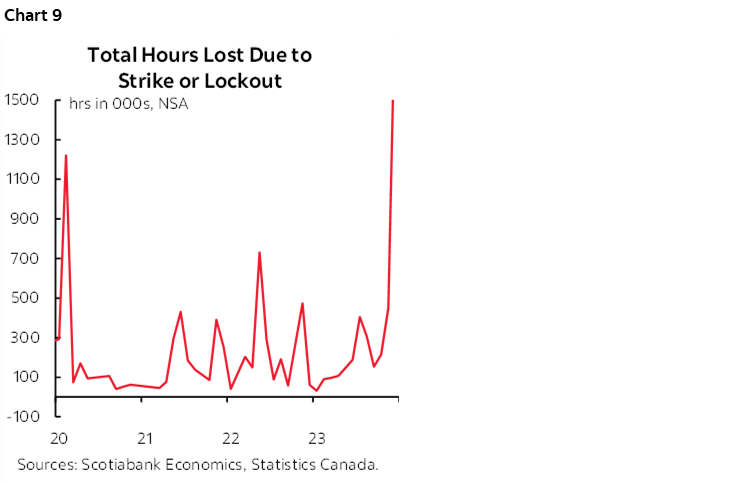
But frankly, within reason, I don’t think the job counts are the prime concern. On Monday, we’ll likely get further evidence that Canadian unionized wage settlements are going absolutely bonkers. The last data for October showed that for the average 43 months of the agreements that were struck that month, the first-year average wage increase was 8.3%, or about four times the BoC’s 2% inflation target (chart 10). The average wage gain over the full duration of the contracts was 5%, or more than about double the BoC’s 2% inflation target. December’s data is likely to shoot higher yet and achieve the highest first-year wage gain in a generation.
While the public sector is the most generous, large settlements are being granted in the private sector as well. Therefore, it’s tough to make the argument that c-suites are managing shareholder money that much more efficiently than bureaucrats are managing the public purse.
It’s also by no means over yet. The BoC has said in the past that it expects wage growth to slow and instead it accelerated. They face the same risk now when they say they expect wage growth to slow and yet there is a massive number of employees falling under expiring collective agreements this year.
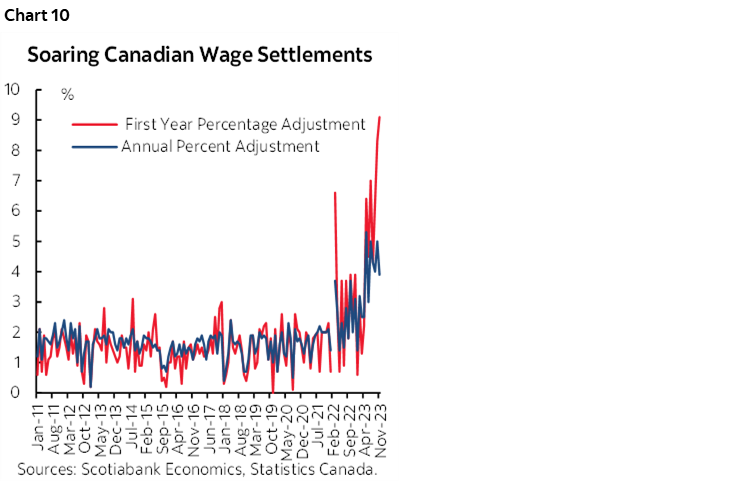
In just Ontario and Alberta, about 600k workers will renegotiate in 2024 followed by another similar number (560k) in 2025. Ontario publishes detailed information on this (here) with 335k employees under 1,925 expiring agreements in 2024 of which 72% are in the public sector. Then another 476k employees under 1,940 agreements expire in 2025. In 2026, another 208k employees will fall under 798 expiring agreements. All totalled, that means over 1 million workers under 4,663 expiring collective agreements will be seeking higher wages and benefits and altered working conditions in Ontario (chart 11). That works out to 13% of employed Ontarians.
Alberta’s information (here) is not as detailed as Ontario’s but it shows that in 2024, a quarter million workers will have to renegotiate their collective agreements and then another 85k in 2025. That works out to about 13% of that province’s employees.
Some examples include 40,000 workers in Ontario’s health care sector, 11k workers at CN Rail, 2,400 at Via Rail, posties, Air Canada pilots and flight attendants, multiple police forces, Manitoba nurses, etc etc.
Care to guess what all of these folks will be demanding in their negotiations? More than what the other guys and gals got before them. It’s like pro sports, where proving one’s negotiating mettle and satisfying one’s ego require bigger deals than the last athletes got.
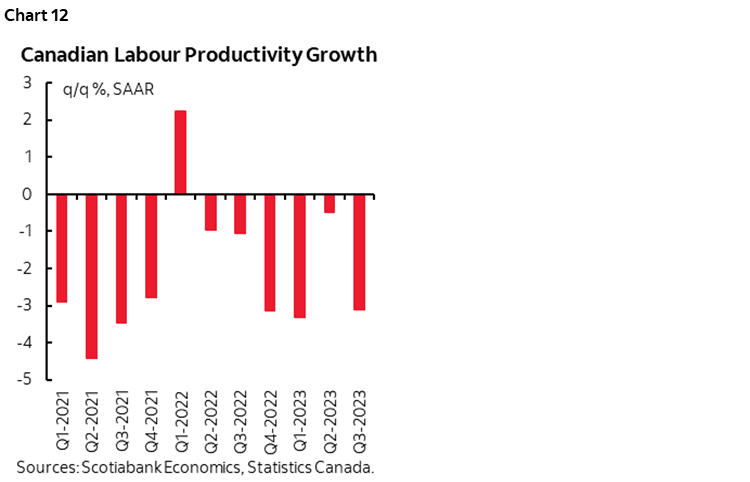
Now most economists would agree that wage gains above the rate of inflation must be supported by productivity gains, defined as growth in the output of goods and services per hour worked. Clearly the opposite is happening, as today’s large multi-year wage gains are going in the opposite direction to tumbling productivity (chart 12).
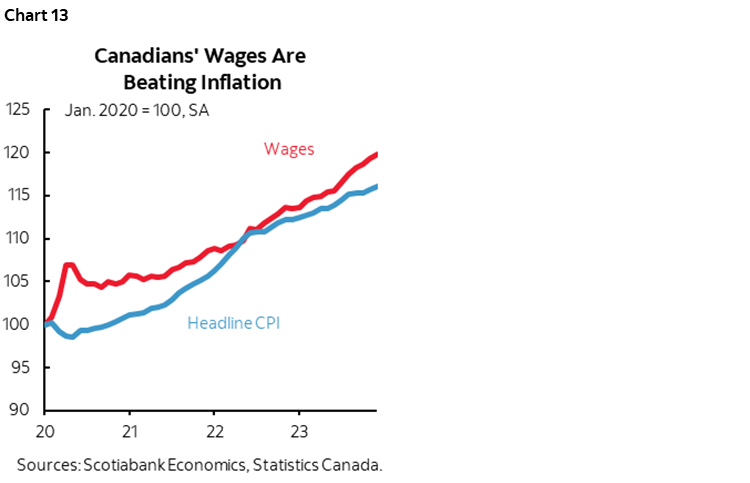
Lastly, despite comments made by BoC SDG Rogers in her part of this past week’s parliamentary committee testimony, these are not make-up wage gains folks. Average hourly wages have been rising faster than headline CPI ever since the start of the pandemic (chart 13). Regardless of what the BoC says, this is showing no signs of letting up any time soon as collective bargaining exercises point to institutionalizing wage gains in excess of the BoC’s 2% inflation target for many years into the future.
Because of these points, I believe that the Bank of Canada remains behind the curve. Inflation expectations are above its 2% target toward the upper end of the 1–3% range amid evidence of a fundamental change in behaviour in the job market. That’s not a comfortable place for a central bank to find itself and the country’s politicians need to understand this. Either tighter for longer will be required, and/or higher for longer inflation will be the outcome.
CENTRAL BANKS—PERU TO BE AN OUTLIER
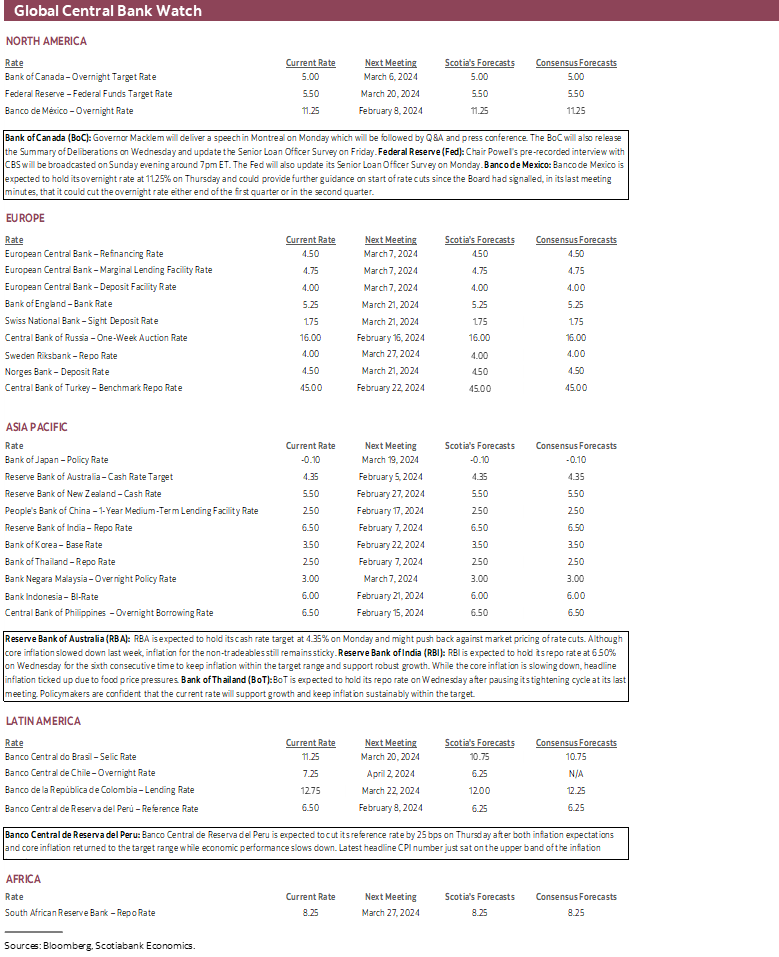
Several central banks will deliver decisions including two in Latin America and three across Asia-Pacific markets. Also watch developments at the Fed and Bank of Canada even though their latest policy decisions are out of the way.
Bank of Canada—Solutions and More Questions
After taking steps to address funding market pressures, the BoC will deliver further communications over the coming week.
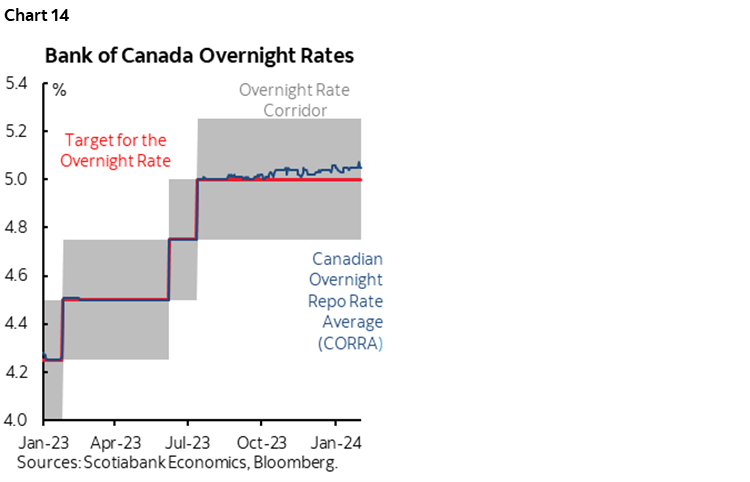
The steps taken this past week (here) are probably designed to address funding market pressures as indicated by the positive spread between the Canadian Overnight Repo Rate Average and the BoC’s overnight rate (chart 14). Over time this action may compress the spread. It may also be a move designed to address building funding pressures amid signs that mortgage funding requirements are set to intensify given preliminary signals from housing markets. It could indirectly serve as a signal that they are more hawkishly inclined than markets are pricing. Doubling down on QT while relying upon a complex patchwork of funding tools like repo injections and this latest step could be an implicit signal they are nowhere close to easing—if not inclined to tighten further.
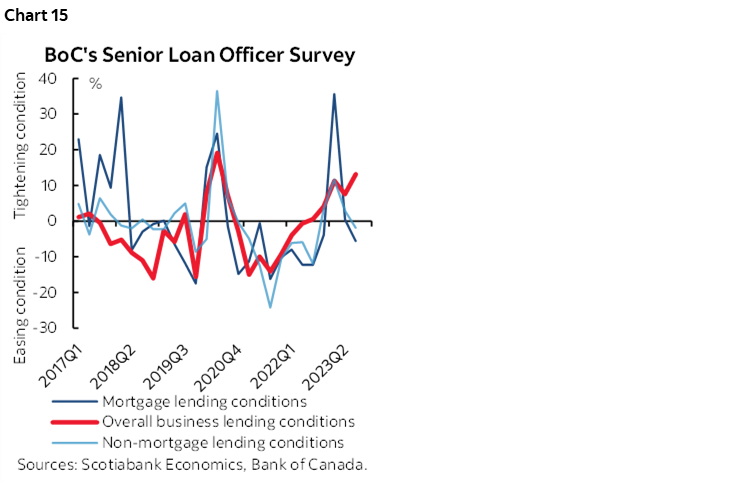
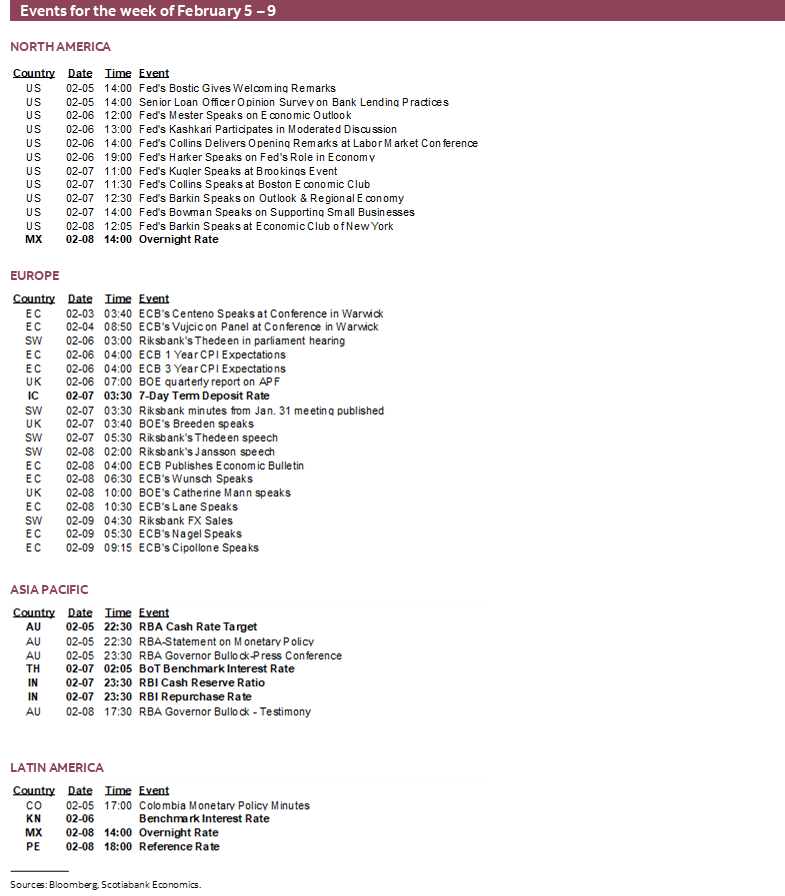
Governor Macklem will deliver a speech titled “The Effectiveness and the Limitations of Monetary Policy” in Montreal on Tuesday. There will be audience Q&A and a press conference afterward. The BoC releases the Summary of Deliberations behind its recent decisions the next day. On Friday, the BoC updates the Senior Loan Officer Survey that has been showing tightening business lending conditions but easing mortgage lending conditions up to now (chart 15).
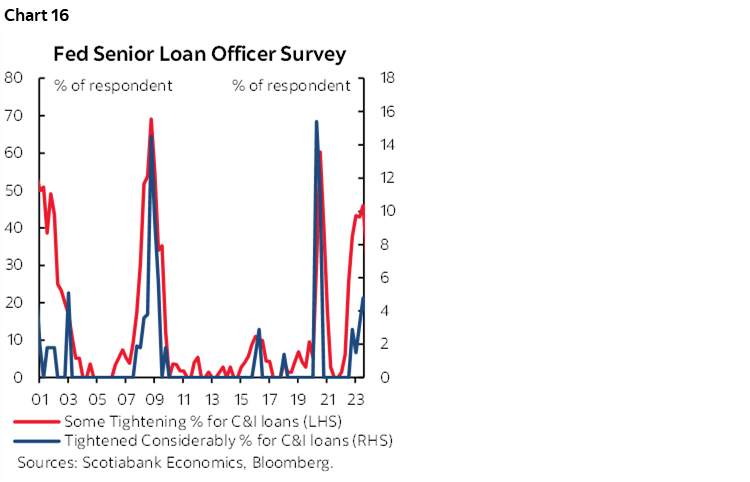
Federal Reserve—Evaluating Credit Tightening
As noted above, Chair Powell’s CBS interview on Sunday evening at 7pmET is probably best treated as a stale assessment because it was pre-recorded before incredibly strong figures on job creation and wage pressures.
The Federal Reserve will also update its Senior Loan Officer Survey on Monday. Like the Canadian measure, this will help to further inform the incremental tightening of lending conditions (chart 16) that must also be taken in the same context as easing financial market conditions relative to prior months.
Banxico—Domestic and External Reasons to Remain on Hold
No change is expected to the overnight rate set by Mexico’s central bank on Thursday. It is widely expected to remain at 11.25%. Minutes to the December meeting, however, indicated that it may be open to a cut toward the end of Q1 or Q2. That may be stale now after Fed Chair Powell explicitly ruled out a cut in March and sounded in no rush to ease. Furthermore, our Mexican economics team notes that ongoing upside risks in Mexican inflation, procyclical fiscal policy economic activity that has gained momentum and persistent core inflation pressures combine to add reasons to remain on hold.
BCRP—Steady Cuts
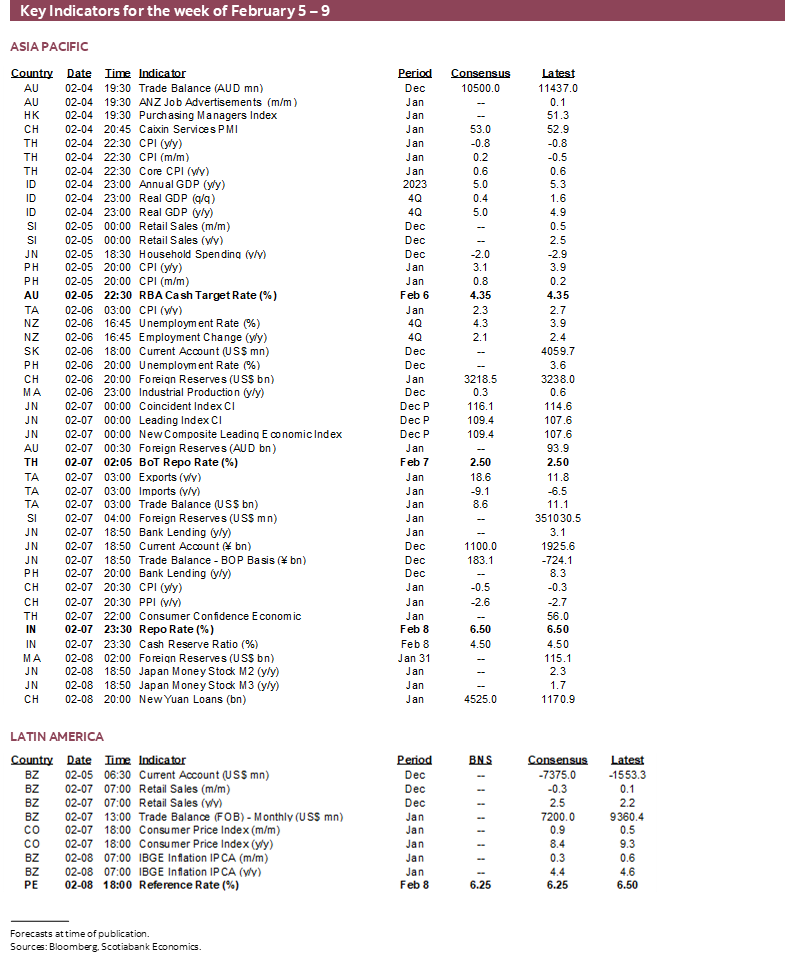
Peru’s central bank is widely expected to cut its reference rate by another 25bps to 6.25% on Thursday. That would result in a cumulative 150bps of easing since cuts began in September. President Velarde has remarked that “Inflation is close to the target range, and we expect it to be within that target in the next two months.” While 1-year ahead inflation expectations seem to be well anchored at 2.8%.
RBA—Not Yet!
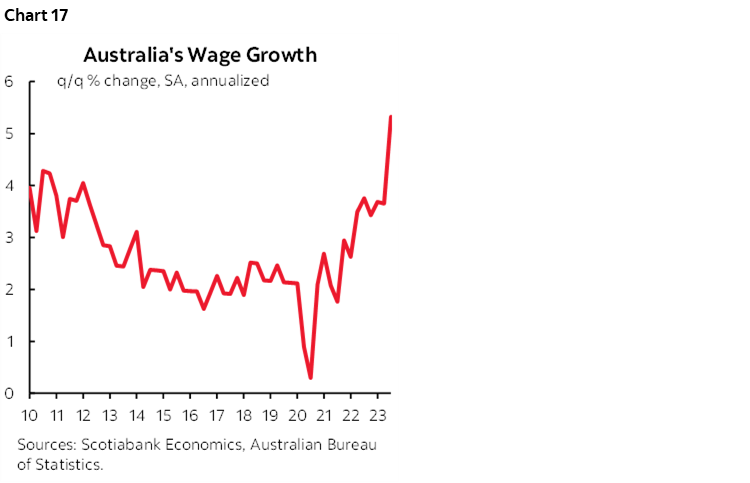
The cash rate target is expected to remain unchanged at 4.35% on Tuesday. The RBA is expected to caution against premature easing in relation to markets that are pricing part of a quarter point rate cut by the May 7th meeting. Expect the RBA to flag modest progress on underlying inflation but to still indicate that readings over 4% y/y for weighted median and trimmed mean CPI remain too hot in relation to the 2–3% headline inflation target. They are also likely to want to see what happens to wage growth when Q4 figures land on February 20th in the context of the sharply accelerating trend (chart 17).
RBI—A Little Less Hawkish?
The Reserve Bank of India (Thursday) is widely expected to leave its repurchase rate at 6.5%. After warning about inflation in December, the RBI may sound relatively more neutral. Core inflation has continued to decelerate to under 4% y/y which remains above the headline target range of 1–3% but is headed in the right direction. The Indian government’s interim budget sought to rein in the fiscal deficit.
BoT—Neutral
The Bank of Thailand is widely expected to remain on hold at a benchmark policy rate of 2.5% on Wednesday. The central bank views its stance as relatively neutral and expects inflation to rise going forward from the current weakness.
GLOBAL MACRO
The rest of the global macro line-up will be relatively light as the US earnings season and election calendar keep ticking.
Democratic primaries will be held in South Carolina on Saturday and Nevada on Tuesday. Republican caucuses will be held in Nevada and the Virgin Islands on Thursday. These are biding time until Super Tuesday.
Another 100 S&P500 firms will release earnings over the coming week. Canada’s earnings season brings out 27 TSX-listed firms including Magna International, Bombardier, Thomson Reuters, Sun Life, BCE and many others.
Canada will mostly focus upon the aforementioned reports on jobs and wages. Additional emphasis will be placed upon Quebec’s (Monday) and Toronto’s (Tuesday existing home sales figures for January after Vancouver (here) and Calgary (here) reported strong months. Canada also updates trade figures for December to help inform GDP tracking on Wednesday.
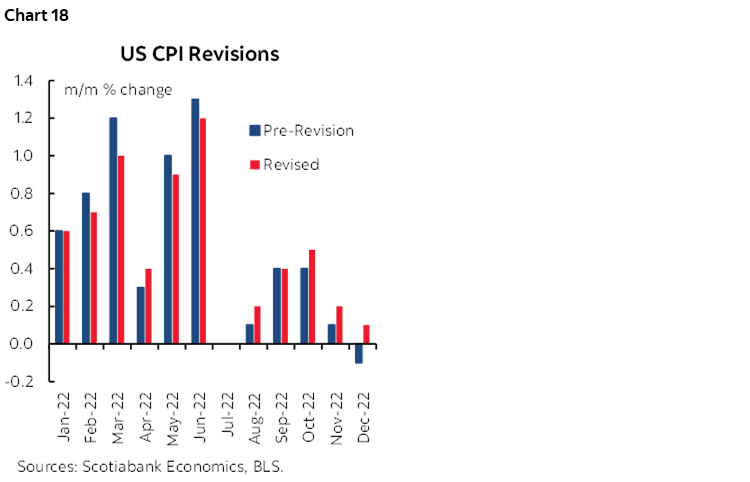
The US faces a relatively light macro line-up. The show stealer could be annual US CPI revisions on Friday. Recall that when they landed last year on February 10th it resulted in upward revisions including to the recent readings at the time (chart 18). That drove higher Treasury yields in the aftermath. The purpose to the revisions is to recalculate seasonal adjustments over the prior five years from 2019 to 2023. The US also releases ISM-services for January on Monday, trade figures for December on Wednesday, and weekly claims on Thursday.
Several Latin American and Asia-Pacific countries will release CPI updates for January over the course of the week. Thailand kicks it off on Sunday, followed by Philippines on Monday, Taiwan on Tuesday, China and Colombia Wednesday, Mexico and Chile on Thursday and then Brazil and Norway on Friday.
Brief highlights of other macro data are as follows and I’ll write more about other readings over the course of the week:
Ahead of the RBNZ decision on February 28th will come Q4 jobs and wages this Tuesday.
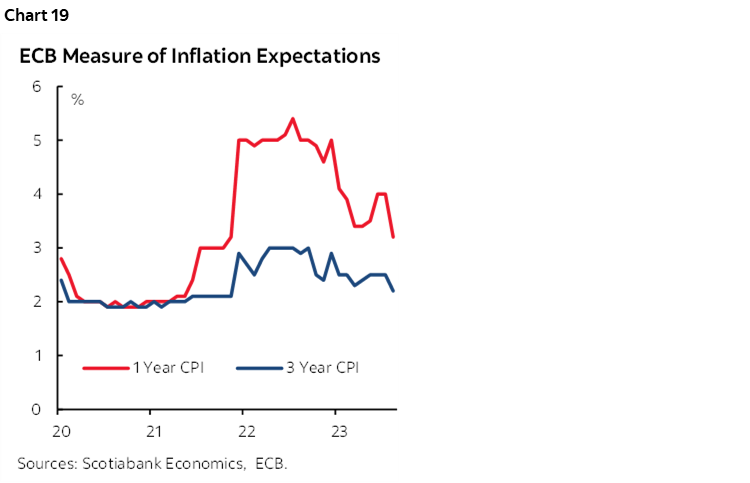
The ECB’s survey-based 1- and 3-yr inflation expectations in December arrives Tuesday. They will be monitored for signs of further progress (chart 19) even as core CPI has been relatively firm of late and wage pressures persist.
Germany’s economy will be a focal point with trade (Monday), factory orders (Tuesday) and industrial output (Wednesday) are being updated with December readings.
DISCLAIMER
This report has been prepared by Scotiabank Economics as a resource for the clients of Scotiabank. Opinions, estimates and projections contained herein are our own as of the date hereof and are subject to change without notice. The information and opinions contained herein have been compiled or arrived at from sources believed reliable but no representation or warranty, express or implied, is made as to their accuracy or completeness. Neither Scotiabank nor any of its officers, directors, partners, employees or affiliates accepts any liability whatsoever for any direct or consequential loss arising from any use of this report or its contents.
These reports are provided to you for informational purposes only. This report is not, and is not constructed as, an offer to sell or solicitation of any offer to buy any financial instrument, nor shall this report be construed as an opinion as to whether you should enter into any swap or trading strategy involving a swap or any other transaction. The information contained in this report is not intended to be, and does not constitute, a recommendation of a swap or trading strategy involving a swap within the meaning of U.S. Commodity Futures Trading Commission Regulation 23.434 and Appendix A thereto. This material is not intended to be individually tailored to your needs or characteristics and should not be viewed as a “call to action” or suggestion that you enter into a swap or trading strategy involving a swap or any other transaction. Scotiabank may engage in transactions in a manner inconsistent with the views discussed this report and may have positions, or be in the process of acquiring or disposing of positions, referred to in this report.
Scotiabank, its affiliates and any of their respective officers, directors and employees may from time to time take positions in currencies, act as managers, co-managers or underwriters of a public offering or act as principals or agents, deal in, own or act as market makers or advisors, brokers or commercial and/or investment bankers in relation to securities or related derivatives. As a result of these actions, Scotiabank may receive remuneration. All Scotiabank products and services are subject to the terms of applicable agreements and local regulations. Officers, directors and employees of Scotiabank and its affiliates may serve as directors of corporations.
Any securities discussed in this report may not be suitable for all investors. Scotiabank recommends that investors independently evaluate any issuer and security discussed in this report, and consult with any advisors they deem necessary prior to making any investment.
This report and all information, opinions and conclusions contained in it are protected by copyright. This information may not be reproduced without the prior express written consent of Scotiabank.
™ Trademark of The Bank of Nova Scotia. Used under license, where applicable.
Scotiabank, together with “Global Banking and Markets”, is a marketing name for the global corporate and investment banking and capital markets businesses of The Bank of Nova Scotia and certain of its affiliates in the countries where they operate, including; Scotiabank Europe plc; Scotiabank (Ireland) Designated Activity Company; Scotiabank Inverlat S.A., Institución de Banca Múltiple, Grupo Financiero Scotiabank Inverlat, Scotia Inverlat Casa de Bolsa, S.A. de C.V., Grupo Financiero Scotiabank Inverlat, Scotia Inverlat Derivados S.A. de C.V. – all members of the Scotiabank group and authorized users of the Scotiabank mark. The Bank of Nova Scotia is incorporated in Canada with limited liability and is authorised and regulated by the Office of the Superintendent of Financial Institutions Canada. The Bank of Nova Scotia is authorized by the UK Prudential Regulation Authority and is subject to regulation by the UK Financial Conduct Authority and limited regulation by the UK Prudential Regulation Authority. Details about the extent of The Bank of Nova Scotia's regulation by the UK Prudential Regulation Authority are available from us on request. Scotiabank Europe plc is authorized by the UK Prudential Regulation Authority and regulated by the UK Financial Conduct Authority and the UK Prudential Regulation Authority.
Scotiabank Inverlat, S.A., Scotia Inverlat Casa de Bolsa, S.A. de C.V, Grupo Financiero Scotiabank Inverlat, and Scotia Inverlat Derivados, S.A. de C.V., are each authorized and regulated by the Mexican financial authorities.
Not all products and services are offered in all jurisdictions. Services described are available in jurisdictions where permitted by law.