- Canada’s population-adjusted housing stock is the lowest in the G7.
- Outcomes vary by province in Canada, with Alberta, Manitoba and Ontario recording the lowest number of homes per capita relative to other provinces.
- Ontario would require over 650,000 homes for its ratio of dwellings to population to equal that in the rest of the country.
- There is some cause for optimism as housing starts rose sharply in 2021 and efforts across the country to address the supply deficiency are multiplying. Despite these welcome signs we remain of the view that the shortage of housing relative to the population’s needs will continue to put upward pressure on prices and rents and reduce affordability. Much remains to be done by policymakers to help close the housing deficit.
Canada has a structural housing shortage. This is by now very well established. Last year, we provided some insight into this shortage by comparing the number of dwellings per capita in Canada to that of other G7 countries. That analysis found a large gap between Canadian outcomes and those of our peers. While purely indicative, the analysis pointed to our collective failure in right-sizing the number of homes relative to our population. That work noted that we would need an additional 1.8 million dwellings in Canada for us to have the same number of homes per capita as other G7 countries. Again, that is purely indicative and speaks simply to the potential magnitude of a shortage rather than it being a precise estimate of that shortage.
This note extends that analysis by looking at the per capita housing stock across Canada in 2020, the last year for which we have complete data, to pinpoint provinces where the problem is particularly acute. Two conclusions are evident. First, Alberta, Manitoba and Ontario are the only provinces where the per capita housing stock is below the national average. Second, the challenge in Ontario is formidable given the numbers involved.
As a point of departure for interprovincial comparisons, it bears repeating that Canada’s housing supply lags far behind the G7 (chart 1). Relative to the G7 average, all provinces other than Nova Scotia and Newfoundland and Labrador are below our peers (chart 2). New Brunswick, Prince Edward Island and Québec are reasonably close to the G7 average. All other provinces are significantly below. It is important to note, however, that comparing individual provinces to the national averages of G7 countries can be misleading. Demographics, industrial composition, population density and geography are but a few factors that can skew inferences when comparing outcomes of reasonably small populations to much larger areas.
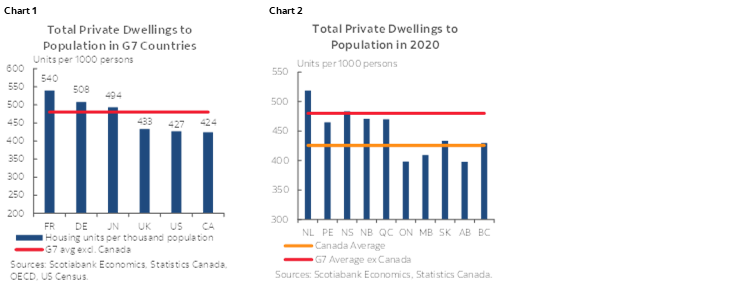
Perhaps of greater interest and insight is comparing the population-adjusted housing stock across provinces. By definition, comparing provinces to a national average will find some above and others below. Most provinces are above the national average, with Ontario, Manitoba and Alberta being well under the average. This is not to say that the housing stock in other provinces is adequate, given the unfavourable international comparison above, but it does suggest that some provinces may have been better at allowing supply to meet needs relative to others. It also likely captures some demographic aspects as well, such as interprovincial migration, which results in a higher stock to population ratio in the province of origin through no action on the part of governments. Newfoundland and Labrador, for instance has seen its population decline by 10 percent since the mid-90s even as the number of dwellings rose through that time.
By comparing the number of homes in provinces that lag the national average, we can get a sense of how acute the undersupply might be. Given its size relative to other provinces, Ontario very much stands out in this respect. For Ontario to have the same level of homes per capita as the average in other provinces, over 650,000 additional housing units would be required. For Alberta, the gap is 138,000 units and around 23,000 units would be required in Manitoba. It should be stressed that this isn’t a bottom-up assessment of housing needs. This is a very simple comparative exercise meant to provide a rough sense of magnitude. Of course, using the G7 average excluding Canada would dramatically increase the number of units required to achieve that metric. In Ontario for instance, it would take an additional 1.2 million homes for that province to have the same dwellings to population ratio as our international peers.
The gap in relation to G7 countries would only be partially closed if we assumed that each of these provinces eliminated the difference relative to the remainder of the country. This would raise Canada’s national average to 447 dwellings per 1,000 individuals from 425. That would put Canada on par with the UK and above the US, but still leave us well below the 480 dwellings per 1,000 individuals average in the G7. To close that gap completely, we would need to build another 1.8 million housing units. The challenge, therefore, is not strictly limited to Alberta, Manitoba, and Ontario.
As we look to the future, we remain of the view that the chronic shortage of housing relative to the population’s needs will put upward pressure on prices and reduce affordability. This is not to say prices will increase every month. There are likely to be months or short periods where prices do not rise and perhaps fall, but our view is that prices will generally be on the rise until a better balance between needs and availability is found. There are encouraging signs, however. Housing starts are running well above pre-pandemic levels, though that pace of construction, if sustained, is unlikely to meaningfully close the gap between supply and demand anytime soon given the size of the gap to be closed, and an expectation of strong immigration growth in coming years. The available completion and population data for 2021, for instance, suggest some improvement in dwellings to population ratios across the country. There is, nevertheless, a big hole to fill.
Many provinces and municipalities do appear to be taking the supply issue more seriously. The Canada-British Columbia Expert Panel on the Future of Housing Supply and Affordability is a great example of serious thinking on these issues. Ontario’s recently announced Housing Affordability Task Force (full disclosure: the Task Force is chaired by Scotiabank) is another sign that governments are more focused on finding ways to boost supply. Efforts are also being deployed at the Federal level, with that level of government promising additional funding to municipalities that achieve specified improvements in the creation of new housing supply through a Housing Accelerator Fund. The Federal Government has recently launched a call for ideas for this program and readers are encouraged to submit their ideas through the linked portal. The Federal government has also indicated that it was planning a national housing summit early in the year, though no details are available at the moment. While these efforts are all welcome, what will matter most at the end of the day is actual progress in increasing supply in a responsible manner. History suggests that we have not been very good as a country in achieving this. Let’s hope current initiatives mark a solid break from past performance.
DISCLAIMER
This report has been prepared by Scotiabank Economics as a resource for the clients of Scotiabank. Opinions, estimates and projections contained herein are our own as of the date hereof and are subject to change without notice. The information and opinions contained herein have been compiled or arrived at from sources believed reliable but no representation or warranty, express or implied, is made as to their accuracy or completeness. Neither Scotiabank nor any of its officers, directors, partners, employees or affiliates accepts any liability whatsoever for any direct or consequential loss arising from any use of this report or its contents.
These reports are provided to you for informational purposes only. This report is not, and is not constructed as, an offer to sell or solicitation of any offer to buy any financial instrument, nor shall this report be construed as an opinion as to whether you should enter into any swap or trading strategy involving a swap or any other transaction. The information contained in this report is not intended to be, and does not constitute, a recommendation of a swap or trading strategy involving a swap within the meaning of U.S. Commodity Futures Trading Commission Regulation 23.434 and Appendix A thereto. This material is not intended to be individually tailored to your needs or characteristics and should not be viewed as a “call to action” or suggestion that you enter into a swap or trading strategy involving a swap or any other transaction. Scotiabank may engage in transactions in a manner inconsistent with the views discussed this report and may have positions, or be in the process of acquiring or disposing of positions, referred to in this report.
Scotiabank, its affiliates and any of their respective officers, directors and employees may from time to time take positions in currencies, act as managers, co-managers or underwriters of a public offering or act as principals or agents, deal in, own or act as market makers or advisors, brokers or commercial and/or investment bankers in relation to securities or related derivatives. As a result of these actions, Scotiabank may receive remuneration. All Scotiabank products and services are subject to the terms of applicable agreements and local regulations. Officers, directors and employees of Scotiabank and its affiliates may serve as directors of corporations.
Any securities discussed in this report may not be suitable for all investors. Scotiabank recommends that investors independently evaluate any issuer and security discussed in this report, and consult with any advisors they deem necessary prior to making any investment.
This report and all information, opinions and conclusions contained in it are protected by copyright. This information may not be reproduced without the prior express written consent of Scotiabank.
™ Trademark of The Bank of Nova Scotia. Used under license, where applicable.
Scotiabank, together with “Global Banking and Markets”, is a marketing name for the global corporate and investment banking and capital markets businesses of The Bank of Nova Scotia and certain of its affiliates in the countries where they operate, including; Scotiabank Europe plc; Scotiabank (Ireland) Designated Activity Company; Scotiabank Inverlat S.A., Institución de Banca Múltiple, Grupo Financiero Scotiabank Inverlat, Scotia Inverlat Casa de Bolsa, S.A. de C.V., Grupo Financiero Scotiabank Inverlat, Scotia Inverlat Derivados S.A. de C.V. – all members of the Scotiabank group and authorized users of the Scotiabank mark. The Bank of Nova Scotia is incorporated in Canada with limited liability and is authorised and regulated by the Office of the Superintendent of Financial Institutions Canada. The Bank of Nova Scotia is authorized by the UK Prudential Regulation Authority and is subject to regulation by the UK Financial Conduct Authority and limited regulation by the UK Prudential Regulation Authority. Details about the extent of The Bank of Nova Scotia's regulation by the UK Prudential Regulation Authority are available from us on request. Scotiabank Europe plc is authorized by the UK Prudential Regulation Authority and regulated by the UK Financial Conduct Authority and the UK Prudential Regulation Authority.
Scotiabank Inverlat, S.A., Scotia Inverlat Casa de Bolsa, S.A. de C.V, Grupo Financiero Scotiabank Inverlat, and Scotia Inverlat Derivados, S.A. de C.V., are each authorized and regulated by the Mexican financial authorities.
Not all products and services are offered in all jurisdictions. Services described are available in jurisdictions where permitted by law.