Next Week's Risk Dashboard
• A sweep of the evidence on global supply chain pressures
• US CPI inflation is still running hot
• China CPI is not
• Has the door shut on PBOC easing?
• Banxico still faces a steep hill to climb
• Peru’s central bank expected to hike
• Bank Negara to pause with hike guidance
• The BoC on commodity effects
• RBNZ inflation expectations will probably soar
• India’s inflation to further pressure the RBI
• UK, Chinese economies in focus
Chart of the Week
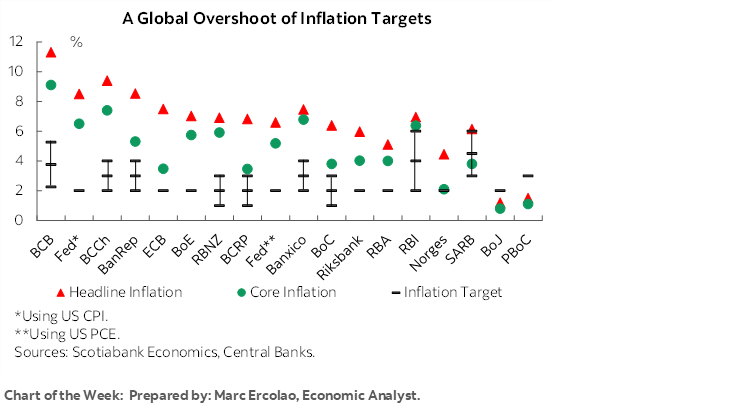
This will be a big week for inflation watchers. That might invite a retort like ‘what else is new’ given that inflation has been the dominant focus driving a lot of action across global markets for much of the past 12–18 months. Still, markets perk up when the two biggest economies in the world update their inflation readings on the heels of decisions by major global central banks.
Further, if Russia formally declares war against Ukraine as some expect—instead of labelling its invasion as a “special operation”—on May 9th in keeping with the 1945 anniversary of the Russian victory over Nazi Germany, then oil and inflation markets could get a further jolt with the risk of escalation including greater mobilization of Russian troops. Russia has denied this but can’t be trusted as it has lied every step of the way. Putin will make a closely monitored speech marking the occasion.
Before turning to the expectations in the context of the rest of the week’s overall developments it’s worth stepping back and tracking progress on supply chain drivers that are playing a partial role in pushing inflation higher. The evidence across a suite of measures is mixed at best and continues to suggest there is a lot of work to be done. The drivers of supply chain challenges have been shifting with new drivers taking over from prior ones, but it seems highly premature to conclude that intense overall supply chain pressures are turning less inflationary.
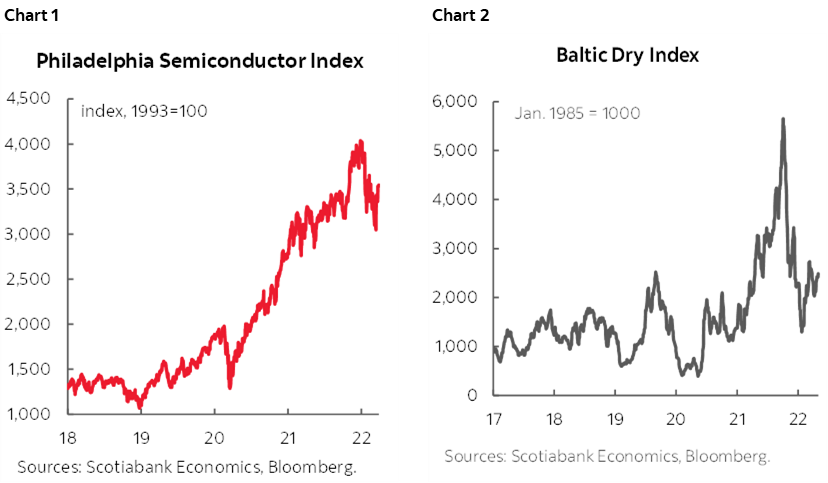
For starters, some measures of supply chain challenges are indeed improving. Semiconductor prices have fallen which may signal some combination of the market’s expectations for weaker future demand alongside investments in semiconductor capacity that are slowly improving supply conditions (chart 1). Semiconductors have long been plagued by a feast or famine problem that has driven wild swings in prices. The Baltic Dry Index’s decline is taken by some as a bad omen for the world economy, but the usual caution is that it can be more reflective of shortages of containers that have since eased and brought prices lower (chart 2).
By contrast, Flexport, a freight forwarding company, offers weekly measures of how many days it takes for ocean freight to go from the exporters’ gate to the destination port and they remain very elevated toward 111 days (here). Marginal improvements may be false signals because of shut factories in parts of China; when China’s Covid Zero policies eventually settle down, we could perversely see worsened transportation bottlenecks as more normal activity resumes. Air timeliness has returned toward somewhat more normal levels (here).
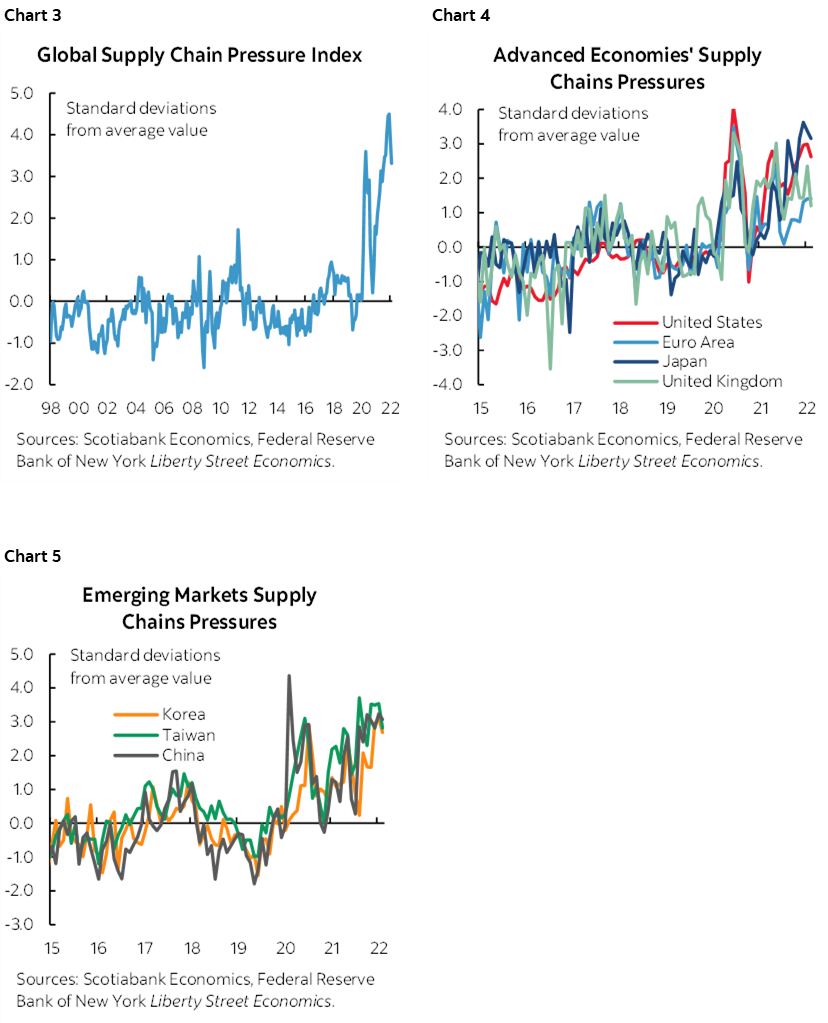
Economists at the New York Federal Reserve offer a Global Supply Chain Pressure Index that is a composite of a variety of measures and is pending a monthly update any day now (here). The current February reading is getting somewhat dated given rapid developments, but its elevated readings have shown little evidence of improvement and are among the measures to carefully monitor (chart 3). The same general observation holds for its global gauges (charts 4, 5).
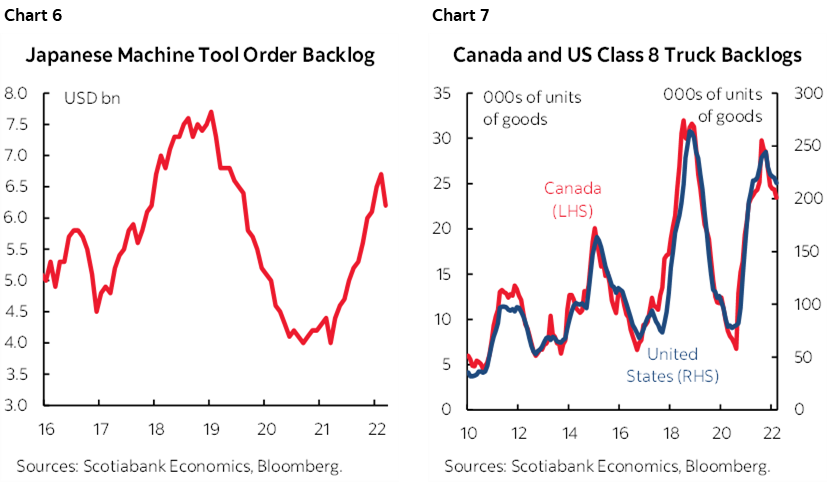
With demand for capital goods being rather hot, the order backlog for machine tool orders out of Japan remains very high (chart 6). Another example of this is the order backlog for ‘class 8’ heavy trucks in the US and Canada (chart 7). Years of underinvestment combined with capacity constraints are driving big ticket business spending higher as companies struggle to keep up and hold the cards in terms of pricing power.
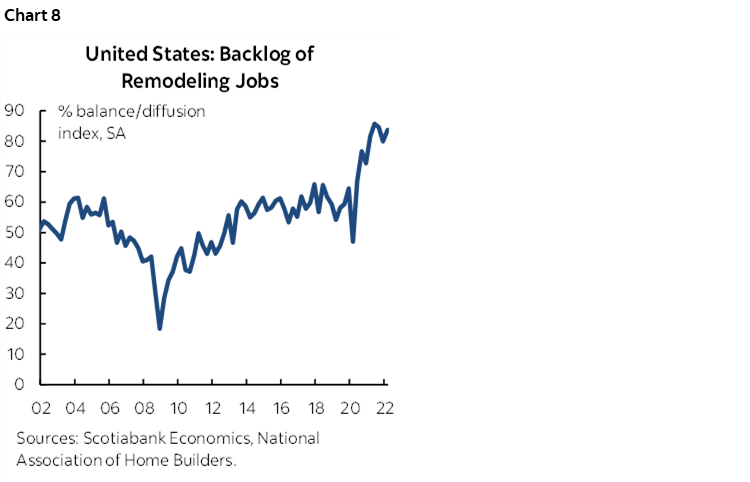
Of relevance to housing markets and demand for the trades, there is the U.S. National Association of Homebuilders/Westlake Royal Remodeling Market Index. The quarterly reading is still at the highest in history since 2001 (chart 8). The future expectations subindex based upon the pace at which leads and inquiries are arriving and the current backlog of projects is also shown to be at a record high. Will a cooler US housing market slow this activity? Or will the ‘love it or list it’ decision result in more people showing a little more love for fixing up their current homes? Either way, that aging backyard deck might just get another coat of stain to wait out current demand conditions…
Now does any of this matter in terms of informing the outlook for inflation and central bank policy? The argument that central bankers should not respond with tightened monetary policy to supply chain pressures continues to suffer from two major flaws and poor judgement that held central banks back from tightening earlier. First, inflation is not just driven by supply-side issues; housing and many services, for example, tend to be more locally driven and highly interest sensitive in response to massive global monetary policy easing. Second, it hasn’t mattered for a while now. Consumers, businesses and markets no longer really care exactly what is driving inflation as multiple survey- and market-based measures point to extrapolative behaviour guiding inflation expectations well above central bank targets.
INFLATION—US VS. CHINA
The release that will matter to global markets the most is likely to be US CPI for April on Wednesday. Surrounding that release will be a variety of regional teasers.
US CPI inflation for April arrives on Wednesday. My guesstimate is for headline inflation to rise by 0.3% m/m SA and 8.3% y/y. The year-over-year rate should be somewhat softer than the prior month’s 8.5% pace. Some of the reason for this is that higher year-ago base effects on their own would pull inflation down toward 7.7% y/y if nothing else changed. We’re at the point, however, when evaluating inflationary pressure has to emphasize m/m seasonally adjusted and annualized pressures independent of base effects which is what was counselled on the way up but for the opposite reason.
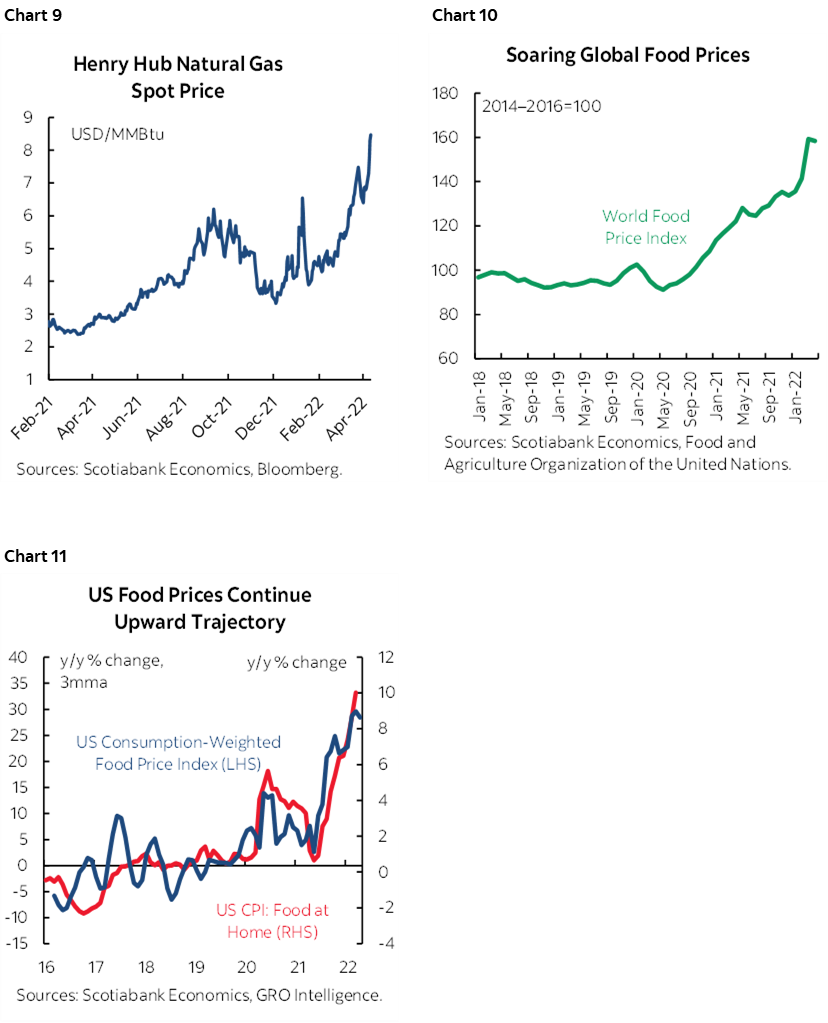
Other drivers of the call for US CPI include typically modest seasonal pressure on prices, a minor drag from lower gasoline prices in April over March, a massive 30%+ m/m rise in natural gas spot prices in part due to spillover effects of Europe’s energy market troubles as they’ve doubled since February (chart 9), and higher new vehicle prices. This time around, trade-in values indicate higher used vehicle prices (+4.25% m/m NSA, SA~½%) that conflict with other readings like Black Book prices (-1.2% m/m SA) and Manheim auction figures (-0.9% m/m SA). On balance I went with a mild contribution from used vehicle prices given a weighting toward the preferred sources in the BLS methodology. Also note that global and US basket-weighted food prices have been soaring but may have taken a bit of a breather of late (charts 10, 11).
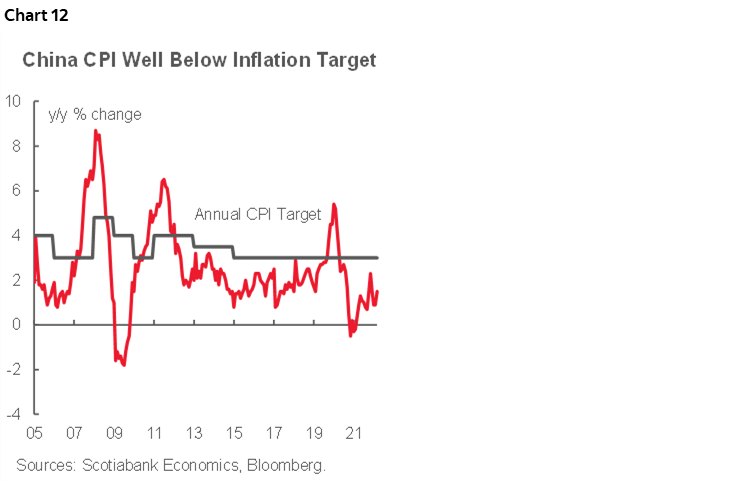
China will update CPI inflation for April on Tuesday evening (always eastern time). Higher oil prices are likely to pull headline inflation up toward 2% y/y (1.5% prior) but with little effect on core inflation that has just been decelerating to a touch over 1% y/y (chart 12). Either way, China’s inflation rate would remain well below the 3% goal.
Canada will update the adjusted CPI index for the period January to March 2022 on Monday. The aim of the adjusted series is to provide interim assessments of the impact on CPI inflation of shifts in how consumers spend their money by evaluating the effects on CPI basket weights. The last estimates for 2021Q4 (here) showed relatively little difference to official CPI. The adjusted price index saw month-over-month price changes that deviated from official CPI by at most +/- 0.1% since last summer when the basket weights were last changed. Statcan is now updating basket weights in official CPI annually with the next update due in June.
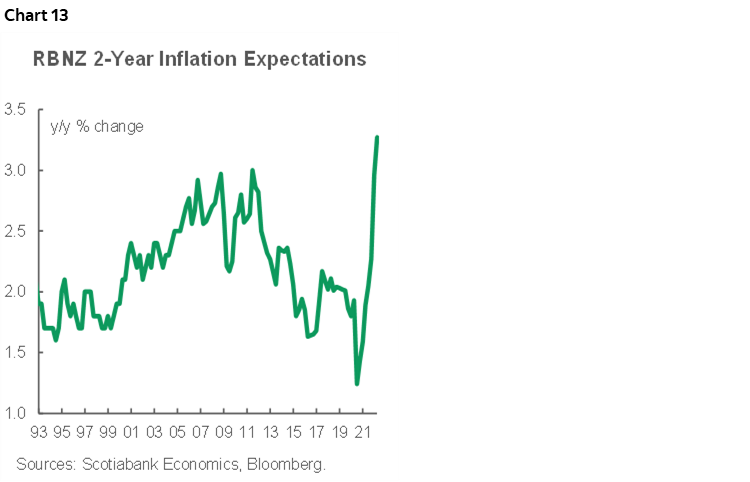
The RBNZ pays close attention to measures of inflation expectations such as its 1-year and 2-year forward expectations measures that are drawn from a household survey. The Q2 results will land on Wednesday and are very likely to push even higher than in Q1 (chart 13). That’s because the survey is conducted in the middle of each quarter and hence the Q1 result would have been surveyed in February before much of the Ukraine war’s effects on commodities came through into March.
India will update CPI for April on Thursday and inflation is expected to reach ~7¼% y/y from just under 7% previously. India’s inflation rate is blowing the Reserve Bank of India’s target bands of 4% +/-2%. With a scheduled meeting not until June 8th, the serial positive shocks to India inflation are what motivated the RBI to deliver tightening at an emergency meeting this past week when it hiked the repurchase rate by 40bps to 4.4% and raised the cash reserve ratio by 0.5% to 4.5%.
CENTRAL BANKS—MORE VARIETY
Most of this week’s central bank action will be focused upon the People’s Bank of China and a pair of Latin American central banks.
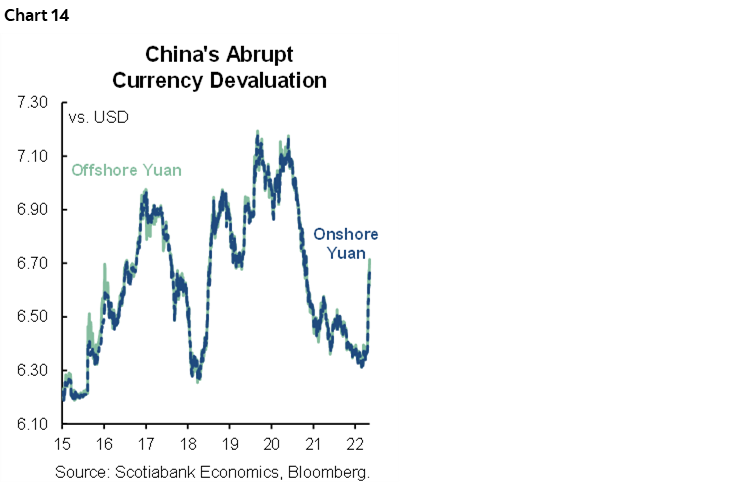
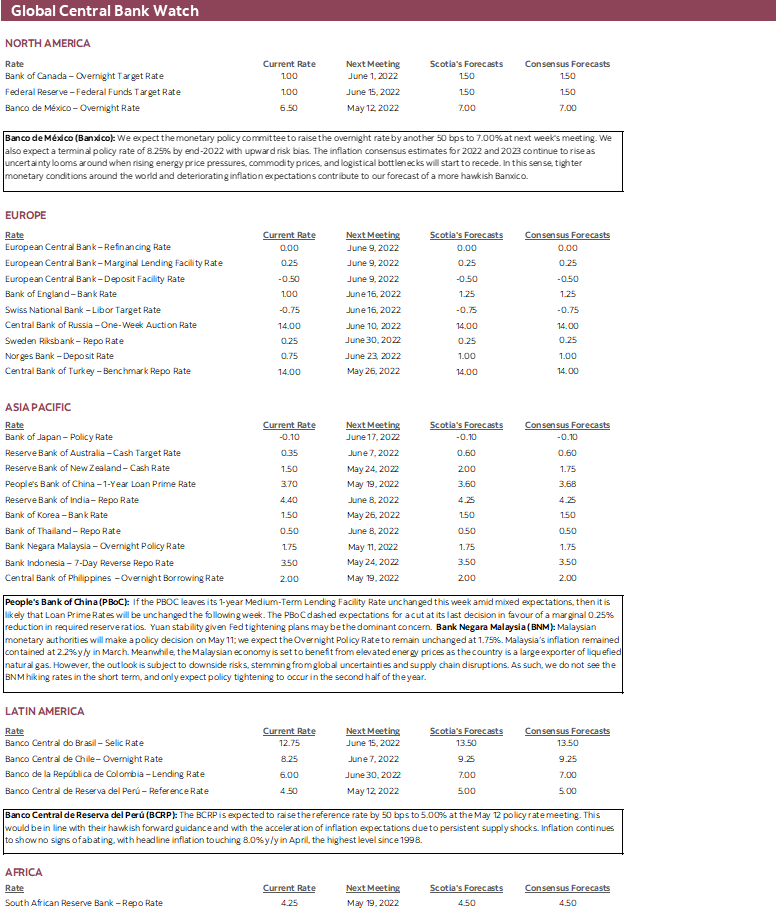
Here we go again. China’s central bank could deliver a decision on the 1-year Medium-Term Lending Facility Rate as soon as later in the week or into early the next week. Much like last time, some local economists expect a cut given the tone of policy rhetoric from Chinese officials. So far, the PBOC has resisted while maintaining relatively tight policy as reflected in the real policy rate that is among the highest in the world. Instead, the PBOC opted the last time around to deliver a marginal cut to the required reserve ratio. It could opt to rely upon yuan weakness given currency depreciation over recent weeks (chart 14) and driven by diverging bets on relative US-China monetary policy. In fact, since its last decision, the greater intensification of yuan weakness might have closed the door on prospects of monetary easing without adding to instability in Chinese financial markets.
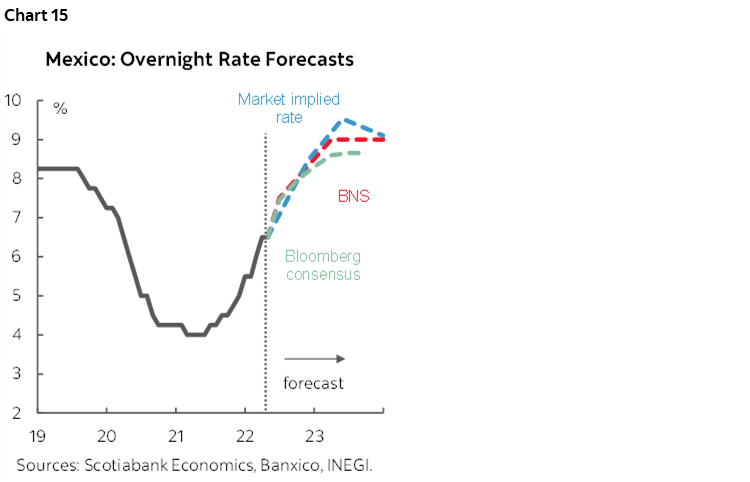
Mexico’s central bank is widely expected to hike its overnight rate by another 50bps on Thursday. That would bring the rate from 4% last summer to 7%. Markets are pricing a policy rate toward 9½% within a year from now which is above the 8¼% peak our Mexico City-based economists expect for later this year (chart 15). When Fed Chair Powell ruled out 75bps hikes and left estimates of the US neutral rate untouched, the effect was to somewhat ease up on pressures on Mexico’s central bank. Having said that, inflation at 7½% y/y and core CPI at 6¾% y/y remain far above the 3% target.
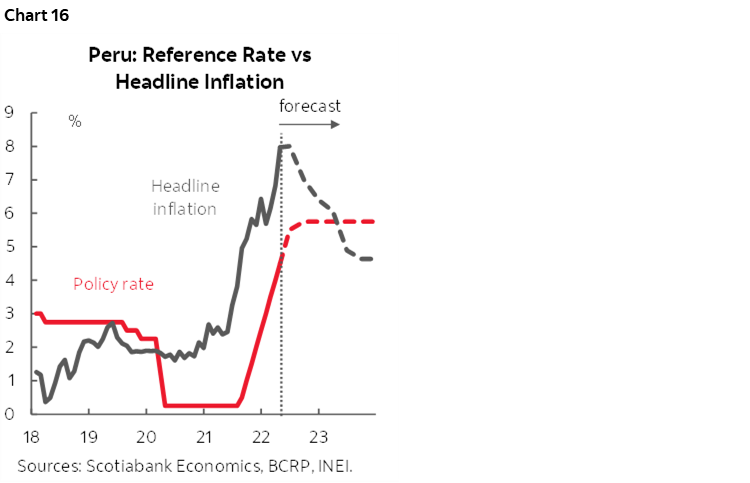
Also on Thursday will be the next policy reference rate decision by Peru’s central bank. A 50bps hike to 5% is expected. Inflation continues to show no signs of abating, with headline inflation touching 8.0% y/y in April, the highest level since 1998 and possibly nearing a peak (chart 16).
Most expect Bank Negara Malaysia to continue to hold its overnight policy rate at 1.75% on Wednesday. Inflation is only running at 2.2% y/y with core CPI at 2% but climbing. If they do pause again, then watch forward guidance carefully in light of expectations for the central bank to soon commence a tightening campaign.
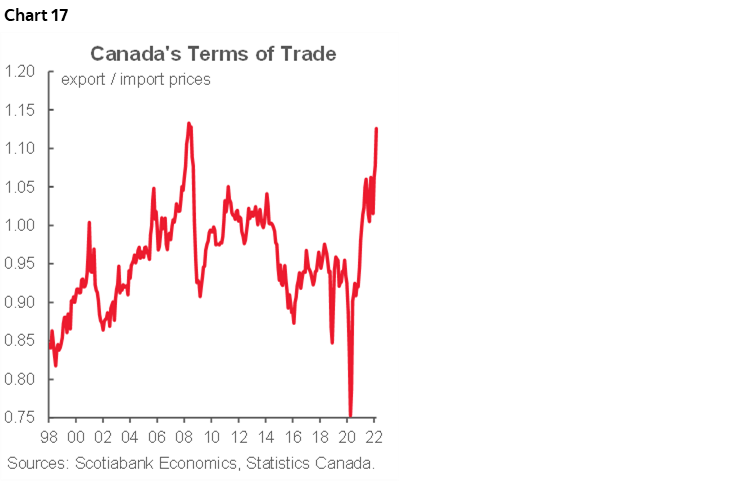
Bank of Canada Deputy Governor Toni Gravelle speaks on Thursday about commodity price shocks and impact on growth and inflation. In the past, the BoC has emphasized the positive effects of higher commodities on the country’s terms of trade measured as the ratio of export prices to import prices (chart 17). Expect a somewhat hawkish tone that emphasizes how this positive shock serves as an imported lift to incomes that should boost inflationary pressure at the margin.
OTHER MACRO—CHINA & THE UK IN FOCUS
The rest of the global line-up of macro developments will be fairly light.
Additional US releases will include producer prices during April (Thursday) and the University of Michigan’s consumer sentiment reading for May (Friday). Post-nonfarm Fed-speak will bring out NY Fed President Williams, Governor Waller, Cleveland’s Mester, Minneapolis President Kashkari and Richmond Fed President Barkin (Tuesday), Atlanta Fed President Bostic (on Tuesday and Wednesday), and then several officials speak after CPI including San Fran’s Daly (Thursday) and both Cleveland’s Mester and Minneapolis President Kashkari (Friday).
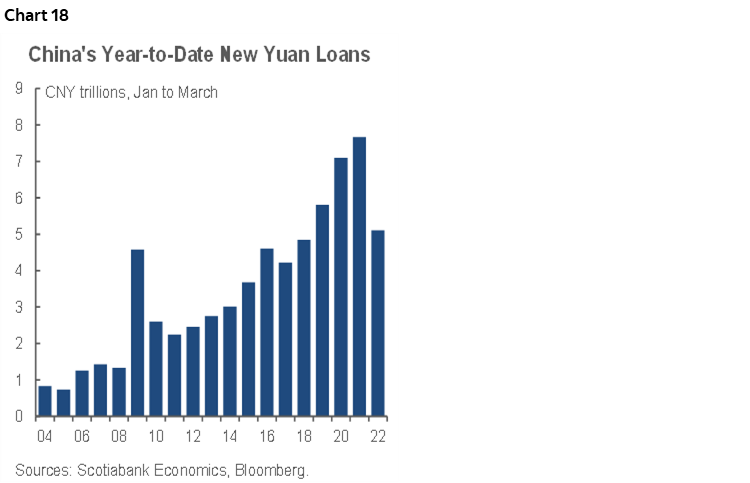
China could update aggregate financing aka social credit figures for April this week against a cool year-to-date trend (chart 18). Exports in April arrive into the Monday open and are likely to suffer given Covid Zero lockdown policies.
The UK economy will be a focal point when Q1 GDP arrives on Monday alongside March readings for industrial output, services and trade that will help to inform hand-off effects to growth into Q2.
CPI updates will also arrive from Mexico (Monday), Indonesia (Monday), India (Monday), Norway (Tuesday), Brazil (Wednesday), and Sweden (Thursday).
Q1 GDP figures are also due from Indonesia (Monday), Philippines (Wednesday), Norway and Malaysia (Friday). Eurozone industrial output (Friday) and the ZEW investor expectations survey in Germany (Tuesday) will round things out along with Norway’s budget (Thursday).

DISCLAIMER
This report has been prepared by Scotiabank Economics as a resource for the clients of Scotiabank. Opinions, estimates and projections contained herein are our own as of the date hereof and are subject to change without notice. The information and opinions contained herein have been compiled or arrived at from sources believed reliable but no representation or warranty, express or implied, is made as to their accuracy or completeness. Neither Scotiabank nor any of its officers, directors, partners, employees or affiliates accepts any liability whatsoever for any direct or consequential loss arising from any use of this report or its contents.
These reports are provided to you for informational purposes only. This report is not, and is not constructed as, an offer to sell or solicitation of any offer to buy any financial instrument, nor shall this report be construed as an opinion as to whether you should enter into any swap or trading strategy involving a swap or any other transaction. The information contained in this report is not intended to be, and does not constitute, a recommendation of a swap or trading strategy involving a swap within the meaning of U.S. Commodity Futures Trading Commission Regulation 23.434 and Appendix A thereto. This material is not intended to be individually tailored to your needs or characteristics and should not be viewed as a “call to action” or suggestion that you enter into a swap or trading strategy involving a swap or any other transaction. Scotiabank may engage in transactions in a manner inconsistent with the views discussed this report and may have positions, or be in the process of acquiring or disposing of positions, referred to in this report.
Scotiabank, its affiliates and any of their respective officers, directors and employees may from time to time take positions in currencies, act as managers, co-managers or underwriters of a public offering or act as principals or agents, deal in, own or act as market makers or advisors, brokers or commercial and/or investment bankers in relation to securities or related derivatives. As a result of these actions, Scotiabank may receive remuneration. All Scotiabank products and services are subject to the terms of applicable agreements and local regulations. Officers, directors and employees of Scotiabank and its affiliates may serve as directors of corporations.
Any securities discussed in this report may not be suitable for all investors. Scotiabank recommends that investors independently evaluate any issuer and security discussed in this report, and consult with any advisors they deem necessary prior to making any investment.
This report and all information, opinions and conclusions contained in it are protected by copyright. This information may not be reproduced without the prior express written consent of Scotiabank.
™ Trademark of The Bank of Nova Scotia. Used under license, where applicable.
Scotiabank, together with “Global Banking and Markets”, is a marketing name for the global corporate and investment banking and capital markets businesses of The Bank of Nova Scotia and certain of its affiliates in the countries where they operate, including; Scotiabank Europe plc; Scotiabank (Ireland) Designated Activity Company; Scotiabank Inverlat S.A., Institución de Banca Múltiple, Grupo Financiero Scotiabank Inverlat, Scotia Inverlat Casa de Bolsa, S.A. de C.V., Grupo Financiero Scotiabank Inverlat, Scotia Inverlat Derivados S.A. de C.V. – all members of the Scotiabank group and authorized users of the Scotiabank mark. The Bank of Nova Scotia is incorporated in Canada with limited liability and is authorised and regulated by the Office of the Superintendent of Financial Institutions Canada. The Bank of Nova Scotia is authorized by the UK Prudential Regulation Authority and is subject to regulation by the UK Financial Conduct Authority and limited regulation by the UK Prudential Regulation Authority. Details about the extent of The Bank of Nova Scotia's regulation by the UK Prudential Regulation Authority are available from us on request. Scotiabank Europe plc is authorized by the UK Prudential Regulation Authority and regulated by the UK Financial Conduct Authority and the UK Prudential Regulation Authority.
Scotiabank Inverlat, S.A., Scotia Inverlat Casa de Bolsa, S.A. de C.V, Grupo Financiero Scotiabank Inverlat, and Scotia Inverlat Derivados, S.A. de C.V., are each authorized and regulated by the Mexican financial authorities.
Not all products and services are offered in all jurisdictions. Services described are available in jurisdictions where permitted by law.