- Bond yields lit up by wage pressures, pre-pandemic low for unemployment
- The miss on nonfarm payrolls is modest after considering revisions…
- ...while the household survey continues to indicate much faster job growth
- Evidence points toward how the US may already be at maximum employment
- Fed lift-off in March is mostly priced, but markets remain lighter than our full-year forecast
- US vaccine mandate enforcement has begun
US nonfarm payrolls, m/m 000s // UR (%), December, SA:
Actual: 199 / 3.9
Scotia: 600 / 4.2
Consensus: 450 / 4.1
Prior: 249 / 4.2 (revised from 210 / 4.2)
US nonfarm payrolls (+199k) disappointed loftier expectations, but what drove bond yields higher in a bear steepener Treasury move was the combined effect of the decline in the unemployment rate to a pre-pandemic low that signals tight job markets, plus the strength of wage gains that reinforces the point about tightening job markets. To the Fed’s dual mandate, such evidence suggests that the wage-price connection is increasingly challenging its price stability goal while we may already be at maximum employment or very close to it.
Denting some of the consensus miss was the fact that nonfarm payrolls were revised up by 141k in the prior two months and mostly for October. Add positive revisions to the 199k for November and the combined 340k rise in payrolls wasn’t as bad of a miss especially considering the 90% confidence interval on nonfarm payrolls of +/- about 110k.
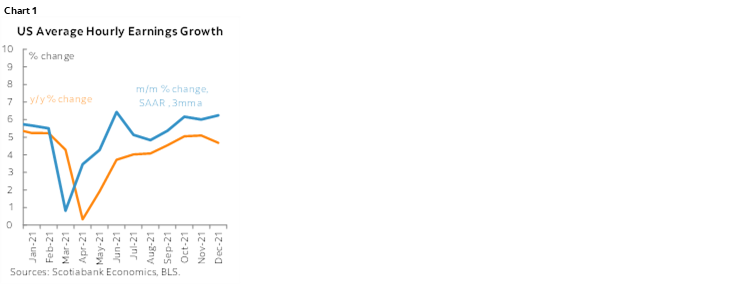
Wage growth picked up to 0.6% m/m at a seasonally adjusted but non-annualized rate. That translates into an annualized pace of 7½%. It has run at this pace over three of the past four months. What’s more, the annualized rate of monthly seasonally adjusted wage gains has been running at between 4.3% and 8.3% over the nine months since April. This month-over-month pace is outpacing the year-over-year gains (chart 1) and likely to begin putting upward pressure on the y/y rate.
The unemployment rate fell three-tenths to 3.9% (chart 2). That’s the lowest unemployment rate since February 2020 and hence just before masks and needles entered the picture. How come, when nonfarm disappointed? Because the unemployment rate is derived from the companion household survey which showed another explosive job gain of 651k after the prior month’s household survey registered a gain of 1.74 million while that same survey showed that the labour force only expanded by 168k last month.

A key related issue is the massive difference between what the household survey and the establishment survey are reporting for job growth over the past two months which has only two other parallels in history (chart 3). For November and December combined, the household survey says that 1.74 million jobs have been created versus nonfarm’s 448k for a whopping difference of 1.29 million jobs. There have only been three times in history when the household survey’s reported job gain was this much higher than the nonfarm payrolls report over two consecutive months. One was during the dot com period at the start of 2000. Another was the summer of 2020.

I don’t know why this deviation is occurring. We should be careful toward the bigger error bands around the household survey relative to the nonfarm figures, but the magnitude of the deviation is bigger than what can be explained by relative confidence bands. There is always revision risk to both surveys but sweeping aside this observation would require enormous revisions. It’s not because people are become self-employed in droves since those numbers are falling as indicated by the same household survey (chart 4). This is pure conjecture on my behalf, but it’s not intuitively unreasonable to think that maybe smaller incorporated businesses that are probably better captured in the household survey are picking up workers from the larger payroll employers. Maybe concern toward being in densely concentrated workplaces in urban centers in a pandemic is a driving force! Maybe smaller businesses are more nimble in keeping up with the compensation pressures.

OTHER DETAILS:
Chart 5 shows the breakdown of nonfarm payroll employment by sector. About half a dozen sectors played a similarly sized role in driving the overall employment gain. They were (in order) leisure and hospitality’s 53k that may be about to get crushed in January, business services (+43k) but not via temp help, trade/transport (+30k) but with retail trade flat (-2k), manufacturing (26k), construction (22k) and education/health (10k).

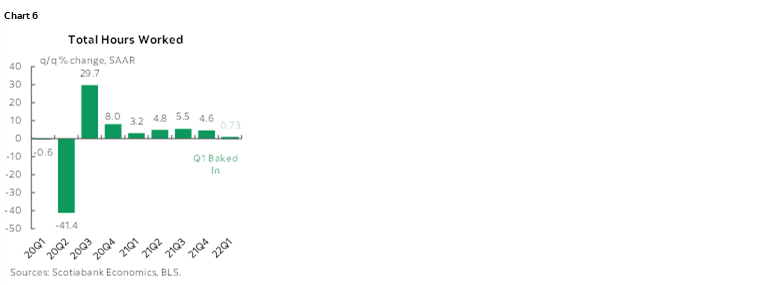
Hours worked were up 0.2% m/m in December and 4.6% q/q annualized in Q4 (chart 6). We already have another annualized gain of 0.7% baked into ‘22Q1 before any Q1 data given the way Q4 ended relative to the overall quarter. That’s a strong supporting indication for GDP growth given GDP is an identity defined as hours worked times labour productivity.
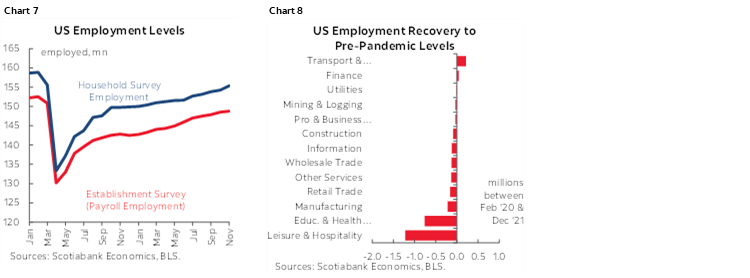
The final two charts track employment progress to date in the pandemic. The household survey shows that the US is still 2.9 million jobs short of where things stood in February 2020. Nonfarm payrolls are still 3.6 million below that same point. My view all along has been that the goal isn’t getting back to that point if labour supply is more significantly restrained now. The way I see it, the US is at full employment.
A near-term challenge to monitor will be omicron’s effects and vaccine mandates given evidence of a push to enforce them at large employers in the US banking industry as one example. This is probably a nearer-term shock that monetary policy should look through.
DISCLAIMER
This report has been prepared by Scotiabank Economics as a resource for the clients of Scotiabank. Opinions, estimates and projections contained herein are our own as of the date hereof and are subject to change without notice. The information and opinions contained herein have been compiled or arrived at from sources believed reliable but no representation or warranty, express or implied, is made as to their accuracy or completeness. Neither Scotiabank nor any of its officers, directors, partners, employees or affiliates accepts any liability whatsoever for any direct or consequential loss arising from any use of this report or its contents.
These reports are provided to you for informational purposes only. This report is not, and is not constructed as, an offer to sell or solicitation of any offer to buy any financial instrument, nor shall this report be construed as an opinion as to whether you should enter into any swap or trading strategy involving a swap or any other transaction. The information contained in this report is not intended to be, and does not constitute, a recommendation of a swap or trading strategy involving a swap within the meaning of U.S. Commodity Futures Trading Commission Regulation 23.434 and Appendix A thereto. This material is not intended to be individually tailored to your needs or characteristics and should not be viewed as a “call to action” or suggestion that you enter into a swap or trading strategy involving a swap or any other transaction. Scotiabank may engage in transactions in a manner inconsistent with the views discussed this report and may have positions, or be in the process of acquiring or disposing of positions, referred to in this report.
Scotiabank, its affiliates and any of their respective officers, directors and employees may from time to time take positions in currencies, act as managers, co-managers or underwriters of a public offering or act as principals or agents, deal in, own or act as market makers or advisors, brokers or commercial and/or investment bankers in relation to securities or related derivatives. As a result of these actions, Scotiabank may receive remuneration. All Scotiabank products and services are subject to the terms of applicable agreements and local regulations. Officers, directors and employees of Scotiabank and its affiliates may serve as directors of corporations.
Any securities discussed in this report may not be suitable for all investors. Scotiabank recommends that investors independently evaluate any issuer and security discussed in this report, and consult with any advisors they deem necessary prior to making any investment.
This report and all information, opinions and conclusions contained in it are protected by copyright. This information may not be reproduced without the prior express written consent of Scotiabank.
™ Trademark of The Bank of Nova Scotia. Used under license, where applicable.
Scotiabank, together with “Global Banking and Markets”, is a marketing name for the global corporate and investment banking and capital markets businesses of The Bank of Nova Scotia and certain of its affiliates in the countries where they operate, including; Scotiabank Europe plc; Scotiabank (Ireland) Designated Activity Company; Scotiabank Inverlat S.A., Institución de Banca Múltiple, Grupo Financiero Scotiabank Inverlat, Scotia Inverlat Casa de Bolsa, S.A. de C.V., Grupo Financiero Scotiabank Inverlat, Scotia Inverlat Derivados S.A. de C.V. – all members of the Scotiabank group and authorized users of the Scotiabank mark. The Bank of Nova Scotia is incorporated in Canada with limited liability and is authorised and regulated by the Office of the Superintendent of Financial Institutions Canada. The Bank of Nova Scotia is authorized by the UK Prudential Regulation Authority and is subject to regulation by the UK Financial Conduct Authority and limited regulation by the UK Prudential Regulation Authority. Details about the extent of The Bank of Nova Scotia's regulation by the UK Prudential Regulation Authority are available from us on request. Scotiabank Europe plc is authorized by the UK Prudential Regulation Authority and regulated by the UK Financial Conduct Authority and the UK Prudential Regulation Authority.
Scotiabank Inverlat, S.A., Scotia Inverlat Casa de Bolsa, S.A. de C.V, Grupo Financiero Scotiabank Inverlat, and Scotia Inverlat Derivados, S.A. de C.V., are each authorized and regulated by the Mexican financial authorities.
Not all products and services are offered in all jurisdictions. Services described are available in jurisdictions where permitted by law.