- US job growth vastly exceeded expectations again
- Revisions were positive and large
- Real wage gains may lie ahead
- Hours worked soared and tentatively suggest strong Q1 GDP growth
- Recession and rate pause? Yeah right.
- While the debt ceiling remains a nearer-term risk…
- …Powell flubbed it this week
- US nonfarm employment, m/m 000s / UR (%) / m/m wages, SA, January:
- Actual: 517 / 3.4 / 0.3
- Scotia: 200 / 3.5 / 0.3
- Consensus: 188 / 3.6 / 0.3
- Prior: 260 / 3.5 / 0.4 (revised from 223 / 3.5 / 0.3)
Everything turned up roses in the latest swing at estimating US job market conditions. The humbling half-million gain in January, strong positive revisions, surge in hours and the mild upside to trend wage growth paint a picture of a job market that is incredibly strong.
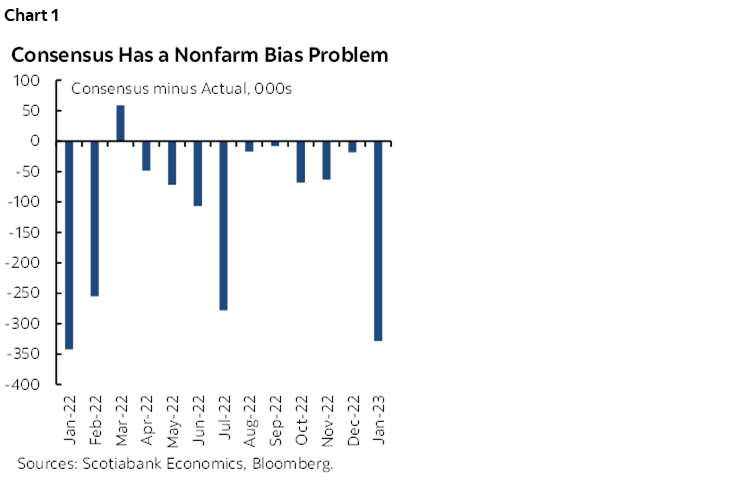
The latest numbers continue the serial pattern of economists drastically underestimating US job growth in twelve of the past thirteen reports which is rather revealing in terms of the trend bias that has been far too negative toward jobs as well as GDP (chart 1). This leans to my rotation argument in that despite three months of evidence that layoffs have picked up, it continues to be the case that the job market is capable of absorbing this and in the context of ongoing churn. Job growth is moving away from sectors that benefited from growth drivers earlier in the pandemic and when they hogged all of the workers and toward the sectors that serve the innate desire to get back to more normal activities and have worker shortages as evidenced by high job vacancies.
RATES PUSHED HIGHER—SOME RECESSION!!
Going into the report, markets were indeed more vulnerable from a risk-reward standpoint to an upside surprise than what was probably a priced soft report given the rally in US rates and global sovereign bonds following uninspiring performances by Fed Chair Powell and ECB President Lagarde. Those central bankers waffled at precisely the wrong time. Positioning has swung in the opposite direction post-payrolls.
The US two-year yield is up by about 15bps post-data. The entire curve is selling off. This is dragging most other sovereign benchmarks higher through carry influences including rocking Canadas, EGBs, gilts and with Asia set to react in lagging fashion into Monday. The S&P500 initially softened but is now slightly higher at the time of publishing perhaps as stocks weigh the evidence against recession concerns more so than the implications for rates and central banks. We’ll see about the rates side.
Vehicle sales were up 18% m/m SA. Jobs are soaring. Hours worked were strong. Wages firmed up. ISM-services jumped by over 5 points to 55.2 post-payrolls and was driven by a surge of new orders after two quarters of inventory drags on GDP growth that may be stabilizing or reversing now. Some recession. Some pause. 6% fed funds next?
CHURN IS ALIVE AND KICKING
The composition of the numbers suggests that the lay offs in sectors that were weak this past month—like IT and Finance—are either quickly getting other jobs and/or there is enough offsetting momentum in terms of hiring across other sectors. I’ll come back to this point in a moment with the sector details.
BOGUS REVISION FEARS
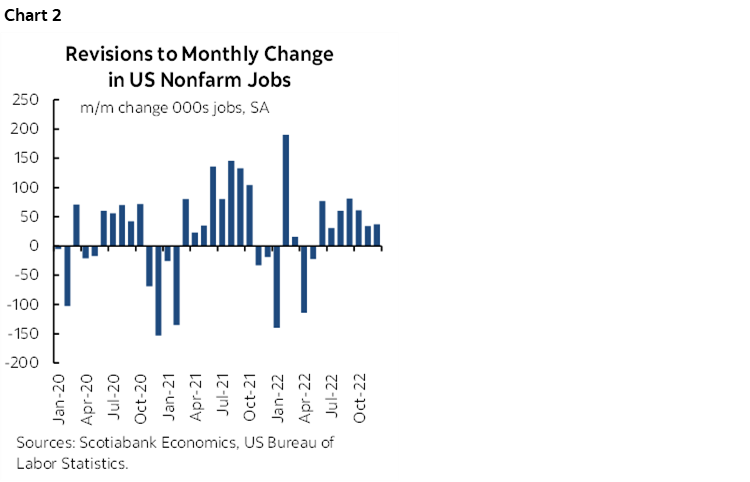
The revision fears into this report did indeed turn out to be absolute hogwash. The narrative that prior job gains would be wiped out in the annual revisions as driven by economists at the Philly Fed was dead wrong as I had cautioned in various publications. Instead, the level of employment in the US was revised up by 568,000 jobs as at March 2022 and for the full year the revision was +311k (chart 2). The two final months of 2022 were revised up to show 71k more jobs created than previously understood.
WAGES HIGHER—REAL GAINS MAY LIE AHEAD
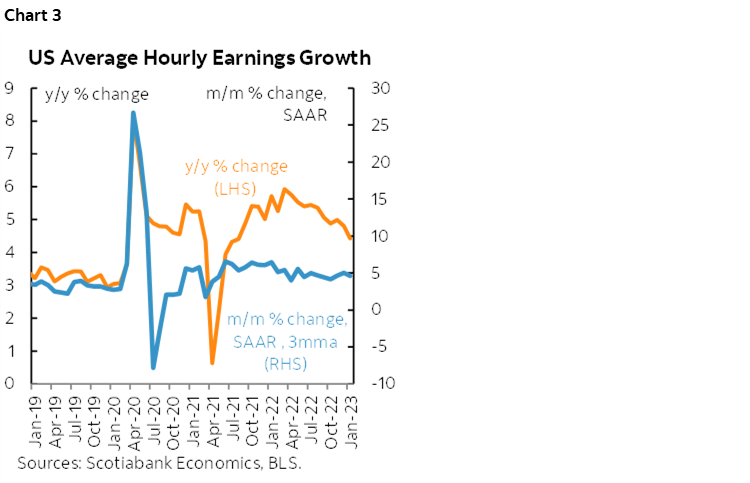
Annualized trend wage gains continue to be solid and may point toward coming real wage gains for American workers. The three-month m/m SAAR pace of wage gains now stands at 4.6% after a 3.7% m/m SAAR gain in January and an upward revision to 4.9% m/m SAAR in December (chart 3). Going forward, if inflation truly does cool—a big if—and if nominal wage gains continue around this trend pace—another big if in both directions—then positive real wage gains may be coming for American workers. That’s great. But it could complicate the Fed’s efforts to rein in inflation.
CAREFUL TOWARD THE HOUSEHOLD SURVEY’S MEASURES
The companion household survey registered another 894k m/m SA jobs in January but be careful with that because the change in population counts that was incorporated into January’s figures was not incorporated into revisions and so the m/m change in employment as measured by the household survey is unreliable. The dip in the UR and the rise of the participation rate also need to be carefully treated.
The BLS—to its credit—at least provided table ‘B’ in its release that did a one-off calculation for what January’s change in the labour force would have looked like had they revised history. What they show is that the civilian labour force would have been revised up by 871k in December 2022 using the new population counts had they revised it, but the January change that does incorporate new population counts was flat over this adjusted December number.
In plain English, proper adjustments show that the size of the available labour pool (not employment) did not change in January over December but would have been higher than reported in December had they revised history for the household survey and not just for the establishment survey.
Beyond that, also recall that the household survey has ginormous confidence bands that are much larger than nonfarm. The household survey's 90% confidence interval for the number of unemployed is +/- 300k.
SECTOR DETAILS POINT TO ROTATION
The composition of the change in jobs leans toward my rotation argument in that sectors letting go of folks are being offset by hiring elsewhere. See chart 4.
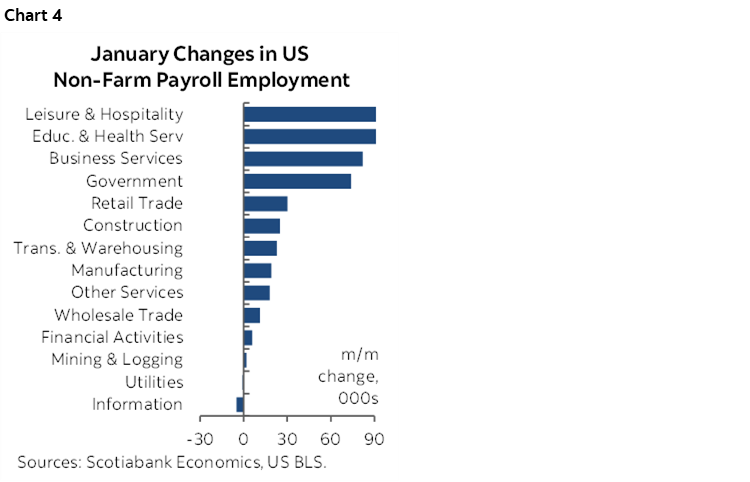
December's nonfarm payroll change was skewed toward 443k in the private sector, but government was also up by 74k.
There was a 397k rise in services employment and a 46k gain in goods sectors. Goods included 25k in construction & 19k in manufacturing.
The gain in services was pretty widespread. Only IT (-5k) was down a bit. The caution here is a) the nonfarm reference period may not capture later layoffs and b) there may be lags in terms of this sector.
Elsewhere in services, the financial sector including banks was flat on net during the reference period (pay period including the 12th day of each month versus the prior reference period for December). This may reflect the same issues as in IT. Leisure/hospitality hired a bunch (+128k), trade/transport was up +63k, and retail added 30k within the prior category.
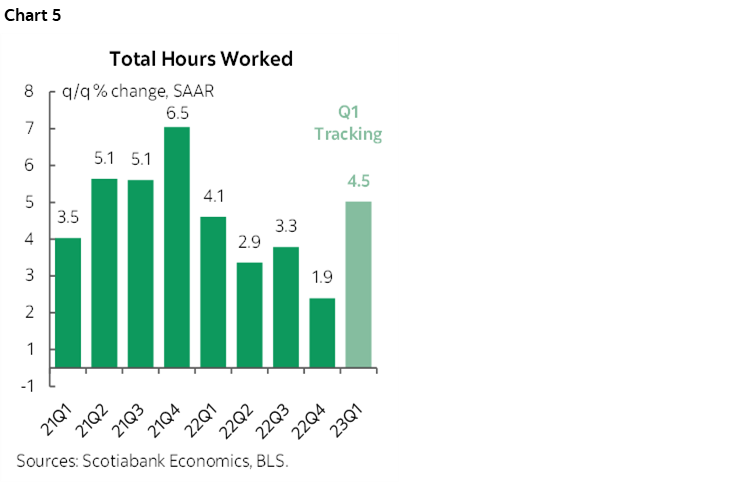
HOURS WORKED SOARED—Q1 GDP UNDERESTIMATED AGAIN?
Hours worked were up 1.2% m/m SA and so not only are more jobs being created, but with that we’re seeing more hours being worked in aggregate. Since GDP is an identity defined as hours worked times labour productivity itself defined as output (GDP) per hour worked, this leans toward a strong start to tracking 2023Q1 GDP growth. Hours worked are so far tracking a 4½% q/q SAAR gain into Q1 (chart 5). There would have to be a collapse in hours over the rest of the quarter or a collapse in labour productivity in order to start the year with a negative GDP handle. I’d very tentatively suggest that this could be shaping up to be the third consecutive quarter in which consensus is too bearish toward US GDP growth after blowing it into each of Q3 and Q4 when actual growth was much stronger than consensus expectations going into the reports.
Indeed, every macro measure of the US workforce is strong and operating against the narrative in some corners of the political spectrum that posits Americans have gotten lazy. Not. Hours worked are high. Employment levels are very high. The unemployment rate and underemployment rate are both very low. The US doesn't have great productivity growth but it's better than Canada and the UK by a long shot. US output per hour worked sagged in 2022H1 but has been generally solid q/q SAAR before and after that. The stylized macro facts make it hard to demonstrate evidence that American workers have lost their verve.
In fact I’d go further than that. The whole anti-consumer narrative for the US economy remains too strong. They have not had as little debt as at present in 22 years by the debt-to-income ratio. Debt service payments are toward record lows and while they will rise, they will likely cap out at a level compatible with keeping the consumer sector going. Cash balances are sky high. There remains pent-up services demand. Improving supply chains will make it possible to produce and sell to folks who still want to buy as evidenced by auto sales.
US AND CANADA ON THE SAME PAGE & HIGHER RATES DON’T ALWAYS KILL JOBS
As another aside, it's interesting that two countries' data within semi-integrated markets are telling us the same thing here. Against the argument that rising rates would crush employment or at the very least slow its gains, both Canada and the US have seen accelerating gains and upward revisions to estimated job growth for 2022 as a whole. Further, it's not the administered policy rates that started the hikes since March either. It's the 2s and 5s well in advance of that which seems like a pretty lengthy lag to at least expect decelerating gains not accelerating with positive upward revisions to all of 2022 in both countries.
As chart 6 shows, rising rates don’t have to crush employment. That didn't happen when the Fed hiked in the prior pre-pandemic cycle. Granted it didn't hike the nominal rate as much, but it's the real rate that matters more.
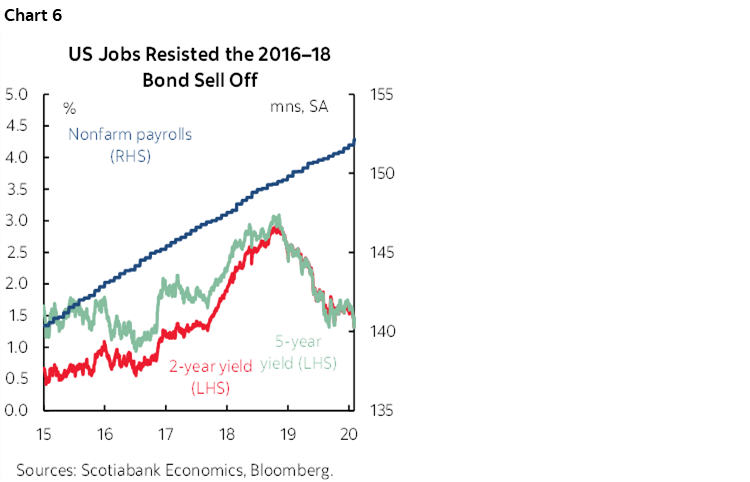
So when you have two countries beside each other that are fairly integrated and both are shedding the same signals, that too should set a high bar against rejecting both sets of numbers.
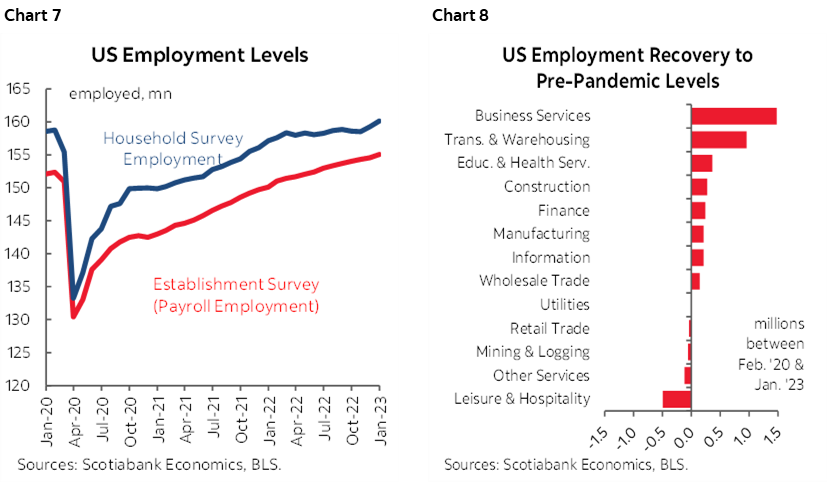
Overall, the level of US employment has fully recovered to pre-pandemic levels and then some (chart 7) and that’s true for most sectors (chart 8). Where it is not true, they are rapidly catching up.
DISCLAIMER
This report has been prepared by Scotiabank Economics as a resource for the clients of Scotiabank. Opinions, estimates and projections contained herein are our own as of the date hereof and are subject to change without notice. The information and opinions contained herein have been compiled or arrived at from sources believed reliable but no representation or warranty, express or implied, is made as to their accuracy or completeness. Neither Scotiabank nor any of its officers, directors, partners, employees or affiliates accepts any liability whatsoever for any direct or consequential loss arising from any use of this report or its contents.
These reports are provided to you for informational purposes only. This report is not, and is not constructed as, an offer to sell or solicitation of any offer to buy any financial instrument, nor shall this report be construed as an opinion as to whether you should enter into any swap or trading strategy involving a swap or any other transaction. The information contained in this report is not intended to be, and does not constitute, a recommendation of a swap or trading strategy involving a swap within the meaning of U.S. Commodity Futures Trading Commission Regulation 23.434 and Appendix A thereto. This material is not intended to be individually tailored to your needs or characteristics and should not be viewed as a “call to action” or suggestion that you enter into a swap or trading strategy involving a swap or any other transaction. Scotiabank may engage in transactions in a manner inconsistent with the views discussed this report and may have positions, or be in the process of acquiring or disposing of positions, referred to in this report.
Scotiabank, its affiliates and any of their respective officers, directors and employees may from time to time take positions in currencies, act as managers, co-managers or underwriters of a public offering or act as principals or agents, deal in, own or act as market makers or advisors, brokers or commercial and/or investment bankers in relation to securities or related derivatives. As a result of these actions, Scotiabank may receive remuneration. All Scotiabank products and services are subject to the terms of applicable agreements and local regulations. Officers, directors and employees of Scotiabank and its affiliates may serve as directors of corporations.
Any securities discussed in this report may not be suitable for all investors. Scotiabank recommends that investors independently evaluate any issuer and security discussed in this report, and consult with any advisors they deem necessary prior to making any investment.
This report and all information, opinions and conclusions contained in it are protected by copyright. This information may not be reproduced without the prior express written consent of Scotiabank.
™ Trademark of The Bank of Nova Scotia. Used under license, where applicable.
Scotiabank, together with “Global Banking and Markets”, is a marketing name for the global corporate and investment banking and capital markets businesses of The Bank of Nova Scotia and certain of its affiliates in the countries where they operate, including; Scotiabank Europe plc; Scotiabank (Ireland) Designated Activity Company; Scotiabank Inverlat S.A., Institución de Banca Múltiple, Grupo Financiero Scotiabank Inverlat, Scotia Inverlat Casa de Bolsa, S.A. de C.V., Grupo Financiero Scotiabank Inverlat, Scotia Inverlat Derivados S.A. de C.V. – all members of the Scotiabank group and authorized users of the Scotiabank mark. The Bank of Nova Scotia is incorporated in Canada with limited liability and is authorised and regulated by the Office of the Superintendent of Financial Institutions Canada. The Bank of Nova Scotia is authorized by the UK Prudential Regulation Authority and is subject to regulation by the UK Financial Conduct Authority and limited regulation by the UK Prudential Regulation Authority. Details about the extent of The Bank of Nova Scotia's regulation by the UK Prudential Regulation Authority are available from us on request. Scotiabank Europe plc is authorized by the UK Prudential Regulation Authority and regulated by the UK Financial Conduct Authority and the UK Prudential Regulation Authority.
Scotiabank Inverlat, S.A., Scotia Inverlat Casa de Bolsa, S.A. de C.V, Grupo Financiero Scotiabank Inverlat, and Scotia Inverlat Derivados, S.A. de C.V., are each authorized and regulated by the Mexican financial authorities.
Not all products and services are offered in all jurisdictions. Services described are available in jurisdictions where permitted by law.