- Retailers had a great June and Q2…
- ...but momentum was lost in July…
- ...especially in terms of core sales
- Q4 growth lies in doubt
- E-commerce is sharply higher…
- ...but still a modest share and skewed to domestic sources
CDN retail sales, headline / ex-autos, m/m % change, SA, June:
Actual: 23.7 / 15.7
Scotia: 24.5 / na
Consensus: 24.5 / 14.9
Prior: 18.7 / 10.6
July guidance: +0.7%
Given that we already had a solid idea of where June’s sales would land, the incremental information to markets is the soft guidance for July. It appears as if sales ex-autos and gas shrank in July. Overall, this will still translate into a massive gain in quarterly sales growth during Q3 over Q2, but it flags a caution with respect to momentum and how the math could evolve into the key holiday shopping season but obviously with a lot of hard data still ahead of us.
June’s sales gain of 23.7% m/m was in line with the prior preliminary guidance from StatsCan that sales were tracking a 24.5% rise. That view had already been digested by markets that also knew about auto sales and gas prices and had limited sector tracking to go with StatsCan’s guidance.
But the advance preliminary guidance that nominal sales were up by only 0.7% m/m in July in seasonally adjusted terms is the new information. Given that we’re tracking a large gain in auto sales volumes during July of around 16% m/m (here) and that we already know that gas prices were up by about 4½% m/m in July, the implication is that the value of retail sales in July ex-autos and gas is tracking a drop of around 4.5%. There is high uncertainty around the exact estimate of course, given it assumes flat gas station volumes and flat auto prices and we have a very limited sense of other sales. Still, applying the headline guidance from StatsCan with the autos and gas evidence we have implies lost momentum across the rest.
As for the rest of the details, here they are:
Sales volumes were up 22.9% m/m in June which suggests that most of the gain in the value of sales came through higher volumes. We don’t know volumes for July but as guided in the prior paragraph, they likely posted little if any growth while core sales volumes likely fell considerably. Chart 1 shows the total ‘v’ shaped recovery—but also how momentum in total retail sales volumes likely flattened in July.

By sector, higher gas prices and a resumption of kms driven drove gas station sales up 26.3% m/m in June. Autos and parts sales were up by 53% m/m with new car dealers up 63.8% m/m but bear in mind that sales at new car dealers are only up 1.7% y/y. Sales of furniture and furnishings were up 71% m/m, electronics/appliances were up 4.4% m/m and food sales were up 1.5% m/m. You must have bought a lot of wfh pyjamas in June folks, as clothing and accessories stores were up 142% m/m. Sporting goods/hobbies were up 65% m/m.
By region, the biggest gains during June were in Ontario (+33.8% m/m) and Toronto (+34.8%) despite Toronto’s lagging reopening. Quebec was in second place at 23.5% m/m but Montreal was up by 35.8%.
The quarterly tracking of retail sales volumes now looks like chart 2 and the following numbers:

Q1: -6.9% q/q SAAR
Q2: -41% q/q SAAR
Q3: +110.8% q/q SAAR
The Q3 tracking is despite apparent softness in July because of the way the math exited Q2 and slipped into Q3 with large gains in May–June that drove strong hand-off effects in Q3 growth. Vah-vah-vah-V! But the key is how momentum shifts by way of the quarterly math to potentially set up a slip in Q4 pending a lot of data still to come.
Also note that e-commerce is still just 5.5% of total retail sales, believe it or not. Still, e-commerce sales were up by 71% y/y in June. Nevertheless, e-commerce as a share of retail sales excluding things you don't normally buy over the 'net (like autos, gas, etc) and items you buy only in relatively small amounts over the 'net would be a considerably larger share. Autos and gas alone are one-third of total retail sales.
Retail sales only capture domestic sales, but it’s simply not true they materially underestimate e-commerce because of this which had been a misleading argument offered by the BoC. Chart 3 shows the proxy for sales through foreign e-commerce websites in that it captures imports through trade data via couriers and Canada Post. The volumes have always been very small relative to total retail sales, and through the pandemic, they have been in freefall.

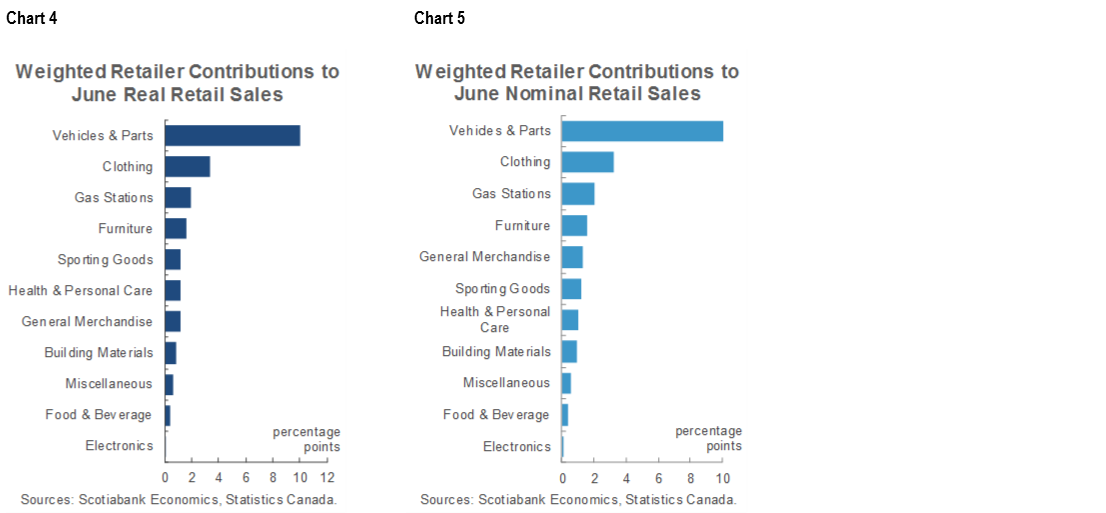
Charts 4 and 5 break down the weighted contributions to overall sales growth by sector in volume (chart 4) and value (chart 5) terms.
DISCLAIMER
This report has been prepared by Scotiabank Economics as a resource for the clients of Scotiabank. Opinions, estimates and projections contained herein are our own as of the date hereof and are subject to change without notice. The information and opinions contained herein have been compiled or arrived at from sources believed reliable but no representation or warranty, express or implied, is made as to their accuracy or completeness. Neither Scotiabank nor any of its officers, directors, partners, employees or affiliates accepts any liability whatsoever for any direct or consequential loss arising from any use of this report or its contents.
These reports are provided to you for informational purposes only. This report is not, and is not constructed as, an offer to sell or solicitation of any offer to buy any financial instrument, nor shall this report be construed as an opinion as to whether you should enter into any swap or trading strategy involving a swap or any other transaction. The information contained in this report is not intended to be, and does not constitute, a recommendation of a swap or trading strategy involving a swap within the meaning of U.S. Commodity Futures Trading Commission Regulation 23.434 and Appendix A thereto. This material is not intended to be individually tailored to your needs or characteristics and should not be viewed as a “call to action” or suggestion that you enter into a swap or trading strategy involving a swap or any other transaction. Scotiabank may engage in transactions in a manner inconsistent with the views discussed this report and may have positions, or be in the process of acquiring or disposing of positions, referred to in this report.
Scotiabank, its affiliates and any of their respective officers, directors and employees may from time to time take positions in currencies, act as managers, co-managers or underwriters of a public offering or act as principals or agents, deal in, own or act as market makers or advisors, brokers or commercial and/or investment bankers in relation to securities or related derivatives. As a result of these actions, Scotiabank may receive remuneration. All Scotiabank products and services are subject to the terms of applicable agreements and local regulations. Officers, directors and employees of Scotiabank and its affiliates may serve as directors of corporations.
Any securities discussed in this report may not be suitable for all investors. Scotiabank recommends that investors independently evaluate any issuer and security discussed in this report, and consult with any advisors they deem necessary prior to making any investment.
This report and all information, opinions and conclusions contained in it are protected by copyright. This information may not be reproduced without the prior express written consent of Scotiabank.
™ Trademark of The Bank of Nova Scotia. Used under license, where applicable.
Scotiabank, together with “Global Banking and Markets”, is a marketing name for the global corporate and investment banking and capital markets businesses of The Bank of Nova Scotia and certain of its affiliates in the countries where they operate, including, Scotiabanc Inc.; Citadel Hill Advisors L.L.C.; The Bank of Nova Scotia Trust Company of New York; Scotiabank Europe plc; Scotiabank (Ireland) Limited; Scotiabank Inverlat S.A., Institución de Banca Múltiple, Scotia Inverlat Casa de Bolsa S.A. de C.V., Scotia Inverlat Derivados S.A. de C.V. – all members of the Scotiabank group and authorized users of the Scotiabank mark. The Bank of Nova Scotia is incorporated in Canada with limited liability and is authorised and regulated by the Office of the Superintendent of Financial Institutions Canada. The Bank of Nova Scotia is authorised by the UK Prudential Regulation Authority and is subject to regulation by the UK Financial Conduct Authority and limited regulation by the UK Prudential Regulation Authority. Details about the extent of The Bank of Nova Scotia's regulation by the UK Prudential Regulation Authority are available from us on request. Scotiabank Europe plc is authorised by the UK Prudential Regulation Authority and regulated by the UK Financial Conduct Authority and the UK Prudential Regulation Authority.
Scotiabank Inverlat, S.A., Scotia Inverlat Casa de Bolsa, S.A. de C.V., and Scotia Derivados, S.A. de C.V., are each authorized and regulated by the Mexican financial authorities.
Not all products and services are offered in all jurisdictions. Services described are available in jurisdictions where permitted by law.