Mexico: Investment and consumption improved in January
Peru: 2021 data are starting to look really nice
MEXICO: INVESTMENT AND CONSUMPTION IMPROVED IN JANUARY
I. Investment recovery gained traction at start of 2021
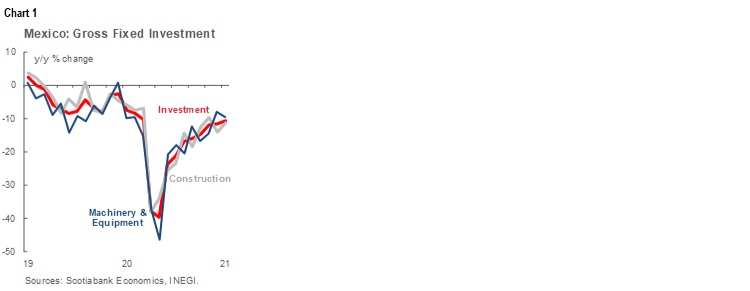
January gross fixed investment (GFI) data, released on Wednesday, April 7, by INEGI, showed that Mexico’s recovery in capital spending regained traction in the first month of 2021. Sequential growth in GFI climbed from -1.6% m/m in December to 3.3% m/m in January, driven by an increase in both construction growth, which accelerated to 2.9% m/m from the previous -2.3% m/m and machinery and equipment, up 4.2% m/m from -1.7% m/m in December. Investment appears to be recovering as economic outlooks or Mexico and the rest of the world become more favourable.
On an annual basis, January marked the eighth consecutive month in which the gap in GFI compared with a year ago narrowed, and we expect this trend to continue as the re-opening of key industries continues. From December’s -11.5% y/y loss, the annual contraction in GFI closed marginally to -10.6% y/y in January (chart 1), and outperformed analysts’ consensus estimate of -12.5% y/y. This marked two full years of y/y contractions. By components, January’s annual numbers were mixed. Investment in machinery and equipment further deepened its decline compared with a year ago from -8.1% y/y in December to -9.5% y/y in January. In contrast, construction spending improved from -14.1% y/y to -11.3% y/y (chart 1, again).
II. Consumption rebounded in January from December’s pause
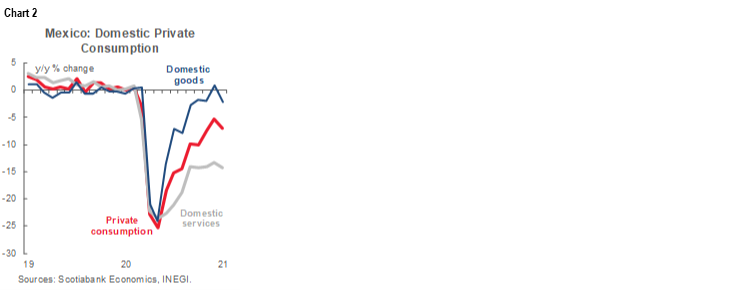
New private consumption numbers, also published on Wednesday, April 7, by INEGI, recorded a 1.0% m/m gain in January 2021, accelerating from the stall in December at -0.4% m/m. The recovery in household spending likely benefited by fewer mobility restrictions than in December and from the continued strong performance of remittances. Advance consumer confidence data points to even better consumer spending results for February and March.
By components of consumption, imported merchandise showed a recovery in the last months of 2020 and in the first month of 2021 (7.6% m/m). In contrast, the improvement in domestic merchandise consumption was significantly more modest (1.1% m/m).
Compared with a year ago—before the pandemic wreaked hardship on the economy—the annual decline in consumption deepened from -5.3% y/y in December to -7.1% y/y in January (chart 2). The recovery of consumption is expected to be positive but moderate, as more than 2 million formal jobs that were lost during the pandemic have yet to be recovered and inflation remained high in the first months of 2021, which may have dented the buying power of consumers’ wallets.
—Paulina Villanueva
PERU: 2021 DATA ARE STARTING TO LOOK REALLY NICE
Economic data that has been released so far for the February-March period have, mostly, surpassed expectations. Note that February was the last month in which year-on-year comparisons are vis-à-vis the pre-COVID-19 lockdown period in 2020 which began on March 15. Thus, year-on-year growth figures from March 2021 onward will be skewed by the low base of comparison. However, even taking this into account, the data so far have tended to beat projections. In some instances, we are seeing figures that surpass March 2019 (pre-COVID-19) levels.
I. March fiscal revenue rose impressively
The tax administrator, Sunat, sent a press release to the media on Tuesday, April 6, that reported a rather impressive 41.9% y/y increase in tax revenue in March. This ratifies the strong fiscal revenue trend we have been seeing since December. Income tax revenue was up 45% y/y and domestic sales tax (IGV) flows at PEN 3.204 bn rose 33.2% y/y (chart 3). The sharp increase in income tax revenue is fairly straightforward: March was the first month of the two-month income tax season, when mining companies, in particular, add significantly to public coffers. Tax season revenue (called “regularización”) was up 163% y/y in March. Higher metal prices in 2020 were certainly a factor, but perhaps more importantly, the increase was off a low year-on-year base due to a tax deferment plan that the government put in place in March 2020.

The deferment plan also skewed the IGV sales tax figures. Note that sales taxes paid in March are off of sales in February, so the high growth figure does not reflect the lockdown. In terms of magnitude, domestic IGV revenue is not much different from previous months.
Because 2020 was such an anomalous year, a comparison with 2019 tax revenue may be more revealing. Thus, it is extremely significant that tax revenue has been coming in much higher in 2021 than in 2019. Total tax revenue was up 21.7% this March versus March 2019, 18.4% in February, and 5.7% higher in January, than in the same months of 2019 (chart 4). And, lest one might think this is purely a result of higher metal prices, domestic IGV tax revenue followed a similar trend when compared with 2019: up 20.9% in March 2021, 10.2% in February, and 6.6% in January.

II. Cement consumption continued strongly in February
Cement consumption rose 15% y/y in February, according to data from the National Statistics Institute, INEI. This is all the stronger considering the mobility restrictions in February 2021 (no restrictions were in place in February 2020), and also that it was a shorter month this year than in 2020, which was a leap year. Investment in infrastructure has been high over the past few months, and has become more important than real estate construction in driving cement demand.
III. Government spending in February was also solid
According to the INEI (same source as for cement), government investment rose 17% y/y, in February. It is our understanding that government investment growth was even greater in March. Note, however, that the INEI provides preliminary figures that are typically a bit higher than the official BCRP figures which will be released later this month. Even so, infrastructure investment is clearly improving.
IV. March electricity consumption and vehicles sales soar
We have two figures, so far, for March, both of which are strongly positive. Electricity volumes were up 14.8% y/y in March. However, there was an immense before and after point (March 16) around which the lockdown began in 2020. For the first half of March, electricity demand fell -2.7% y/y, whereas in the second half of the month electricity soared 31% y/y because of the 2020 lockdown.
Vehicle sales in March were robust and more or less in line with pre-COVID-19 levels. After a drop in February, when COVID-19 restrictions were in place, vehicle sales returned to normal levels in March (chart 5). However, a normal March meant a nearly 95% y/y increase in sales, given the lockdown in March 2020.

Both soaring electricity demand and vehicle sales growth in March are representative of the magnitude of figures we’ll be seeing a lot more of over the next few months as this year’s figures compare with last year’s lockdown. For reference, the main phases of the lockdown lasted until July.
All in all, the figures that we are beginning to see for February and March are moderately better than expected, especially when one considers the mobility restrictions in place during this period. However, they are not quite strong enough yet for us to alter our forecast of 8.7% y/y growth for 2021: this forecast hinges significantly on the elections results and on whether there will be further COVID-19-related restrictions driven by the scale of the current COVID-19 wave. For now, we prefer to wait to revisit our forecasts.
—Guillermo Arbe
DISCLAIMER
This report has been prepared by Scotiabank Economics as a resource for the clients of Scotiabank. Opinions, estimates and projections contained herein are our own as of the date hereof and are subject to change without notice. The information and opinions contained herein have been compiled or arrived at from sources believed reliable but no representation or warranty, express or implied, is made as to their accuracy or completeness. Neither Scotiabank nor any of its officers, directors, partners, employees or affiliates accepts any liability whatsoever for any direct or consequential loss arising from any use of this report or its contents.
These reports are provided to you for informational purposes only. This report is not, and is not constructed as, an offer to sell or solicitation of any offer to buy any financial instrument, nor shall this report be construed as an opinion as to whether you should enter into any swap or trading strategy involving a swap or any other transaction. The information contained in this report is not intended to be, and does not constitute, a recommendation of a swap or trading strategy involving a swap within the meaning of U.S. Commodity Futures Trading Commission Regulation 23.434 and Appendix A thereto. This material is not intended to be individually tailored to your needs or characteristics and should not be viewed as a “call to action” or suggestion that you enter into a swap or trading strategy involving a swap or any other transaction. Scotiabank may engage in transactions in a manner inconsistent with the views discussed this report and may have positions, or be in the process of acquiring or disposing of positions, referred to in this report.
Scotiabank, its affiliates and any of their respective officers, directors and employees may from time to time take positions in currencies, act as managers, co-managers or underwriters of a public offering or act as principals or agents, deal in, own or act as market makers or advisors, brokers or commercial and/or investment bankers in relation to securities or related derivatives. As a result of these actions, Scotiabank may receive remuneration. All Scotiabank products and services are subject to the terms of applicable agreements and local regulations. Officers, directors and employees of Scotiabank and its affiliates may serve as directors of corporations.
Any securities discussed in this report may not be suitable for all investors. Scotiabank recommends that investors independently evaluate any issuer and security discussed in this report, and consult with any advisors they deem necessary prior to making any investment.
This report and all information, opinions and conclusions contained in it are protected by copyright. This information may not be reproduced without the prior express written consent of Scotiabank.
™ Trademark of The Bank of Nova Scotia. Used under license, where applicable.
Scotiabank, together with “Global Banking and Markets”, is a marketing name for the global corporate and investment banking and capital markets businesses of The Bank of Nova Scotia and certain of its affiliates in the countries where they operate, including; Scotiabank Europe plc; Scotiabank (Ireland) Designated Activity Company; Scotiabank Inverlat S.A., Institución de Banca Múltiple, Grupo Financiero Scotiabank Inverlat, Scotia Inverlat Casa de Bolsa, S.A. de C.V., Grupo Financiero Scotiabank Inverlat, Scotia Inverlat Derivados S.A. de C.V. – all members of the Scotiabank group and authorized users of the Scotiabank mark. The Bank of Nova Scotia is incorporated in Canada with limited liability and is authorised and regulated by the Office of the Superintendent of Financial Institutions Canada. The Bank of Nova Scotia is authorized by the UK Prudential Regulation Authority and is subject to regulation by the UK Financial Conduct Authority and limited regulation by the UK Prudential Regulation Authority. Details about the extent of The Bank of Nova Scotia's regulation by the UK Prudential Regulation Authority are available from us on request. Scotiabank Europe plc is authorized by the UK Prudential Regulation Authority and regulated by the UK Financial Conduct Authority and the UK Prudential Regulation Authority.
Scotiabank Inverlat, S.A., Scotia Inverlat Casa de Bolsa, S.A. de C.V, Grupo Financiero Scotiabank Inverlat, and Scotia Inverlat Derivados, S.A. de C.V., are each authorized and regulated by the Mexican financial authorities.
Not all products and services are offered in all jurisdictions. Services described are available in jurisdictions where permitted by law.